

Replication and Analysis of Ebbinghaus' Forgetting Curve
- PMID: 26148023
- PMCID: PMC4492928
- DOI: 10.1371/journal.pone.0120644
Replication and Analysis of Ebbinghaus' Forgetting Curve
Abstract
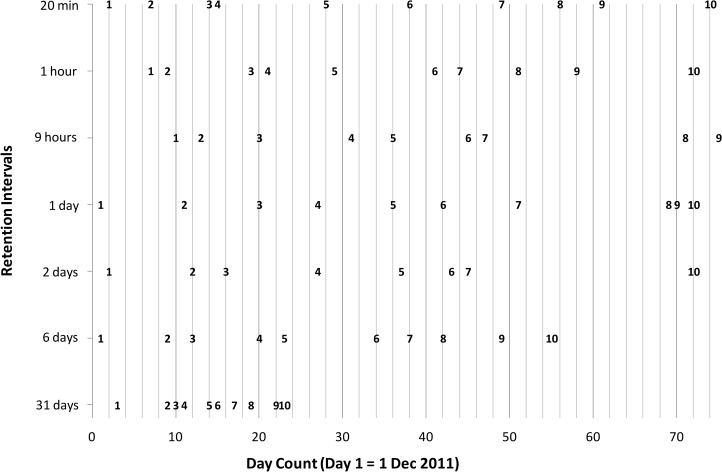
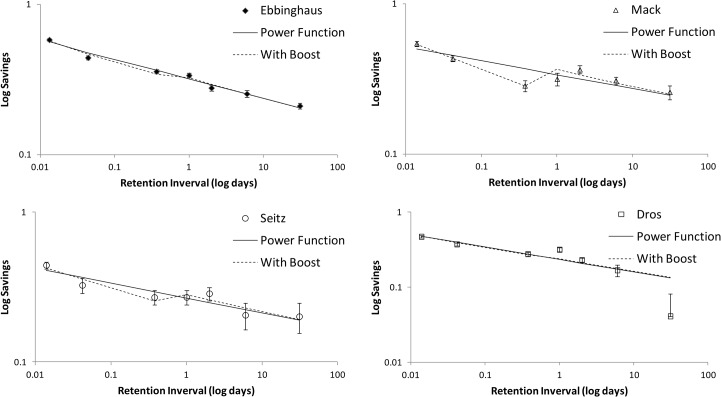
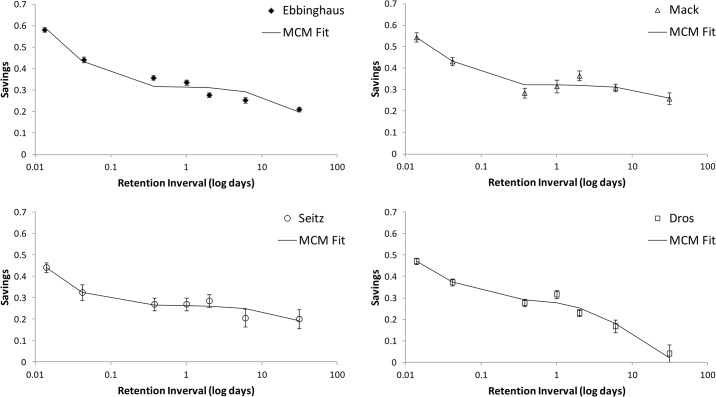
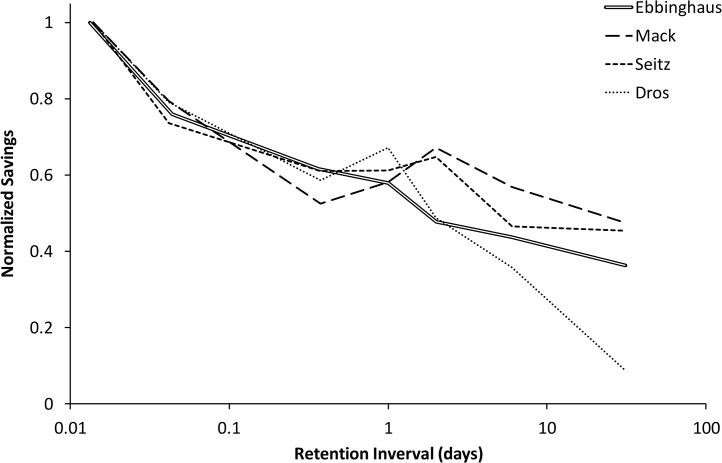
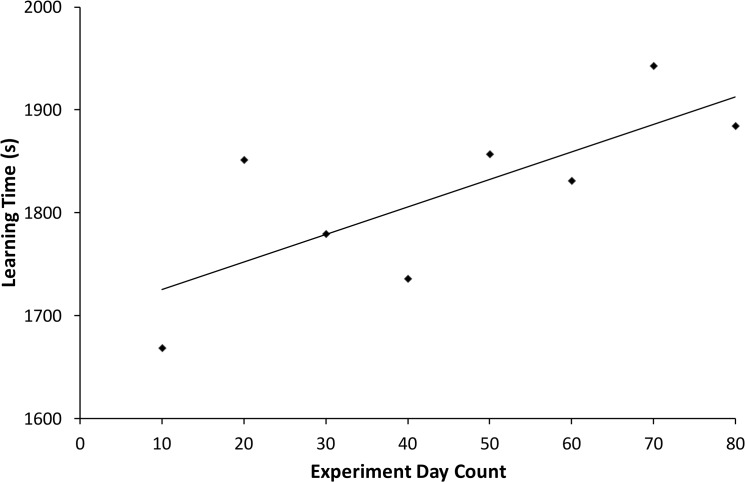
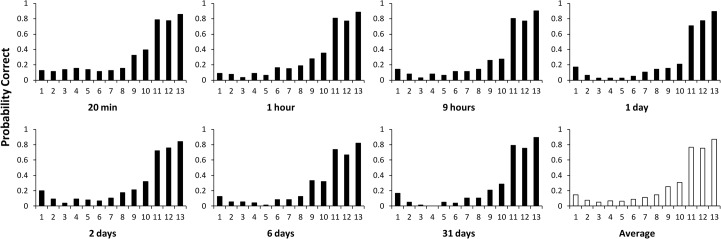
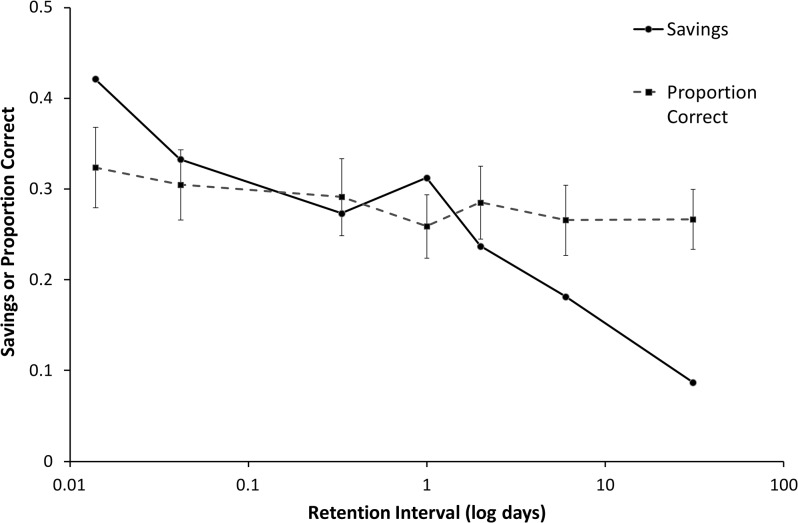
We present a successful replication of Ebbinghaus' classic forgetting curve from 1880 based on the method of savings. One subject spent 70 hours learning lists and relearning them after 20 min, 1 hour, 9 hours, 1 day, 2 days, or 31 days. The results are similar to Ebbinghaus' original data. We analyze the effects of serial position on forgetting and investigate what mathematical equations present a good fit to the Ebbinghaus forgetting curve and its replications. We conclude that the Ebbinghaus forgetting curve has indeed been replicated and that it is not completely smooth but most probably shows a jump upwards starting at the 24 hour data point.
Conflict of interest statement
Figures
References
-
- Anderson JR, Schooler LJ (1991) Reflections of the environment in memory. Psychological Science 2: 396–408.
-
- Rubin DC, Wenzel AE (1996) One hundred years of forgetting: A quantitative description of retention. Psychological Review 103: 734–760.
-
- Wixted JT, Carpenter SK (2007) The Wickelgren Power Law and the Ebbinghaus Savings Function. Psychological Science 18: 133–134. - PubMed
-
- Wixted JT, Ebbesen EB (1991) On the form of forgetting. Psychological Science 2: 409–415.
-
- Bartlett FC (1932) Rembering. Cambridge: Cambridge University Press.
MeSH terms
LinkOut - more resources
Full Text Sources
Other Literature Sources
Medical
