. 2016 Apr 14;35(15):1919-25.
doi: 10.1038/onc.2015.255. Epub 2015 Jul 6.

Structural basis of how stress-induced MDMX phosphorylation activates p53

Affiliations

Structural basis of how stress-induced MDMX phosphorylation activates p53

X Chen et al. Oncogene. .

Abstract

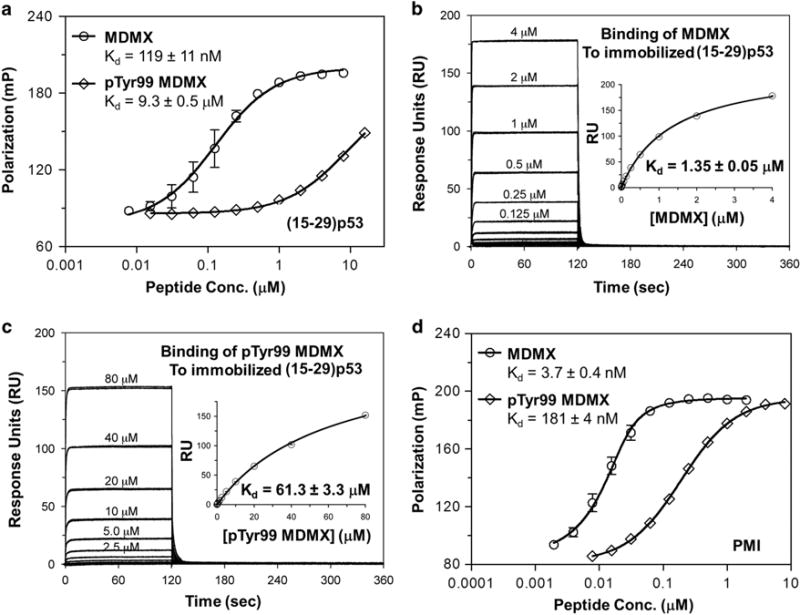
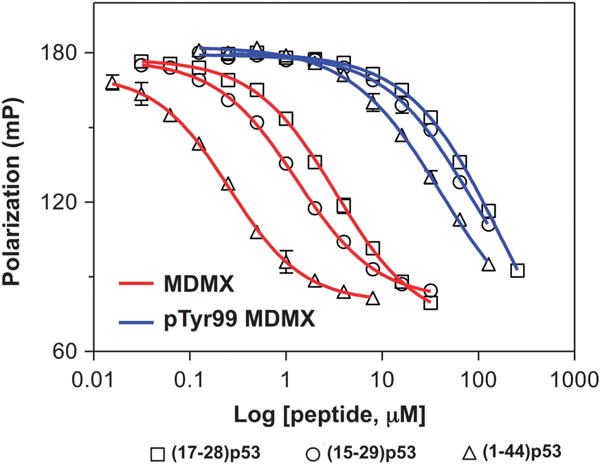
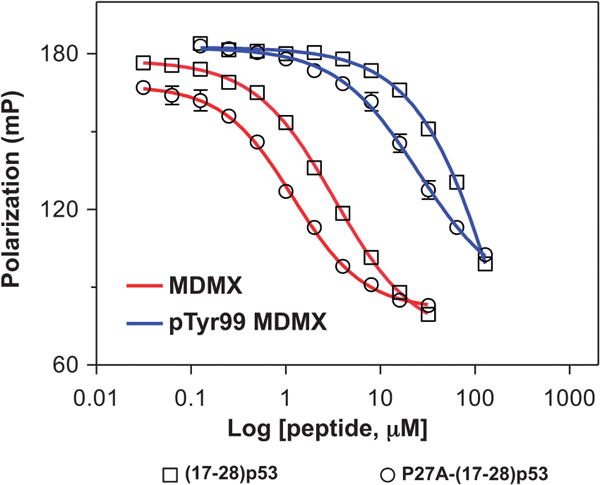
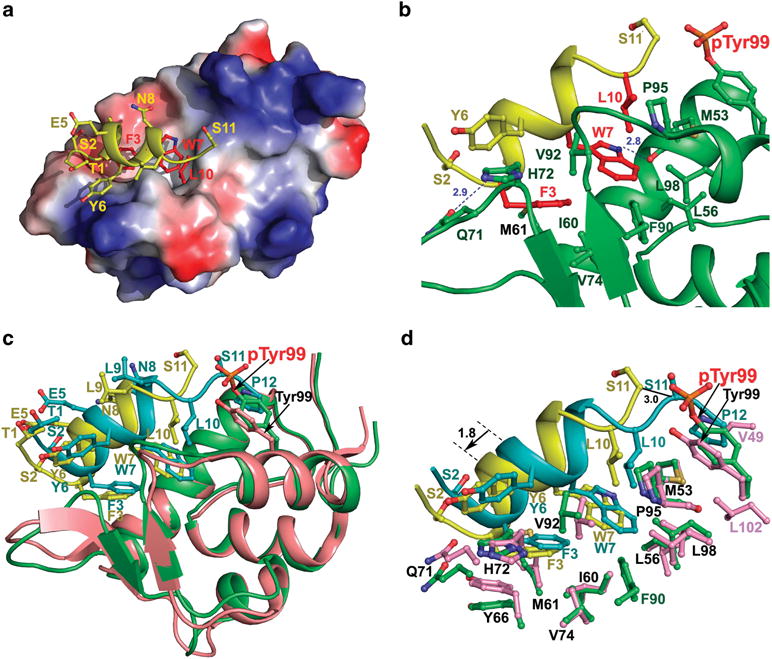
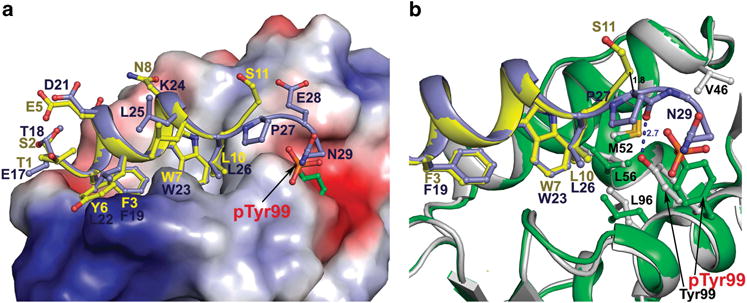
The tumor-suppressor protein p53 is tightly controlled in normal cells by its two negative regulators--the E3 ubiquitin ligase MDM2 and its homolog MDMX. Under stressed conditions such as DNA damage, p53 escapes MDM2- and MDMX-mediated functional inhibition and degradation, acting to prevent damaged cells from proliferating through induction of cell cycle arrest, DNA repair, senescence or apoptosis. Ample evidence suggests that stress signals induce phosphorylation of MDM2 and MDMX, leading to p53 activation. However, the structural basis of stress-induced p53 activation remains poorly understood because of the paucity of technical means to produce site-specifically phosphorylated MDM2 and MDMX proteins for biochemical and biophysical studies. Herein, we report total chemical synthesis, via native chemical ligation, and functional characterization of (24-108)MDMX and its Tyr99-phosphorylated analog with respect to their ability to interact with a panel of p53-derived peptide ligands and PMI, a p53-mimicking but more potent peptide antagonist of MDMX, using FP and surface plasmon resonance techniques. Phosphorylation of MDMX at Tyr99 weakens peptide binding by approximately two orders of magnitude. Comparative X-ray crystallographic analyses of MDMX and of pTyr99 MDMX in complex with PMI as well as modeling studies reveal that the phosphate group of pTyr99 imposes extensive steric clashes with the C-terminus of PMI or p53 peptide and induces a significant lateral shift of the peptide ligand, contributing to the dramatic decrease in the binding affinity of MDMX for p53. Because DNA damage activates c-Abl tyrosine kinase that phosphorylates MDMX at Tyr99, our findings afford a rare glimpse at the structural level of how stress-induced MDMX phosphorylation dislodges p53 from the inhibitory complex and activates it in response to DNA damage.


Conflict of interest statement

CONFLICT OF INTEREST

The authors declare no conflict of interest.

Figures

Figure 1
Figure 1
Binding affinities of (15–29) p53 (a–c) and PMI (d) for MDMX and pTyr99 MDMX as quantified by FP (a and d) and surface plasmon resonance (SPR) (b and c) techniques. For FP measurements at room temperature on a Tecan Infinite M1000 plate reader, succinimidyl ester-activated carboxytetramethylrhodamine (TAMRA-NHS) was covalently conjugated to the Lys24 side chain of an N-acetyl-(15–29) p53 and the N-terminus of PMI. Serially diluted MDMX protein was prepared in PBS (pH 7.4) in 96-well plates and incubated for 30 min with 20 nM TAMRA-labeled peptide in a total volume of 100 μl per well before readings were taken at λex =530 nM, λem= 580 nM. Non-linear regression analyses were performed as described to give rise to Kd values (mean ± s.e.m., n = 3); each curve is the mean of three independent measurements with the error bars denoting s.e.m. SPR-based steady-state binding assays were carried out at 25 °C on a Biacore T100 instrument using a CM5 sensor chip to which (15–29) p53 is covalently attached via its N-terminus or Lys24 side chain. The buffer (HBS-EP) was 10 mM HEPES, 150 mM NaCl and 0.005% surfactant P20, pH 7.4. MDMX proteins prepared in HBS-EP buffer in a twofold serial dilution were injected onto the p53 peptide-immobilized sensor chip at a flow rate of 20 μl/min for 2 min, followed by 4 min dissociation. Non-linear regression analyses were performed as described to yield Kd values (mean ±s.e.m., n =2); each curve is the mean of two independent measurements with the error bars denoting s.e.m.
Figure 2
Figure 2
Competitive binding of p53 peptides of different lengths to MDMX and pTyr99 MDMX as measured by FP techniques. Serially diluted p53 peptide was prepared in PBS (pH 7.4), to which 10 nM TAMRA-PMI and 50 nM MDMX or 1 μM pTyr99 MDMX were added in a total volume of 120 μl per well. After a 30-min incubation at room temperature, FP was measured at λex = 530 nM, λem = 580 nM. Nonlinear regression analyses were performed as described to give rise to half maximal inhibitory concentration (IC50) values from three independent experiments. IC50 values are tabulated in Table 1.
Figure 3
Figure 3
Competitive binding of P27A-(17–28) p53 peptide to MDMX and pTyr99 MDMX as measured by FP techniques. The experimental parameters were described in Figure 2 caption. For comparison and clarity, the competition curves of (17–28) p53 from Figure 2 were re-plotted in this figure.
Figure 4
Figure 4
PMI in complex with pTyr99 MDMX (a and b) and structural comparison of PMI-pTyr99 MDMX and PMI-MDMX complexes (c and d). (a) Electrostatic potential is displayed over the molecular surface of pTyr99 MDMX to show the hydrophobic pocket accommodating the most critical residues for binding, Phe3, Trp7 and Leu10 of PMI (shown in red). The electrostatic potential surface is colored red for negative, blue for positive and white for apolar. The PMI peptide is shown as a ribbon and stick representation, where nitrogen atoms are colored blue and oxygen atoms red. (b) Interface of the PMI-pTyr99 MDMX complex. The PMI peptide and pTyr99 MDMX are shown as ribbons, and the side chains at the interface are shown as sticks. Hydrogen bonds are shown as blue dashes. PMI anchors Phe3, Trp7 and Leu10 within the hydrophobic p53-binding pocket lined with Met53, Leu56, Val74, Met61, Phe90, Pro95 and Leu98. The predominant hydrophobic interactions of Phe3, Trp7 and Leu10 are supplemented with two hydrogen bonds involving Phe3 and Trp7 and formed between Phe3 N and Gln71 Oε1 (2.9Å) and between Trp7 Nε1 and Met53 O (2.8Å). (c) PMI-pTyr99 MDMX (yellow/green) and PMI-MDMX (cyan/pink) complexes are aligned based on MDMX molecule from the PMI-MDMX complex (PDB code 3EQY). Residues of PMI and pTyr99/Tyr99 are shown as sticks. (d) Close-up view into the interfaces of PMI-pTyr99 MDMX and PMI-MDMX complexes. Ser2, Phe3, Tyr6, Trp7 and Leu10, Ser11 and Pro12 of PMI, and residues of pTyr99 MDMX and MDMX contributing to the binding are shown as sticks.
Figure 5
Figure 5
Structural comparison of PMI-pTyr99 MDMX and p53-MDMX complexes. The structure of the PMI-pTyr99 MDMX complex (green/yellow) was superimposed onto the p53-MDMX complex (blue/grey) (PDB code 3DAC) based on MDMX molecules. (a) Electrostatic potential is displayed over the molecular surface of MDMX. PMI and p53 peptides are shown as ribbons and colored yellow and blue, respectively. pTyr99/Tyr99 and residues of PMI and p53 are shown as sticks. (b) The PMI-pTyr99 MDMX and p53-MDMX binding interfaces. Contact residues of pTyr99 MDMX and MDMX contributing to the binding of the C-terminal portion of PMI or p53 peptide are shown as sticks. The hydrogen bond formed between Pro27 O and Tyr99 Oη in the p53-MDMX complex is shown as blue dashes.

References

    1. Wade M, Li YC, Wahl GM. MDM2, MDMX and p53 in oncogenesis and cancer therapy. Nat Rev Cancer. 2013;13:83–96. - PMC - PubMed
    1. Levine AJ, Oren M. The first 30 years of p53: growing ever more complex. Nat Rev Cancer. 2009;9:749–758. - PMC - PubMed
    1. Vogelstein B, Lane D, Levine AJ. Surfing the p53 network. Nature. 2000;408:307–310. - PubMed
    1. Vousden KH, Lane DP. p53 in health and disease. Nat Rev Mol Cell Biol. 2007;8:275–283. - PubMed
    1. Wade M, Wang YV, Wahl GM. The p53 orchestra: Mdm2 and Mdmx set the tone. Trends Cell Biol. 2010;20:299–309. - PMC - PubMed

Publication types

MeSH terms