. 2015 Oct;29(10):4374-83.
doi: 10.1096/fj.15-273649. Epub 2015 Jul 6.

Multiple microRNAs within the 14q32 cluster target the mRNAs of major type 1 diabetes autoantigens IA-2, IA-2β, and GAD65

Affiliations

Multiple microRNAs within the 14q32 cluster target the mRNAs of major type 1 diabetes autoantigens IA-2, IA-2β, and GAD65

Liron Abuhatzira et al. FASEB J. 2015 Oct.

Abstract

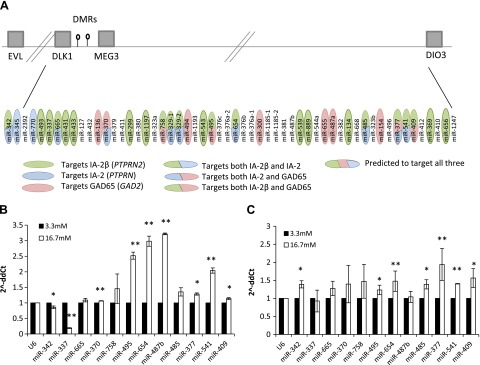
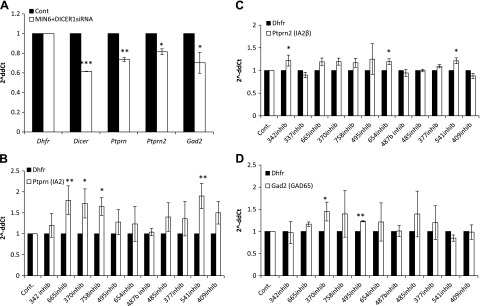
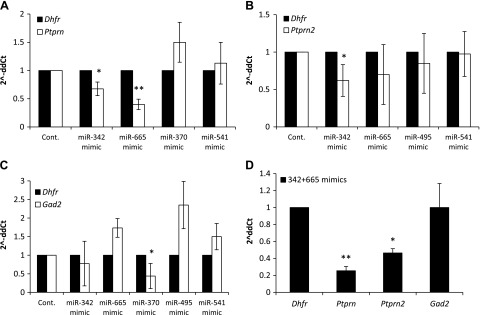
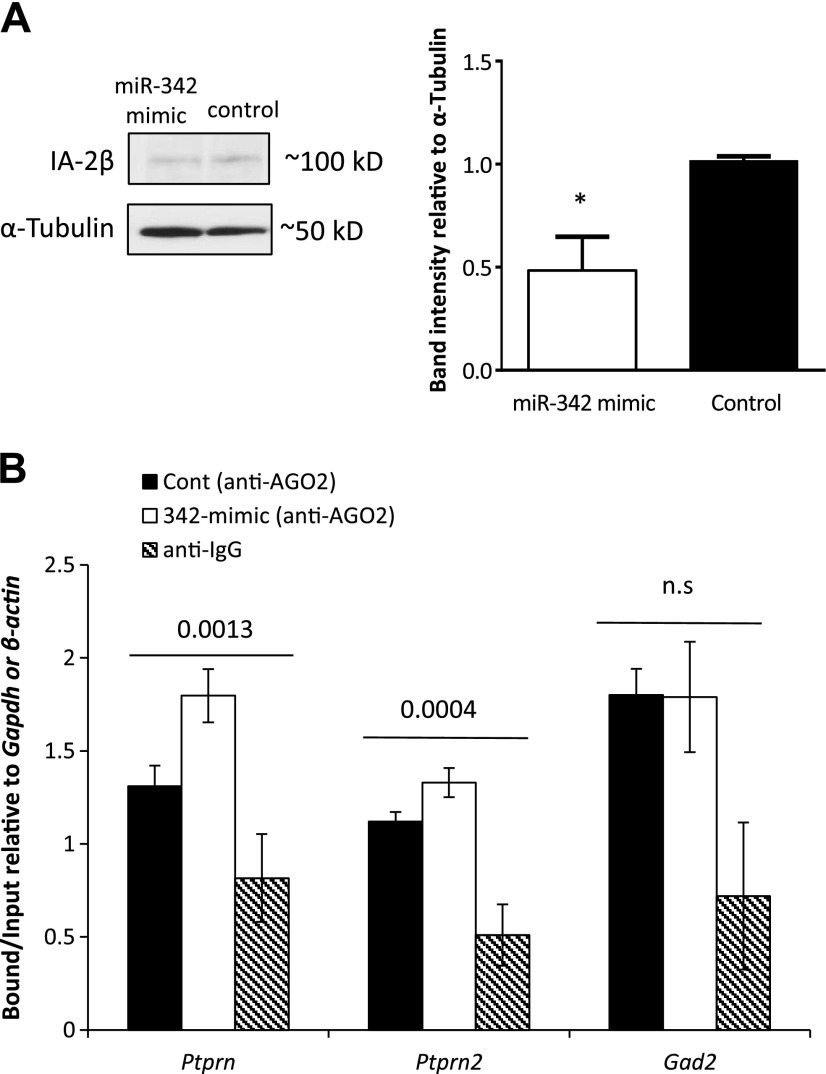
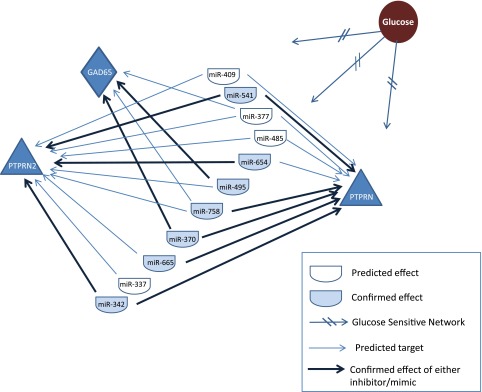
Islet antigen (IA)-2, IA-2β, and glutamate decarboxylase (GAD65) are major autoantigens in type 1 diabetes (T1D). Autoantibodies to these autoantigens appear years before disease onset and are widely used as predictive markers. Little is known, however, about what regulates the expression of these autoantigens. The present experiments were initiated to test the hypothesis that microRNAs (miRNAs) can target and affect the levels of these autoantigens. Bioinformatics was used to identify miRNAs predicted to target the mRNAs coding IA-2, IA-2β, and GAD65. RNA interference for the miRNA processing enzyme Dicer1 and individual miRNA mimics and inhibitors were used to confirm the effect in mouse islets and MIN6 cells. We show that the imprinted 14q32 miRNA cluster contains 56 miRNAs, 32 of which are predicted to target the mRNAs of T1D autoantigens and 12 of which are glucose-sensitive. Using miRNA mimics and inhibitors, we confirmed that at least 7 of these miRNAs modulate the mRNA levels of the T1D autoantigens. Dicer1 knockdown significantly reduced the mRNA levels of all 3 autoantigens, further confirming the importance of miRNAs in this regulation. We conclude that miRNAs are involved in regulating the expression of the major T1D autoantigens.

Keywords: autoimmune diabetes; glucose-sensitive; miR-342; miRNA.


Figures

Figure 1.
Figure 1.
A) The 14q32 miRNA cluster. Gray boxes represent some of the genes on the cluster, lollipops represent the 2 DMRs (IG-DMR and MEG3-DMR). Distances and locations are not drawn to scale. Ovals represent miRNAs predicted to target PTPRN2 (green), PTPRN (blue), GAD2 (pink), or both PTPRN2 and PTPRN (half green/blue ovals), PTPRN and GAD2 (half blue/pink ovals), PTPRN2 and GAD2 (half green/pink ovals), or all 3 (green/blue/pink oval) based on TargetScan and miRWalk target prediction algorithms. B) miRNA expression after glucose stimulation in mouse islets. qReal-time PCR analysis of the 12 miRNAs in the 14q32 cluster (predicted to target Ptprn2, Ptprn, and Gad2) after glucose stimulation for 72 h (16.7 mM; white) compared with exposure to 3.3 mM glucose for 72 h (black) in freshly isolated mouse islets. *P < 0.04, **P < 0.005. C) miRNA expression after glucose stimulation in the MIN6 cell line. qReal-time PCR analysis of the same 12 miRNAs after glucose stimulation for 72 h (16.7 mM glucose, white vs. 3.3 mM, black) in the mouse insulinoma cell line MIN6. *P < 0.04, **P < 0.01. Fold change is presented as 2−ΔΔCt, relative to the small nuclear RNA gene U6. Vertical lines represent sd. Experiments were repeated at least 3 times.
Figure 2.
Figure 2.
Endogenous target expression after transfection with Dicer siRNA and with the different miRNA inhibitors in MIN6 cells. qReal-time PCR analysis of expression. A) Transient transfection with siRNA for Dicer1, relative to transfection with a negative scrambled sequence and mock transfection. *P < 0.05, **P < 0.002, P < 1.3e-05. B) Ptprn expression levels after transfection with miRNA inhibitors for 72 h. *P < 0.03, **P < 0.002. C) Ptprn2 expression levels after transfection with miRNA inhibitors for 72 h. *P < 0.04. D) Gad2 expression levels after transfection with miRNA inhibitors for 72 h. *P < 0.04, **P < 0.002. Fold change is presented as 2−ΔΔCt relative to a transfection control samples and normalized to Dhfr or β-actin. Vertical lines represent sd. All experiments were repeated at least 3 times.
Figure 3.
Figure 3.
Endogenous target levels after overexpressing different miRNAs in MIN6 cells by using mimic transfections. A) Ptprn expression levels 72 h after transfection with miRNA mimics. *P < 0.05, **P < 0.01. B) Ptprn2 expression levels 72 h after transfection with miRNA mimics. *P < 0.04. C) Gad2 expression levels 72 h after transfection with miRNA mimics. *P < 0.05. D) mRNA expression level of all 3 autoantigens 72 h after transfection with a combination of miR-342 and -665 mimics. *P < 0.004, **P < 0.002. Analyses were performed by qReal-time PCR. Fold change is presented as 2−ΔΔCt relative to a transfection control samples and normalized to Dhfr or β-actin. Vertical lines represent sd. All experiments were repeated at least 3 times.
Figure 4.
Figure 4.
A) Effect of miR-342 mimic on IA-2β. A) IA-2β protein level 72 h after transfection with the miR-342 mimic in MIN6 cells. A representative Western blot of the endogenous IA-2β and α-tubulin, with protein extracts from MIN6 cells 72 h after transfection with a control sequence or miR-342 mimic (left). Average of adjusted density values after Image J quantification on 3 different blots normalized to α-tubulin (right). Experiments were repeated 3 times, and similar results were obtained. Error bar, sd. *P < 0.015. B) RIP PCR analysis, with anti-Ago2 antibody or anti-IgG (background control) used to assess the changes in enrichment of miRNA:mRNA in silencing complexes after miR-342 over expression for 48–72 h in MIN6 cells with Ptprn-, Ptprn-, and Gad2-specific primers, relative to the input fraction (10% of material before immunoprecipitation). Enrichment was quantified with qReal-time PCR. Fold change is presented as bound fraction over input fraction, normalized to Gapdh or β-actin. Error bars, sd. Experiments were repeated at least 3 times.
Figure 5.
Figure 5.
A glucose-sensitive miRNA network. Glucose (brown circle) affects the expression levels of (at least) 11 different miRNAs from the 14q32 cluster (half ovals) that in turn target the genes Ptprn, Ptprn2, and Gad2, which encode, respectively, 3 of the major T1D autoantigens: IA-2, IA-2β, and GAD65. Arrows: miRNA targets. Some of these miRNAs target more than 1 gene (2 or 3 arrows originating from the same miRNA). Dark arrows: confirmed targets.

References

    1. Pihoker C., Gilliam L. K., Hampe C. S., Lernmark A. (2005) Autoantibodies in diabetes. Diabetes 54(Suppl 2), S52–S61 - PubMed
    1. Cai T., Hirai H., Zhang G., Zhang M., Takahashi N., Kasai H., Satin L. S., Leapman R. D., Notkins A. L. (2011) Deletion of Ia-2 and/or Ia-2β in mice decreases insulin secretion by reducing the number of dense core vesicles. Diabetologia 54, 2347–2357 - PMC - PubMed
    1. Harashima S. I., Harashima C., Nishimura T., Hu Y., Notkins A. L. (2007) Overexpression of the autoantigen IA-2 puts beta cells into a pre-apoptotic state: autoantigen-induced, but non-autoimmune-mediated, tissue destruction. Clin. Exp. Immunol. 150, 49–60 - PMC - PubMed
    1. Caromile L. A., Oganesian A., Coats S. A., Seifert R. A., Bowen-Pope D. F. (2010) The neurosecretory vesicle protein phogrin functions as a phosphatidylinositol phosphatase to regulate insulin secretion. J. Biol. Chem. 285, 10487–10496 - PMC - PubMed
    1. Kubosaki A., Nakamura S., Notkins A. L. (2005) Dense core vesicle proteins IA-2 and IA-2beta: metabolic alterations in double knockout mice. Diabetes 54(Suppl 2), S46–S51 - PubMed

Publication types

MeSH terms

LinkOut - more resources