

Metabonomic analysis of potential biomarkers and drug targets involved in diabetic nephropathy mice
- PMID: 26149603
- PMCID: PMC4493693
- DOI: 10.1038/srep11998
Metabonomic analysis of potential biomarkers and drug targets involved in diabetic nephropathy mice
Abstract
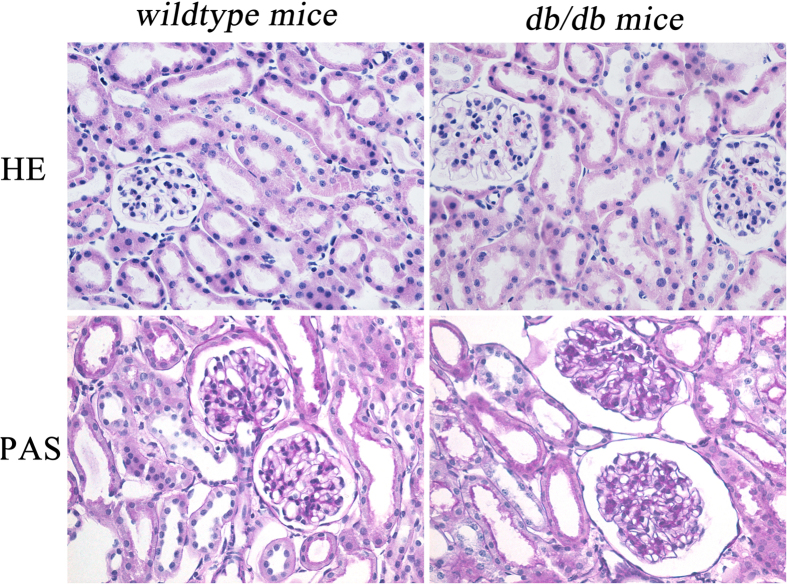
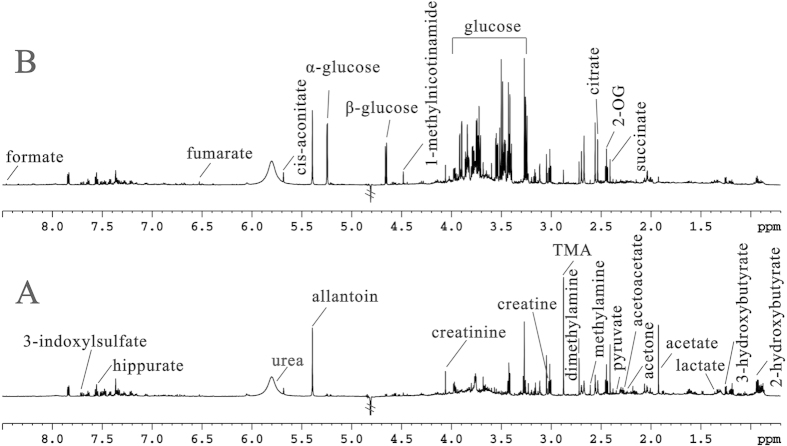
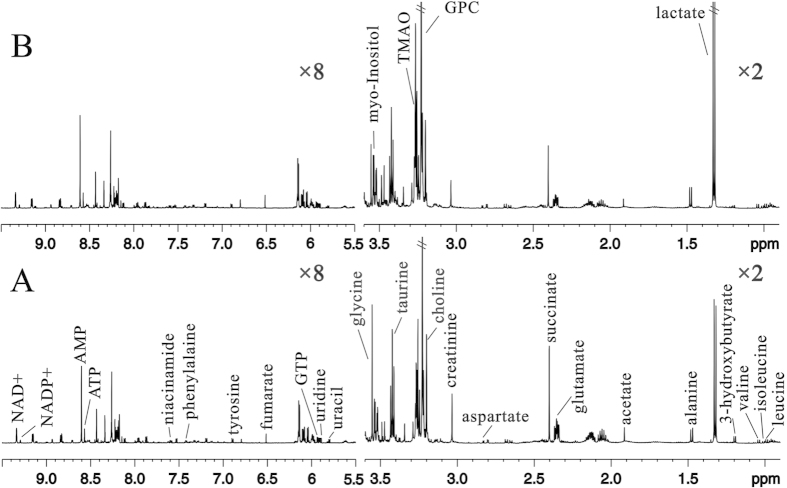
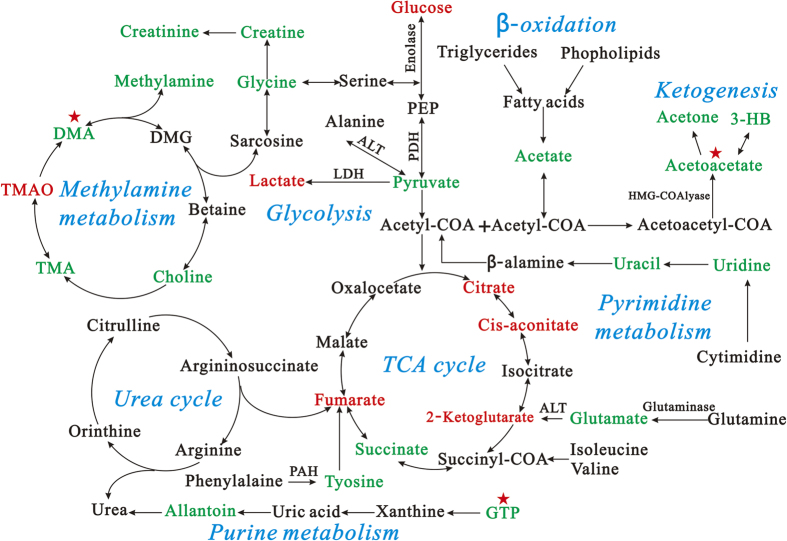
Diabetic nephropathy (DN) is one of the lethal manifestations of diabetic systemic microvascular disease. Elucidation of characteristic metabolic alterations during diabetic progression is critical to understand its pathogenesis and identify potential biomarkers and drug targets involved in the disease. In this study, (1)H nuclear magnetic resonance ((1)H NMR)-based metabonomics with correlative analysis was performed to study the characteristic metabolites, as well as the related pathways in urine and kidney samples of db/db diabetic mice, compared with age-matched wildtype mice. The time trajectory plot of db/db mice revealed alterations, in an age-dependent manner, in urinary metabolic profiles along with progression of renal damage and dysfunction. Age-dependent and correlated metabolite analysis identified that cis-aconitate and allantoin could serve as biomarkers for the diagnosis of DN. Further correlative analysis revealed that the enzymes dimethylarginine dimethylaminohydrolase (DDAH), guanosine triphosphate cyclohydrolase I (GTPCH I), and 3-hydroxy-3-methylglutaryl-CoA lyase (HMG-CoA lyase) were involved in dimethylamine metabolism, ketogenesis and GTP metabolism pathways, respectively, and could be potential therapeutic targets for DN. Our results highlight that metabonomic analysis can be used as a tool to identify potential biomarkers and novel therapeutic targets to gain a better understanding of the mechanisms underlying the initiation and progression of diseases.
Figures

 ) at various time points (9-wk, 11-wk, 13-wk, 15-wk and 17-wk), and the age-matched wildtype mice (
 ). (B) The PLS-DA score plot based on 1H-NMR spectra of urine samples from db/db mice 9-wk (
 ), 11-wk (
 ), 13-wk (
 ), 15-wk (
 ) and 17-wk (
 ). (C) is the loading plot revealing the metabolites with large intensities responsible for the discrimination of the corresponding score plot shown (A).
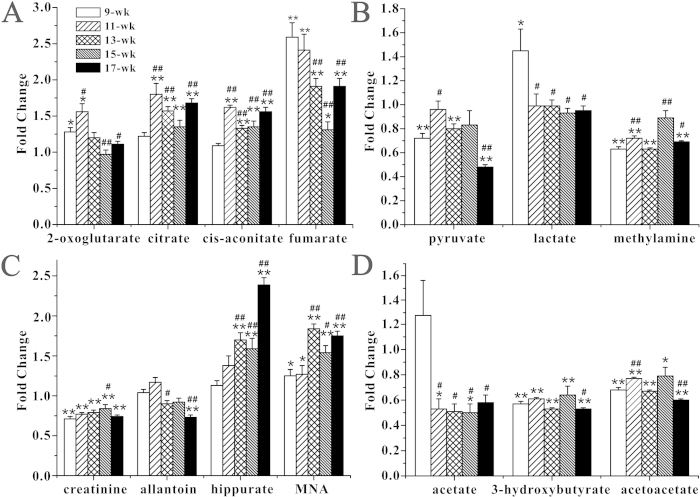
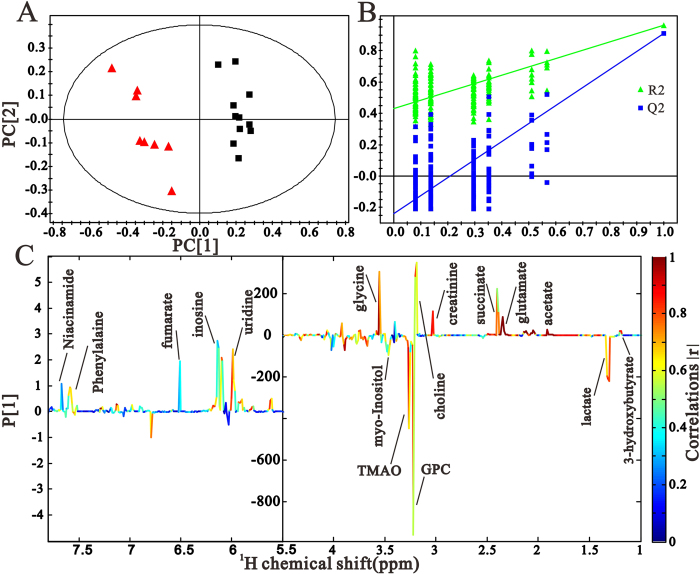 ) and db/db mice (). The coefficient-coded loading plot (C) corresponding to PLS-DA revealing the metabolites with large intensities responsible for the discrimination of the corresponding score plots.
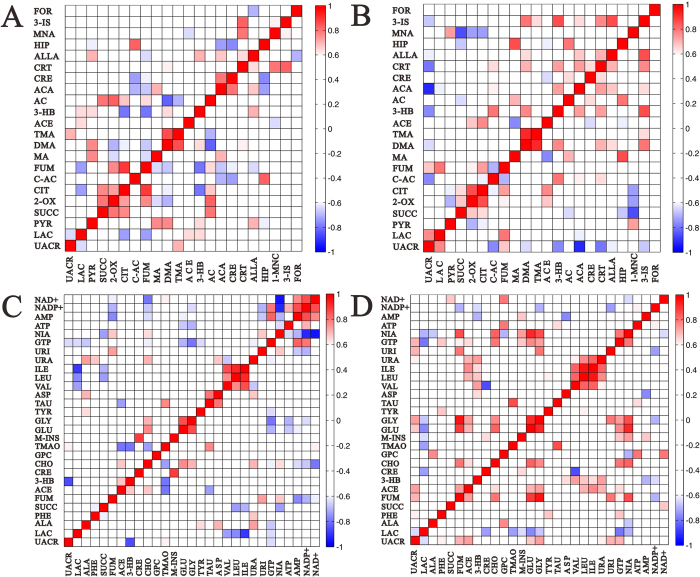
References
-
- Shockcor J. P. & Holmes E. Metabonomic applications in toxicity screening and disease diagnosis. Curr. Top. Med. Chem. 2, 35–51 (2002). - PubMed
-
- Nicholson J. K., Lindon J. C. & Holmes E. ‘Metabonomics’: understanding the metabolic responses of living systems to pathophysiological stimuli via multivariate statistical analysis of biological NMR spectroscopic data. Xenobiotica 29, 1181–1189 (1999). - PubMed
Publication types
MeSH terms
Substances
LinkOut - more resources
Full Text Sources
Other Literature Sources
Medical
Molecular Biology Databases
Miscellaneous
