Review
. 2015 Nov;59(10):1246-59.
doi: 10.1111/aas.12581. Epub 2015 Jul 7.

Microcirculatory dysfunction and tissue oxygenation in critical illness

Affiliations
Review

Microcirculatory dysfunction and tissue oxygenation in critical illness

L Østergaard et al. Acta Anaesthesiol Scand. 2015 Nov.

Abstract

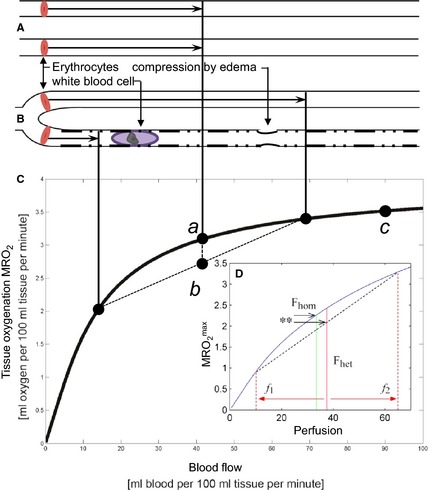
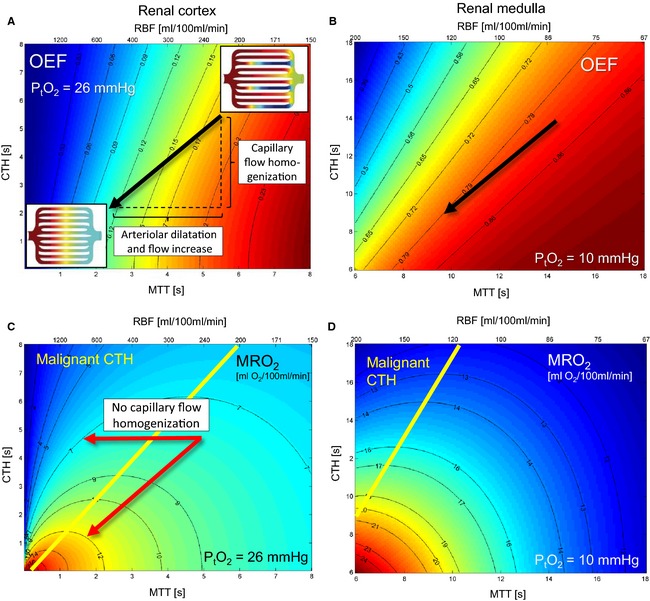
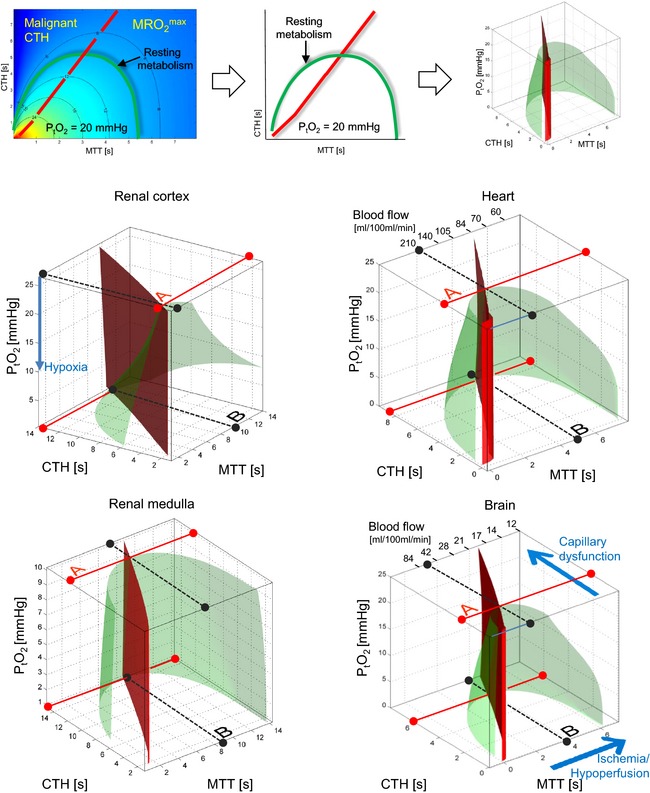
Severe sepsis is defined by organ failure, often of the kidneys, heart, and brain. It has been proposed that inadequate delivery of oxygen, or insufficient extraction of oxygen in tissue, may explain organ failure. Despite adequate maintenance of systemic oxygen delivery in septic patients, their morbidity and mortality remain high. The assumption that tissue oxygenation can be preserved by maintaining its blood supply follows from physiological models that only apply to tissue with uniformly perfused capillaries. In sepsis, the microcirculation is profoundly disturbed, and the blood supply of individual organs may therefore no longer reflect their access to oxygen. We review how capillary flow patterns affect oxygen extraction efficacy in tissue, and how the regulation of tissue blood flow must be adjusted to meet the metabolic needs of the tissue as capillary flows become disturbed as observed in critical illness. Using the brain, heart, and kidney as examples, we discuss whether disturbed capillary flow patterns might explain the apparent mismatch between organ blood flow and organ function in sepsis. Finally, we discuss diagnostic means of detecting capillary flow disturbance in animal models and in critically ill patients, and address therapeutic strategies that might improve tissue oxygenation by modifying capillary flow patterns.


Figures

Figure 1
Figure 1
The flow‐diffusion equation for oxygen. The flow‐diffusion equation curve (Panel C) shows the amount of oxygen, which can diffuse into tissue from its capillaries, as a function of tissue blood flow. Until recently, this text‐book relation has been used without attention to its underlying assumption: That all erythrocytes pass through tissue capillaries at identical velocity, as illustrated in Panel A. As shown in Panel B, this ‘hidden assumption’ is critical: Any deviations from this ‘homogeneity requirement’ lead us to overestimate tissue oxygenation if we base our oxygenation assessments on tissue blood flow. This is most easily realized by the following thought experiment: Imagine that blood cell velocities slows down in half of all tissue capillaries – but speed up in the remaining capillaries such that total tissue blood flow remains identical to that in Panel A. The homogeneity requirement applies to both ‘slow’ and ‘fast’ capillaries in Panel B – and the net oxygen availability in Panel B is therefore the average labeled b – and thus always lower than a, the net oxygen availability in Panel B. Note how homogenization + hyperperfusion (b → c) provides a larger increase in tissue oxygenation than hyperperfusion with homogenous capillary flow (a → c). Erythrocyte velocities in fact homogenize during hyperemia, counteracting the tendency of curve C to yield less extra oxygen per unit blood flow increase as flow increases.22 In the next thought experiment, we increase the average flow velocity in Panel A from Fhom to Fhet, and then slow half of the capillaries as in Panel B – giving rise to populations of capillaries with flows f1 and f2, and net tissue blood flow Fhet. Note how tissue oxygen availability in fact decreases although blood flow increased, as indicated by the double asterisk. Conversely, a reduction in blood flow can paradoxically improve tissue oxygenation if capillary flow patterns are homogenized in parallel. Capillary patency may hence be crucial for the validity of fundamental physiological properties that we normally take for granted. The hindered capillary passage indicated in Panel B is the sum of pre‐existing age‐ or disease‐related changes, and sepsis‐related changes such as increased white blood cell numbers, altered endothelial surface properties (loss of glycocalyx, and so forth), and/or external edema pressure.
Figure 2
Figure 2
Effects of mean transit time (MTT) and capillary transit time heterogeneity (CTH) on oxygen extraction in the kidney for fixed oxygen tension (PtO2). Rather than the two capillary flow values assumed in Fig. 1, we now use an accepted distribution for capillary transit times (a so‐called gamma‐variate distribution),90 and use the standard deviation of this to quantify what we refer to as CTH. The mean value of this distribution – the MTT – is related to renal blood flow (RBF) and capillary blood volume (CBV) through the central volume theorem, RBF = RBV/MTT.91 Our extended flow‐diffusion equation22 estimates the oxygen extraction fraction (OEF) that corresponds to a given MTT, CTH, and tissue oxygen tension (PtO2) in steady‐state. Then, tissue oxygenation (the metabolic rate of oxygen, MRO 2, supported by a given MTT and CTH at a certain PtO2) is given by OEF times the arterial oxygen concentration (0.19 ml/ml), times RBF. Note that tissue MTT and RBF can be used interchangeably when tissue CBV is known. Figure 2A and B show contour plots of OEF for combinations of MTT and CTH in the renal cortex and medulla, for tissue oxygen tensions of 26 mmHg and 10 mmHg, respectively. In this figure, consider a steady‐state where oxygen availability matches oxygen utilization at a certain PtO2. In Fig. 3, consider this condition over a range of tissue oxygen tensions, and hence values of OEF. Note that the OEF always increases with increasing MTT and with decreasing CTH. The arrow indicates the changes in MTT and CTH that typically occur during hyperemic episodes in brain: It appears to be an inherent property of normal, passive capillary beds that CTH changes in proportion to MTT, which helps maintain efficient oxygen extraction during hyperperfusion, without fluctuations in tissue oxygen tension.22, 24 The corresponding tissue oxygen availability, MRO 2, is shown in units of ml O2/100 ml/min in Fig. 2C and D. Note that the tissue oxygen availability MRO 2 always increases with decreasing CTH – but not necessarily with RBF: Hemodynamic states above the yellow line in 2C and D are unique in that reductions in MTT (increases in RBF) fail to increase tissue oxygen availability: These states are referred to as having malignant CTH. The horizontal arrow in Panel C again demonstrates why the reduction in CTH during hyperemia is so crucial: The oblique arrow shows how oxygenation increases about 50% (from 8 to 12 ml O2/100 ml/min) when MTT and CTH change in parallel. In the absence of capillary flow homogenization (horizontal arrow), however, the same vasodilation and increase in blood flow reduced oxygenation from 8 to 7 ml/100 ml/min. For the renal cortex, we fixed k, the bidirectional rate constant for oxygen transport across the capillary wall – and our extended flow‐diffusion equation's only unknown parameter22 – by literature values obtained in dog and man: At a RBF of 440 ml/100 ml/min, an OEF of 0.12 was used, assuming CBV = 20 ml/100 ml (corresponding to MTT = 2.7 s), and PtO= 26 mmHg.92, 93 For the renal medulla, the corresponding values were OEF = 0.8, RBF = 110 ml/100 ml/min, and PtO2 = 10 mmHg, at a similar CBV (corresponding to MTT = 11 s).94 In both tissue types, CTH was set to 0.95∙MTT during this calibration step, based on experimental data used in our previous analysis.22 Figure 2C and D were constructed assuming normal arterial blood oxygen concentrations (0.19 ml/ml) and absence of capillary occlusions (fraction of open capillaries = 1.0). These MRO values can easily be corrected for any deviations from these assumptions in that MRO 2 scales with both the fraction of perfused capillaries (e.g., as observed by side‐stream dark‐field imaging) and arterial oxygen saturation. For example, a reduction in oxygen saturation from 100% to 95% and a reduction in the proportion of perfused capillaries from 100% to 90%, leads to a correction factor of 0.95∙0.9 = 0.855, i.e., a 14.5% reduction in the oxygen availabilities in Fig. 2C and D.
Figure 3
Figure 3
Tissue hypoperfusion, hyperperfusion, and capillary dysfunction (elevated CTH) can all lead to critical reductions in oxygen availability. The top row illustrates how the green surface in each plot is generated by joining the MRO 2 iso‐contours (cf. Fig. 2C and D) that correspond to these organs’ resting metabolic rate of oxygen across all values of PtO2. The green half‐cone therefore contain combinations of MTT, CTH, and PtO2 that, biophysically, can support the metabolic needs of renal cortex and medulla, heart, and brain, in the resting, awake state. The red plane marks the boundary, left of which vasodilation no longer improves tissue oxygen availability (malignant CTH). The full, red lines (labeled A) illustrates how much capillary flow patterns can be disturbed before the tissue's loss of oxygenated blood due functional shunting threatens each organs resting metabolism at its ‘normal’ PtO2. In reality, tissue oxygen utilization increases OEF and result in a parallel decrease in PtO2 as oxygen delivery approaches the rate of utilization in tissue. As capillary flow patterns become more disturbed, PtO2 is therefore expected to fall. Biophysically, tissue can maintain sufficient oxygen supplies to support its resting metabolism until CTH reaches a critical, upper limit (full, red line at zero PtO2). Note how this requires the loss of oxygenated blood to be attenuated – by a reduction in blood flow. Accordingly, the ‘optimal blood flow’ as capillary flows become critically heterogeneous (labeled B), is lower than each organs normal, resting blood flow. The blood flow that optimizes total oxygen extraction at critically elevated CTH is thus roughly 85 ml/100 ml/min in the heart and 21 ml/10 ml/min in the brain, compared to normal resting flow values of roughly 100 ml/100 ml/min in the heart and 45 ml/10 ml/min in the brain. Note that resting oxygen utilization in the renal medulla can only be supported within a narrow range of flow values only (corresponding to MTT between 8 and 12 s) when CTH becomes high (larger than 14 s). Surprisingly, relative hypoperfusion is therefore energetically favorable in conditions of elevated CTH, as we expect in sepsis. Also note that blood flow must stay within increasingly narrow limits as CTH approaches its critical, upper limit and PtO2 approaches zero: Here, any further increase in CTH, any changes in blood flow (both increases and reductions), any reductions in arterial oxygen content, and any loss of perfused capillaries (See legend of Fig. 2 for the effects of reduced capillary volume and oxygen saturation) will reduce oxygen availability below the needs of normal tissue function. The figures for brain and heart were adapted from Jespersen and Østergaard22 and Østergaard et al.25.

Similar articles

Cited by

References

    1. Hotchkiss RS, Karl IE. The pathophysiology and treatment of sepsis. N Engl J Med 2003; 348: 138–50. - PubMed
    1. Parker MM, Shelhamer JH, Natanson C, Alling DW, Parrillo JE. Serial cardiovascular variables in survivors and nonsurvivors of human septic shock: heart rate as an early predictor of prognosis. Crit Care Med 1987; 15: 923–9. - PubMed
    1. Kreymann G, Grosser S, Buggisch P, Gottschall C, Matthaei S, Greten H. Oxygen consumption and resting metabolic rate in sepsis, sepsis syndrome, and septic shock. Crit Care Med 1993; 21: 1012–9. - PubMed
    1. Hayes MA, Timmins AC, Yau EH, Palazzo M, Hinds CJ, Watson D. Elevation of systemic oxygen delivery in the treatment of critically ill patients. N Engl J Med 1994; 330: 1717–22. - PubMed
    1. Wan L, Bagshaw SM, Langenberg C, Saotome T, May C, Bellomo R. Pathophysiology of septic acute kidney injury: what do we really know? Crit Care Med 2008; 36: S198–203. - PubMed

Publication types

LinkOut - more resources