Review
. 2015 Aug;16(8):441-58.
doi: 10.1038/nrg3934. Epub 2015 Jul 7.

Systems biology and gene networks in neurodevelopmental and neurodegenerative disorders

Affiliations
Review

Systems biology and gene networks in neurodevelopmental and neurodegenerative disorders

Neelroop N Parikshak et al. Nat Rev Genet. 2015 Aug.

Abstract

Genetic and genomic approaches have implicated hundreds of genetic loci in neurodevelopmental disorders and neurodegeneration, but mechanistic understanding continues to lag behind the pace of gene discovery. Understanding the role of specific genetic variants in the brain involves dissecting a functional hierarchy that encompasses molecular pathways, diverse cell types, neural circuits and, ultimately, cognition and behaviour. With a focus on transcriptomics, this Review discusses how high-throughput molecular, integrative and network approaches inform disease biology by placing human genetics in a molecular systems and neurobiological context. We provide a framework for interpreting network biology studies and leveraging big genomics data sets in neurobiology.


Conflict of interest statement

Competing interests statement

The authors declare no competing interests.

Figures

Figure 1
Figure 1. Molecular systems and the neurobiological hierarchy
a | Genetic variants exert their effects on cognitive and behavioural phenotypes associated with neurodevelopmental or neurodegenerative disease through a neurobiological hierarchy that includes multiple molecular levels (transcriptomic, proteomic and epigenomic) that can be modelled as networks on the basis of physical interactions and correlations within and across multiple molecular levels (BOX 2). These molecular levels of organization can vary at multiple neurobiological phenotypic levels (cells, circuits, and cognition and behaviour) across the lifespan. b | Gene expression levels vary dramatically across development and ageing, brain regions and cell types, as illustrated by three genes: SMARCC2, which is a pan-regional neurodevelopmental gene; MET, a regionally patterned adult neuronal gene; and OLIG1, a gene most highly expressed in white matter and oligodendrocytes. Development and ageing data are from BrainCloud, regional data are from Braineac and cell type expression data are from fluorescent-activated cell sorted transcriptomes from mouse cortex (http://web.stanford.edu/group/barreslab/brainrnaseq.html). c | Both the molecular and phenotypic levels exhibit a typical trajectory with normal variation during development and ageing that can be altered in disease, resulting in abnormal temporal trajectories. The x axis on this plot reflects the progression of time, and the y axis reflects theoretical deviation from the normal trajectory for any molecular or phenotypic measurement. CPi, inner cortical plate; CPo, outer cortical plate; CRBL, cerebellum; FCTX, frontal cortex; HIPP, hippocampus; ISVZ, inner subventricular zone; IZ, intermediate zone; lncRNA, long noncoding RNA; MEDU, brainstem medulla; miRNA, microRNA; OCTX, occipital cortex; OSVZ, outer subventricular zone; PUTM, putamen; SNIG, substantia nigra; SP, subplate; TCTX, temporal cortex; THAL, thalamus; VZ, ventricular zone; WHMT, subcortical white matter.
Figure 2
Figure 2. Flowchart of transcriptomic analysis and illustration of seeded and genome-wide approaches to network analysis
A flowchart demonstrating the general approach to a transcriptomic study that uses differential gene expression (DGE) and network analysis (part a). Network-level features, such as connectivity ranking and module-level enrichment, allow the integration of many external data sources and experiments. Network analysis involves first (part b) connecting genetic or molecular nodes with information about pairwise relationships, which may be one or more of the following: statistical associations relating molecular patterns measured across experiments, such as variation in gene expression levels across brain regions; physical interaction data from experiments or curated from the literature such as transcription factor (TF) or RNA-binding protein (RNABP) binding or protein–protein interactions (PPIs); or computational predictions about TF or RNABP binding using motif enrichment analysis (here, U on the RNA motif is depicted as T). Next, the structure of the network is used to (part c) define modules using a seed-based or genome-wide approach, which groups together the genes that share similar edge-level properties. The seeded (prior-based) approach is shown on the left-hand side, and the unseeded (genome-wide) approach on the right-hand side. The seeded approach involves starting with genes of interest, expanding edges to bring in additional (unannotated) genes and identifying highly connected components as modules. The unseeded approach (right-hand side) involves starting with unannotated genes, using edges to identify interconnected components as modules and then evaluating where genes of interest fall in the resultant network structure. Modules from either approach can be further annotated with external information such as genetic associations and known pathways, integrated with additional data or used to prioritize targets for experimental validation (see BOX 2 and TABLE 1 for more details). Alternative depictions of the network analysis process are also available elsewhere,,. GO, Gene Ontology; KEGG, Kyoto Encyclopaedia of Genes and Genome Elements.
Figure 3
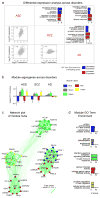
Figure 3. Transcriptomic convergence and divergence across central nervous system disorders
Transcriptomics can systematically compare genes and pathways across neurobiological disorders. To provide a simple example, we compare genome-wide expression patterns in the cerebral cortex across published microarray studies of autism spectrum disorder (ASD), schizophrenia (SCZ) and Alzheimer disease (AD) (part a). We applied differential gene expression (DGE) analysis across these disorders in a pairwise manner and performed a meta-analysis with weighted gene co-expression network analysis (WGCNA). Please see Supplementary information S1 (box) for details. The bottom-left half of the comparisons shows pairwise comparison of DGE across conditions. ASD–SCZ and ASD–AD are significantly correlated in DGE changes, as demonstrated by Spearman correlations (ρ values) between genome-wide DGE effect sizes in each disorder. On the upper-right half of the comparisons, Gene Ontology (GO) term enrichment of pairwise shared upregulated and downregulated changes demonstrates that upregulated inflammation and downregulated synaptic function and oxidative phosphorylation are common to all three disorders. Results are shown as enrichment Z scores for pathway enrichment, Z > 2 suggests enrichment. WGCNA across these three conditions identified five modules (labelled with different colours) that are perturbed across at least one condition, as demonstrated by differences in eigengene expression (*p < 0.05,**p < 0.01,***p < 0.001, two-tailed t-test) (part b). The top ten interconnected (hub) genes in each module with edges reflecting the strength of correlation between genes reveals (part c) and GO term enrichment for each module (part d). MHC, major histocompatibility complex.

Similar articles

Cited by

References

    1. Gratten J, Wray NR, Keller MC, Visscher PM. Large-scale genomics unveils the genetic architecture of psychiatric disorders. Nat Neurosci. 2014;17:782–790. A comprehensive review of GWASs and exome studies across major neuropsychiatric disorders. It discusses the role of common variants and rare variants across disorders, and the concept of explaining heritability. - PMC - PubMed
    1. Beyer A, Bandyopadhyay S, Ideker T. Integrating physical and genetic maps: from genomes to interaction networks. Nat Rev Genet. 2007;8:699–710. - PMC - PubMed
    1. Bullmore E, Sporns O. Complex brain networks: graph theoretical analysis of structural and functional systems. Nat Rev Neurosci. 2009;10:186–198. - PubMed
    1. Geschwind DH, Konopka G. Neuroscience in the era of functional genomics and systems biology. Nature. 2009;461:908–915. - PMC - PubMed
    1. Grant S. Systems biology in neuroscience: bridging genes to cognition. Curr Opin Neurobiol. 2003;13:577–582. - PubMed

Publication types

MeSH terms