. 2016 Apr;16(2):164-72.
doi: 10.1038/tpj.2015.50. Epub 2015 Jul 7.

Genetic screening reveals a link between Wnt signaling and antitubulin drugs

Affiliations

Genetic screening reveals a link between Wnt signaling and antitubulin drugs

A H Khan et al. Pharmacogenomics J. 2016 Apr.

Abstract

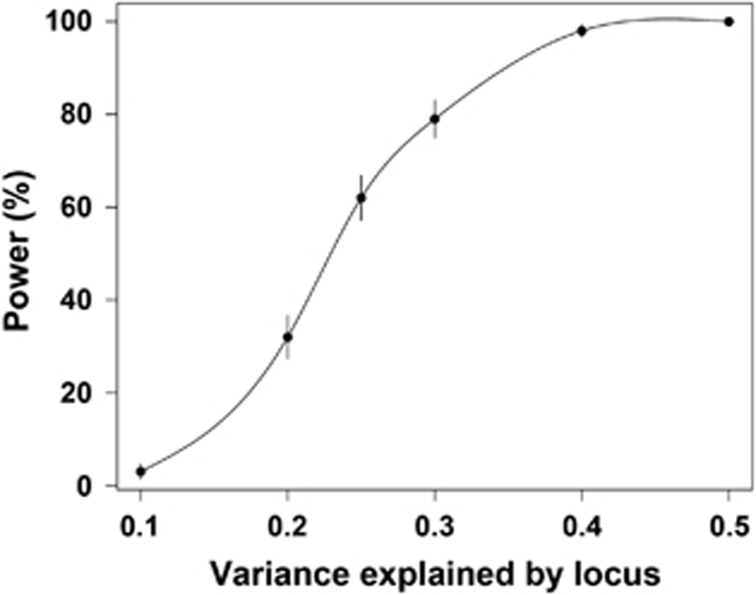
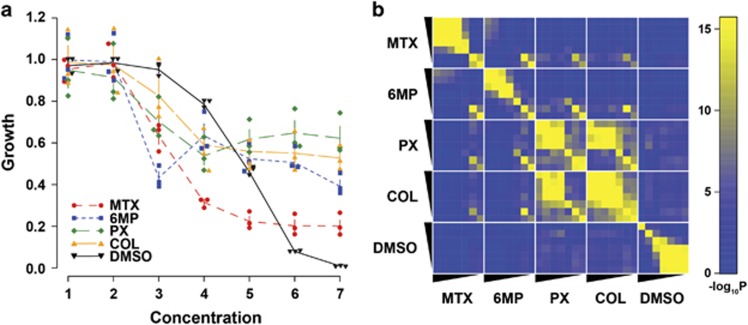
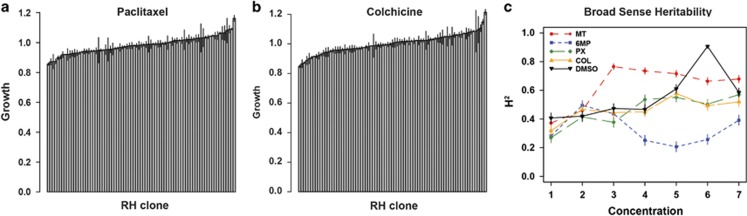
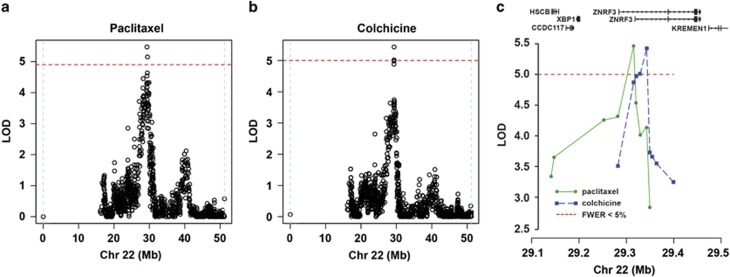
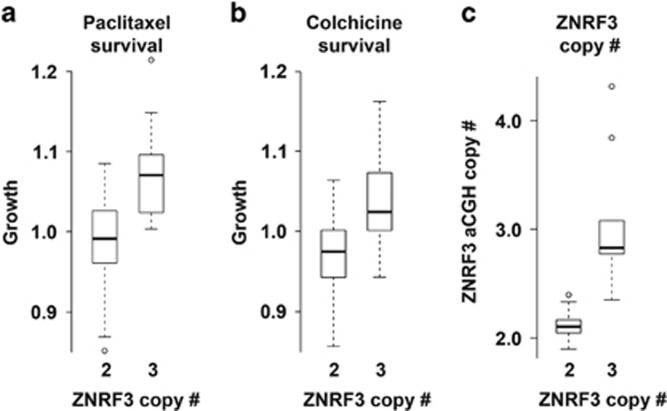
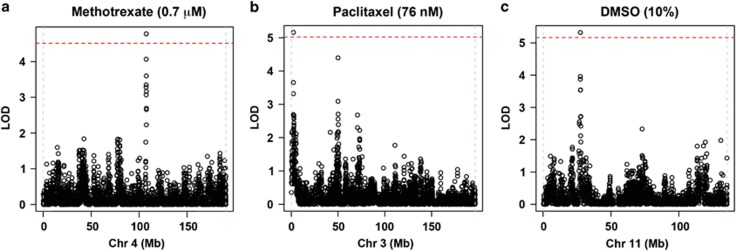
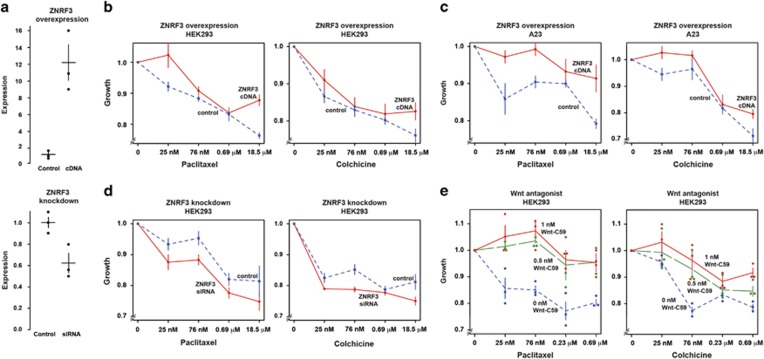
The antitubulin drugs, paclitaxel (PX) and colchicine (COL), inhibit cell growth and are therapeutically valuable. PX stabilizes microtubules, while COL promotes their depolymerization. But, the drug concentrations that alter tubulin polymerization are hundreds of times higher than their clinically useful levels. To map genetic targets for drug action at single-gene resolution, we used a human radiation hybrid panel. We identified loci that affected cell survival in the presence of five compounds of medical relevance. For PX and COL, the zinc and ring finger 3 (ZNRF3) gene dominated the genetic landscape at therapeutic concentrations. ZNRF3 encodes an R-spondin regulated receptor that inhibits Wingless/Int (Wnt) signaling. Overexpression of the ZNRF3 gene shielded cells from antitubulin drug action, while small interfering RNA knockdowns resulted in sensitization. Further a potent pharmacological inhibitor of Wnt signaling, Wnt-C59, protected cells from PX and COL. Our results suggest that the antitubulin drugs perturb microtubule dynamics, thereby influencing Wnt signaling.


Figures

Figure 1
Figure 1
Statistical power; means±s.e.m.
Figure 2
Figure 2
Survival curves and drug correlations. (a) Survival curves for RH23; means±s.e.m. (b) P-values for drug correlations across RH panel on a negative logarithmic scale. The thin ends of the wedges correspond to lowest drug concentrations. 6 MP, 6-mercaptopurine; COL, colchicine; DMSO, dimethyl sulfoxide; MTX, methotrexate; PX, paclitaxel; RH, radiation hybrid.
Figure 3
Figure 3
Growth variations and broad-sense heritabilities. (a) Normalized growth variation among RH clones in paclitaxel, 25 nm; means±s.e.m. (b) Normalized growth variation among RH clones in colchicine, 25 nm; means±s.e.m. (c) Broad-sense heritabilties, H2, at various drug concentrations; means±s.e.m. RH, radiation hybrid.
Figure 4
Figure 4
Chromosome 22 locus for paclitaxel and colchicine. (a) Paclitaxel, 25 nm. (b) Colchicine, 25 nm. (c) Closeup of locus. University of California, Santa Cruz (UCSC) genes at top. Red horizontal lines, FWER <5% threshold. FWER, family-wise error rate.
Figure 5
Figure 5
ZNRF3. (a) Effect of ZNRF3 on cell survival in paclitaxel. Proliferation relative to vehicle-treated control. (b) Effect of ZNRF3 on cell survival in colchicine. (c) ZNRF3 copy number. Comparing classified copy number with array comparative genomic hybridization (aCGH) copy number.
Figure 6
Figure 6
Suggestive QTLs. (a) Paclitaxel, 76 nm. (b) Methotrexate, 0.7 μm. (c) DMSO, 10%. Red horizontal lines, FWER <10% threshold. DMSO, dimethyl sulfoxide; FWER, family-wise error rate; QTL, quantitative trait locus.
Figure 7
Figure 7
Validating ZNRF3 in the action of the antitubulin drugs. (a) Verification of ZNRF3 overexpression and small interfering RNA (siRNA) knockdown in HEK293 cells using quantitative PCR. (b) ZNRF3 overexpression diminishes the effects of the antitubulin drugs in HEK293 cells. (c) ZNRF3 overexpression also decreases the effects of the drugs in A23 cells. (d) Knockdown of ZNRF3 expression with an siRNA sensitizes HEK293 cells to paclitaxel and colchicine. (e) Pharmacological blockade of Wnt signaling with Wnt-C59 protects HEK293 cells from the actions of paclitaxel and colchicine. Growth curves normalized to zero drug concentrations; means±s.e.m.

References

    1. Collins FS, Green ED, Guttmacher AE, Guyer MS, US National Human Genome Research Institute. A vision for the future of genomics research. Nature 2003; 422: 835–847. - PubMed
    1. Fang Y. Ligand-receptor interaction platforms and their applications for drug discovery. Expert Opin Drug Discov 2012; 7: 969–988. - PubMed
    1. Pacholarz KJ, Garlish RA, Taylor RJ, Barran PE. Mass spectrometry based tools to investigate protein-ligand interactions for drug discovery. Chem Soc Rev 2012; 41: 4335–4355. - PubMed
    1. Choy E, Yelensky R, Bonakdar S, Plenge RM, Saxena R, De Jager PL et al. Genetic analysis of human traits in vitro: drug response and gene expression in lymphoblastoid cell lines. PLoS Genet 2008; 4: e1000287. - PMC - PubMed
    1. Duan S, Bleibel WK, Huang RS, Shukla SJ, Wu X, Badner JA et al. Mapping genes that contribute to daunorubicin-induced cytotoxicity. Cancer Res 2007; 67: 5425–5433. - PMC - PubMed

Publication types