. 2016 Mar;30(3):266-79.
doi: 10.1177/1545968315593808. Epub 2015 Jul 6.

Success of Anomia Treatment in Aphasia Is Associated With Preserved Architecture of Global and Left Temporal Lobe Structural Networks

Affiliations

Success of Anomia Treatment in Aphasia Is Associated With Preserved Architecture of Global and Left Temporal Lobe Structural Networks

Leonardo Bonilha et al. Neurorehabil Neural Repair. 2016 Mar.

Abstract

Background and objective: Targeted speech therapy can lead to substantial naming improvement in some subjects with anomia following dominant-hemisphere stroke. We investigated whether treatment-induced improvement in naming is associated with poststroke preservation of structural neural network architecture.

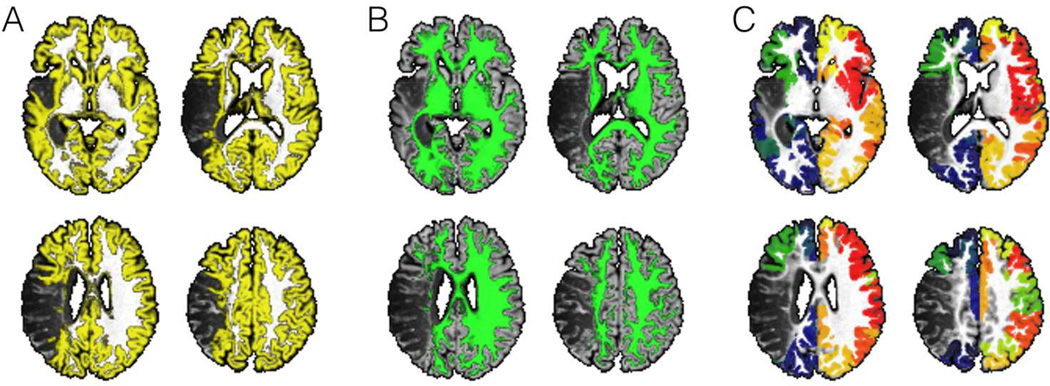
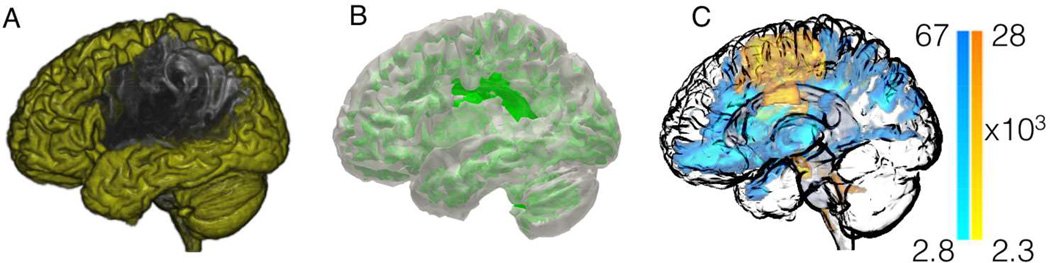
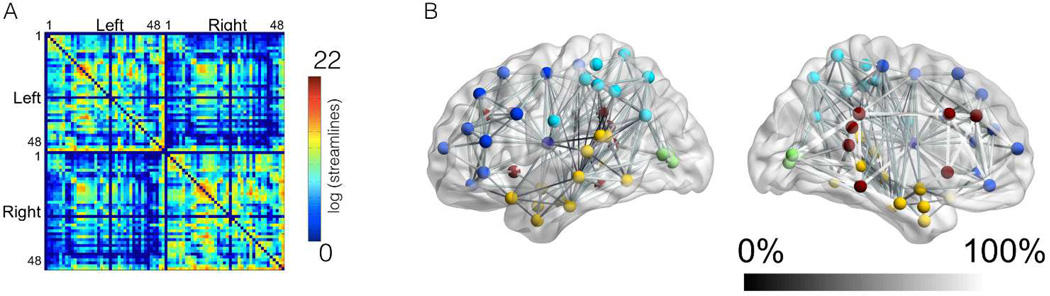
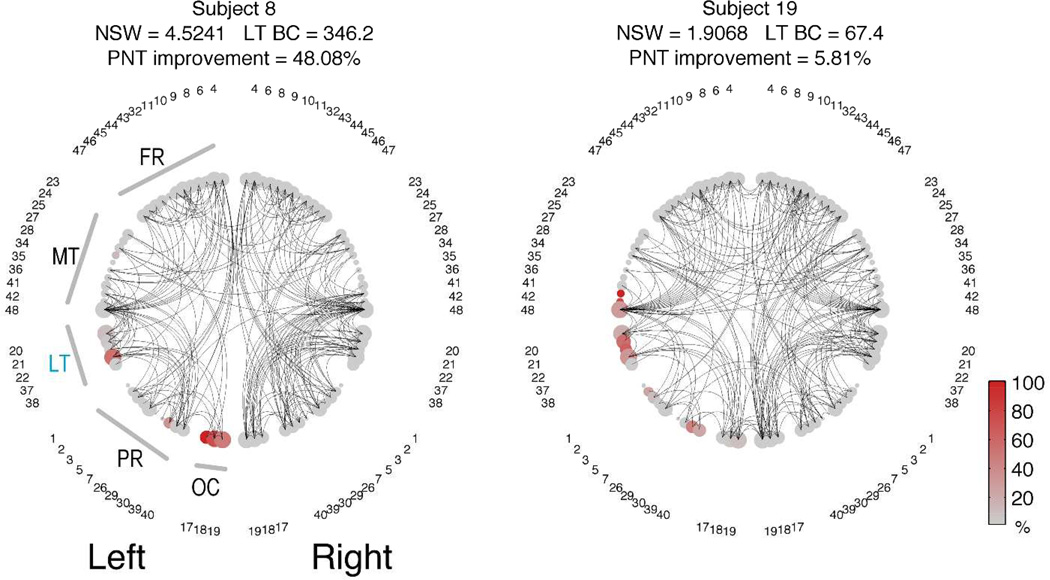
Methods: Twenty-four patients with poststroke chronic aphasia underwent 30 hours of speech therapy over a 2-week period and were assessed at baseline and after therapy. Whole brain maps of neural architecture were constructed from pretreatment diffusion tensor magnetic resonance imaging to derive measures of global brain network architecture (network small-worldness) and regional network influence (nodal betweenness centrality). Their relationship with naming recovery was evaluated with multiple linear regressions.

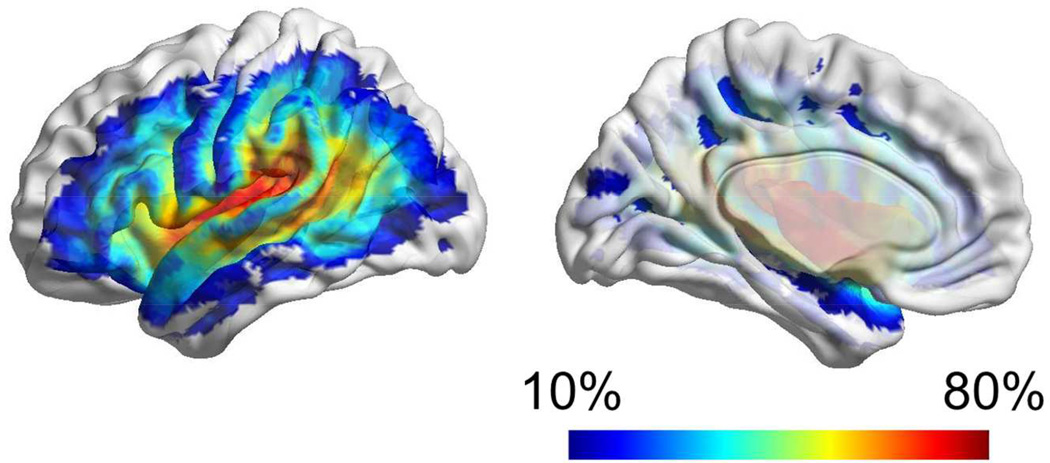
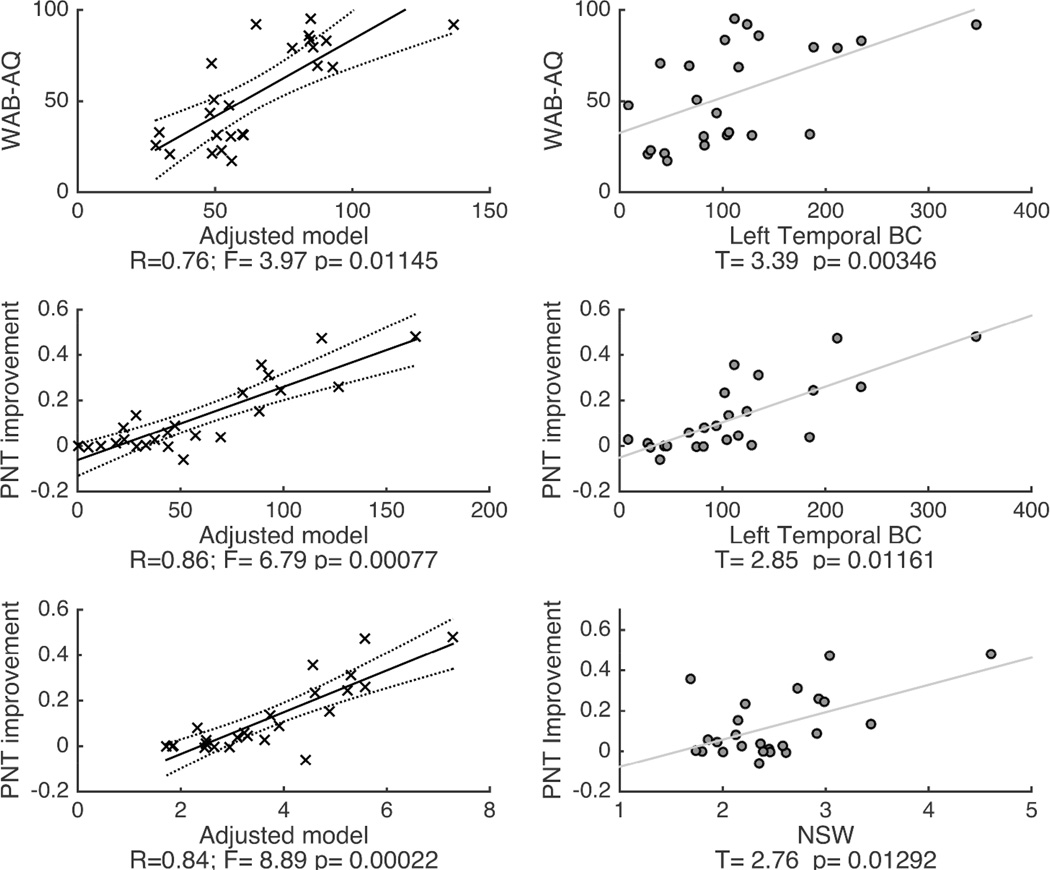
Results: Treatment-induced improvement in correct naming was associated with poststroke preservation of global network small worldness and of betweenness centrality in temporal lobe cortical regions. Together with baseline aphasia severity, these measures explained 78% of the variability in treatment response.

Conclusions: Preservation of global and left temporal structural connectivity broadly explains the variability in treatment-related naming improvement in aphasia. These findings corroborate and expand on previous classical lesion-symptom mapping studies by elucidating some of the mechanisms by which brain damage may relate to treated aphasia recovery. Favorable naming outcomes may result from the intact connections between spared cortical areas that are functionally responsive to treatment.

Keywords: aphasia; diffusion tensor imaging; magnetic resonance imaging; naming; recovery; structural connectome.


Figures

Figure 1
Figure 1
This figure summarizes the initial preprocessing steps employed to evaluate structural connectivity. Images from one representative subject are shown. The T1 weighted images are segmented into probabilistic maps of gray matter (panel A) and white matter (panel B). The probabilistic map of gray matter is then divided into anatomical regions of interest (ROIs) corresponding to Brodmann Areas (BA) (panel C – each color representing a different ROI);.
Figure 2
Figure 2
Following the initial preprocessing steps, special processing is then conducted to exclude the areas involved in the post-stroke necrotic tissue, thus leaving only viable cortex (panel D – areas in yellow) and viable white matter (panel E - areas in green). Using this probabilistic white matter map as a guide, probabilistic white matter DTI streamlines are reconstructed by seeding each ROI at a time, and computing the number of streamlines arriving at the other ROIs. Panel C illustrates the voxel-based counts of probabilistic streamlines generated by seeding BA 6 (pre-motor cortex, with streamlines shown in “warm” color) and 48 (insula, streamlines in “cold” color) in the right hemisphere. The scale bars illustrate the voxel based counts of streamlines.
Figure 3
Figure 3
The anatomical distribution of the necrotic post-stroke brain lesions is demonstrated through a color-coded map (overlaid onto a cortical surface diagram) where each color represents the frequency, across all subjects, with which the corresponding anatomical region was lesioned.
Figure 4
Figure 4
This diagram demonstrates the average connectome in panel A, with axis numbers corresponding to BAs. The scale bar demonstrates the link-wise strength, which corresponds to the log of the number of streamlines connecting the ROIs (corrected based on ROI volume and distance travelled by the streamlines). Panel B demonstrates the link-wise asymmetry in connectivity, illustrating how often links in the left hemisphere were present, in comparison with the homologous right hemisphere links that were present in 100% of subjects. A sphere in its center of mass illustrates the location of each BA ROI; straight lines connecting the nodes demonstrate links; the shade of gray of each link corresponds to its frequency of observation in comparison with the right hemisphere. The colors of the nodes illustrate their anatomical locations (light blue – parietal and inferior frontal; dark blue – frontal; yellow – temporal; dark red – pericingulate regions and insula, green – occipital).
Figure 5
Figure 5
Scatter plots demonstrating the results from the linear regression models in relationship with baseline WAB-AQ (upper panel) and treatment-related improvement in the naming (PNT improvement - middle and lower panels) set as dependent variables. The adjusted models (controlling for age, time since the stroke and lesion size) are shown on the left column, and the association between the independent variables related to global network measures (NSW – normalized small worldness) and regional left temporal network measures (BC – betweenness centrality) are shown on the right column. Supplementary Table 2 provides a comprehensive description of the statistical features of these models.
Figure 6
Figure 6
The network configurations of two representative patients are demonstrated as 2-dimensional circular diagrams, where each anatomical ROI is symbolized by a circle corresponding to the network node (with numbers indicating the BA), and the links between nodes are represented as curved lines. The nodes are organized in accordance with their anatomical distribution, i.e, left ROIs are placed in the left side of the figure and ROIs are grouped based on lobes. The node size is proportional to the size of the anatomical ROI (log2[size of the ROI]). To improve visualization, the network was made sparser by preserving only the links above the 95% link-weight percentile. The color of the node represents the percentage of the ROI that was damaged by the stroke (in accordance with the colorbar). Note the subject 8 has higher LT BC because there are more connections traversing the LT area (i.e., to travel between two other ROIs, the path “bounces of” LT). Legend: FR=frontal regions; MT = medial and inferior temporal regions; LT = lateral temporal regions; PR = parietal regions; OC = occipital regions.

Similar articles

Cited by

References

    1. Donnan GA, Fisher M, Macleod M, Davis SM. Stroke. Lancet. 2008 May 10;371(9624):1612–1623. - PubMed
    1. Wade DT, Hewer RL, David RM, Enderby PM. Aphasia after stroke: natural history and associated deficits. Journal of neurology, neurosurgery, and psychiatry. 1986 Jan;49(1):11–16. - PMC - PubMed
    1. Croquelois A, Bogousslavsky J. Stroke aphasia: 1,500 consecutive cases. Cerebrovascular diseases. 2011;31(4):392–399. - PubMed
    1. Hilari K, Byng S. Health-related quality of life in people with severe aphasia. International journal of language & communication disorders / Royal College of Speech & Language Therapists. 2009 Mar-Apr;44(2):193–205. - PubMed
    1. Kohn SE, Goodglass H. Picture-naming in aphasia. Brain and language. 1985 Mar;24(2):266–283. - PubMed

Publication types