

Pom1 gradient buffering through intermolecular auto-phosphorylation
- PMID: 26150232
- PMCID: PMC4547846
- DOI: 10.15252/msb.20145996
Pom1 gradient buffering through intermolecular auto-phosphorylation
Abstract
Concentration gradients provide spatial information for tissue patterning and cell organization, and their robustness under natural fluctuations is an evolutionary advantage. In rod-shaped Schizosaccharomyces pombe cells, the DYRK-family kinase Pom1 gradients control cell division timing and placement. Upon dephosphorylation by a Tea4-phosphatase complex, Pom1 associates with the plasma membrane at cell poles, where it diffuses and detaches upon auto-phosphorylation. Here, we demonstrate that Pom1 auto-phosphorylates intermolecularly, both in vitro and in vivo, which confers robustness to the gradient. Quantitative imaging reveals this robustness through two system's properties: The Pom1 gradient amplitude is inversely correlated with its decay length and is buffered against fluctuations in Tea4 levels. A theoretical model of Pom1 gradient formation through intermolecular auto-phosphorylation predicts both properties qualitatively and quantitatively. This provides a telling example where gradient robustness through super-linear decay, a principle hypothesized a decade ago, is achieved through autocatalysis. Concentration-dependent autocatalysis may be a widely used simple feedback to buffer biological activities.
Keywords: auto‐catalysis; cell cycle control; fission yeast Schizosaccharomyces pombe; gradient formation; robustness.
© 2015 The Authors. Published under the terms of the CC BY 4.0 license.
Figures
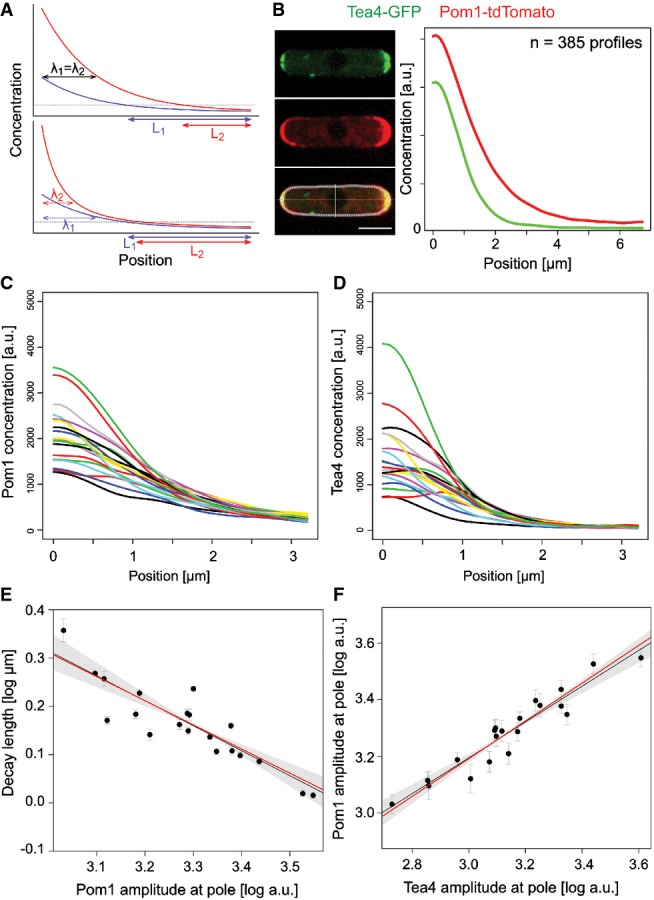
The standard diffusive gradient (top) is exponential, and its decay length λ (the distance at which the concentration is reduced to some fraction of its amplitude) is independent from the amplitude. Variations in amplitudes are therefore not buffered and translate into large variations in positional information L. By contrast, a gradient that reduces its decay length at high amplitudes (bottom) buffers variations in amplitude and conveys more robust positional information (L1 ≈ L2).
Pom1-tdTomato (red) and Tea4-GFP (green) profiles were quantified along the cortex of the same Schizosaccharomyces pombe cells. Curves are averages from 385 individual profiles.
Smoothed Pom1 gradients averaged in batches of 5% (n = 19 or 20) from lowest to highest Tea4 amplitude. Amplitudes at the pole show a high variability.
Corresponding smoothed and averaged Tea4 profiles. The variability at the pole is even higher than for Pom1.
Pom1 gradient decay length decreases with the amplitude at the pole. Each dot corresponds to one average profile as in (C). The trans-phosphorylation model predicts a slope of −1/2 in log–log space (red line), close to the observed linear regression of −0.52 (black line) and well within the two SE confidence interval (shaded area). Each data point is weighted by its inverse variance of the mean in the linear regression.
Pom1 amplitude increases with Tea4 concentration at the pole. Linear regression (black line) in the log–log scale shows a slope smaller than one indicative of a sub-linear relationship between Pom1 and Tea4 at the pole (see also Fig2B) and thus buffering of Tea4 fluctuations. Each dot corresponds to one average Tea4 and corresponding Pom1 profiles as in (C, D). The trans-phosphorylation model predicts the slope to be 2/3 (red line), close to the observed 0.63 (black line), and within the two SE confidence interval (shaded area). Each data point is weighted by its inverse variance of the mean in the linear regression.
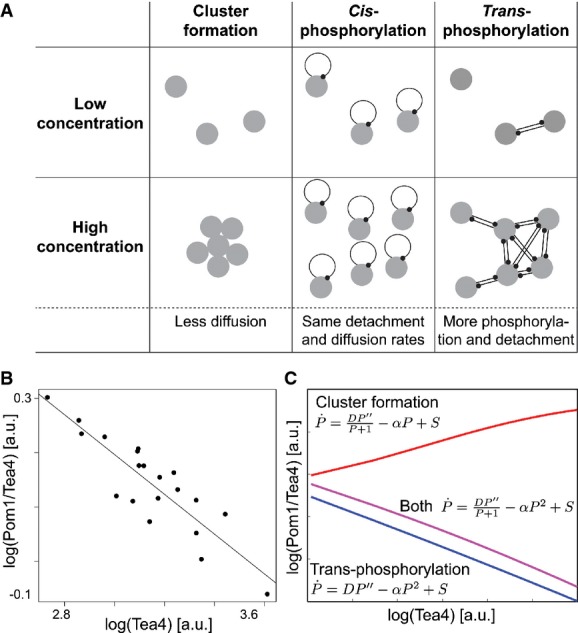
Possible hypotheses for a buffering mechanism. In the cluster-based model, high local concentration leads to the formation of slow-diffusing clusters, thus reducing the decay length at cell poles with high amplitude (Saunders et al, 2012). A cis-phosphorylation model provides no buffering. By contrast, in a trans-phosphorylation model, phosphorylation (and thus detachment) increases with local Pom1 concentration, providing a buffering mechanism reducing decay length at cell poles with high amplitude.
Inverse correlation between Pom1/Tea4 and Tea4 observed experimentally following from the sub-linear relationship between Pom1 and Tea4 (see Fig1F, same data). Line shows linear regression (P-value < 10−7).
Relationship between Pom1/Tea4 and Tea4 predicted by the simple cluster-based and trans-phosphorylation models. The simple cluster-based model simply reflects the hypothesis that diffusion decreases with Pom1 concentration P. It illustrates that this hypothesis cannot alone explain the decreasing relationship between Pom1/Tea4 and Tea4 (red line). By contrast, this relationship is well accounted for qualitatively and quantitatively by the trans-phosphorylation model (blue line; see also 1F). Combining both Pom1 clustering and trans-phosphorylation can also account for the decreasing relationship between Pom1/Tea4 and Tea4 (purple line).
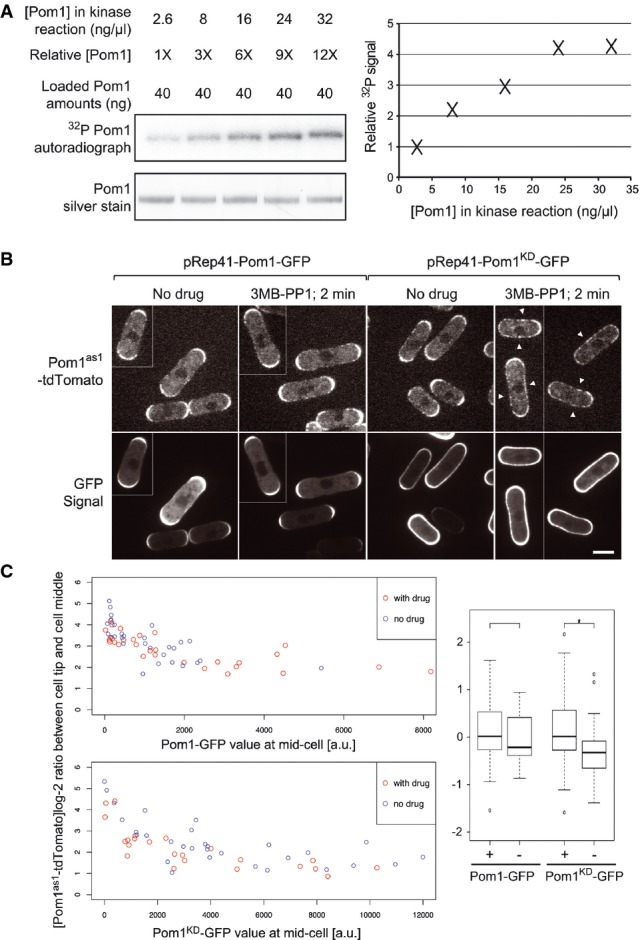
Pom1 in vitro kinase assays with [ϒ-32P] ATP at five distinct Pom1 concentrations, ranging from 2.6 to 32 ng/μl (1× to 12×). Loading of equivalent Pom1 amounts (40 ng; see silver staining control) reveals higher incorporation of 32P upon higher Pom1 concentration, indicating an intermolecular reaction. Quantification is shown on the graph.
Pom1as1-tdTomato in cells co-expressing Pom1-GFP (left) or Pom1KD-GFP (right) before and 1–2 min after the addition of 3MB-PP1, as indicated. Before drug addition, Pom1 is strongly enriched at cell poles. After drug addition, Pom1as1-tdTomato is rapidly delocalized around the entire cell periphery (arrowheads) in cells co-expressing inactive Pom1KD-GFP, but not in cells co-expressing active Pom1-GFP, suggesting intermolecular phosphorylation (Hachet et al, 2011). Medial confocal planes are shown. Scale bar is 5 μm.
Quantification of data shown in panel B for a larger number of cells. The graphs on the left show the log-2 ratio of Pom1as1-tdTomato fluorescence levels at cell tip and cell middle relative to the medial Pom1-GFP (top) or Pom1KD-GFP (bottom) signal. Note that the Pom1as1-tdTomato tip/middle log-2 ratios are lowered by 3MB-PP1 addition (red dots) relative to the non-treated samples (blue dots) in the cells co-expressing Pom1KD-GFP, but not in the cells co-expressing Pom1-GFP. A boxplot (right) of the residuals after correction of the effect of the GFP signal illustrates the significant effect of the drug treatment on Pom1as1-tdTomato localization in cells co-expressing Pom1KD-GFP (*n = 30 + 23, one-sided t-test, P-value =0.012) but not in cells expressing Pom1-GFP (n = 30 + 30, two-sided t-test, P-value = 0.39). + and − indicate the presence or absence of 3MB-PP1.
References
-
- Alvarez-Tabares I, Grallert A, Ortiz JM, Hagan IM. Schizosaccharomyces pombe protein phosphatase 1 in mitosis, endocytosis and a partnership with Wsh3/Tea4 to control polarised growth. J Cell Sci. 2007;120:3589–3601. - PubMed
-
- Bhatia P, Hachet O, Hersch M, Rincon SA, Berthelot-Grosjean M, Dalessi S, Basterra L, Bergmann S, Paoletti A, Martin SG. Distinct levels in Pom1 gradients limit Cdr2 activity and localization to time and position division. Cell Cycle. 2013;13:538–552. - PubMed
Publication types
MeSH terms
Substances
LinkOut - more resources
Full Text Sources
Other Literature Sources
Molecular Biology Databases
