. 2015 Jul 6;210(1):79-97.
doi: 10.1083/jcb.201503117.

Interphase centrosome organization by the PLP-Cnn scaffold is required for centrosome function

Affiliations

Interphase centrosome organization by the PLP-Cnn scaffold is required for centrosome function

Dorothy A Lerit et al. J Cell Biol. .

Abstract

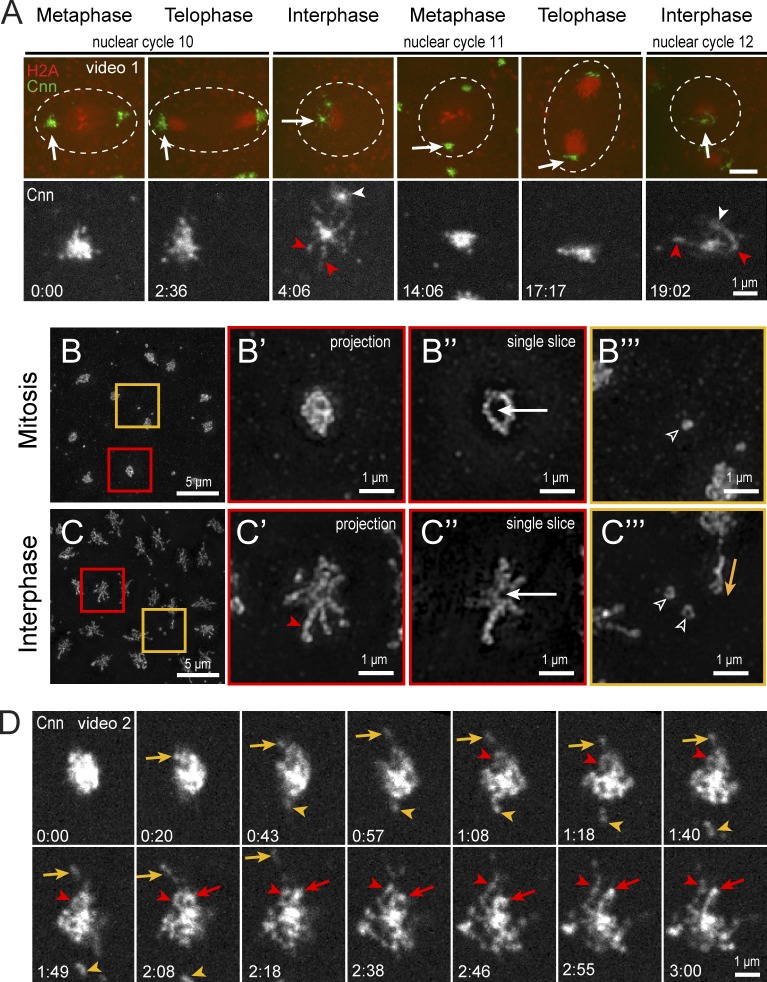
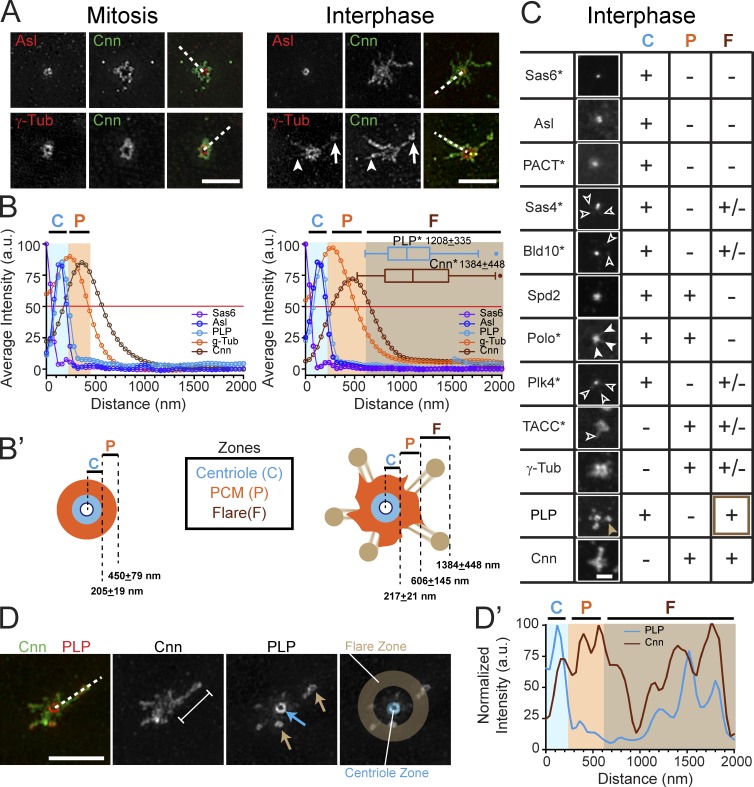
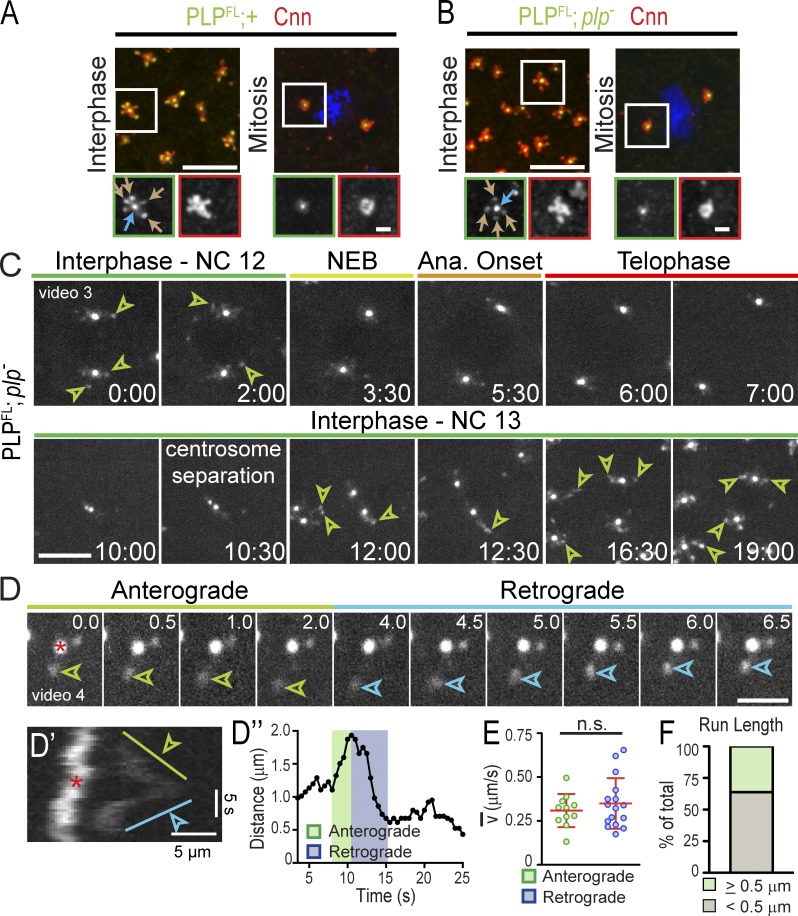
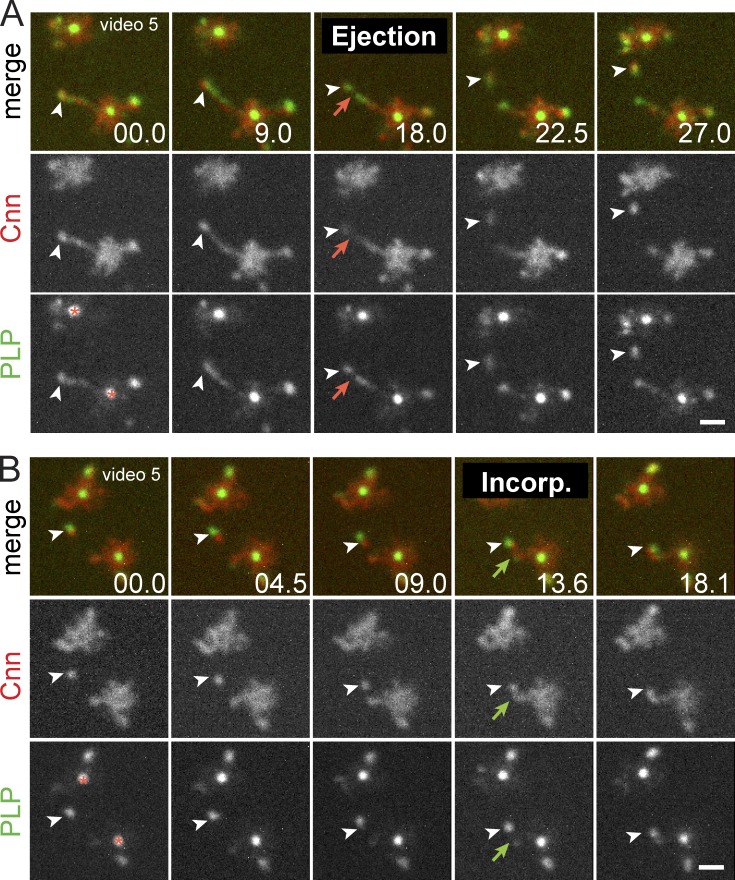
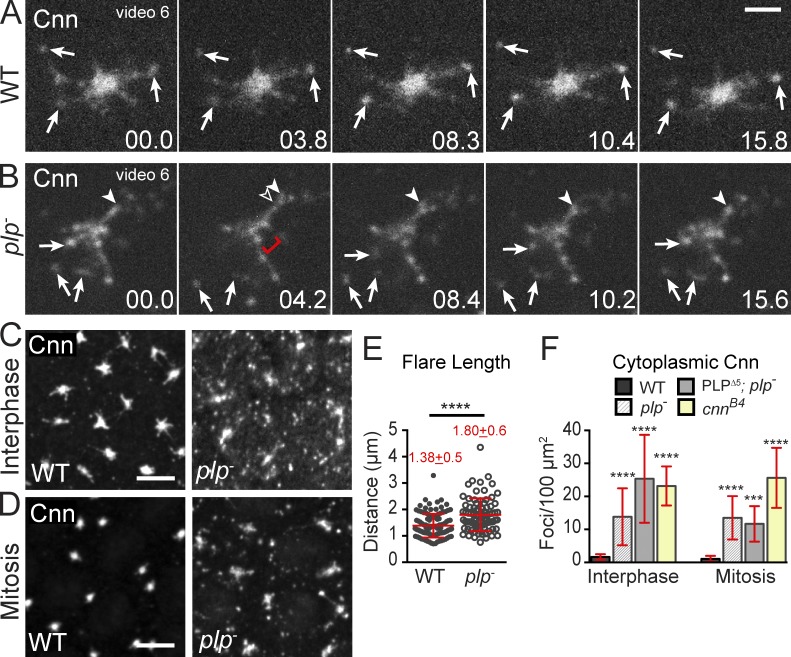
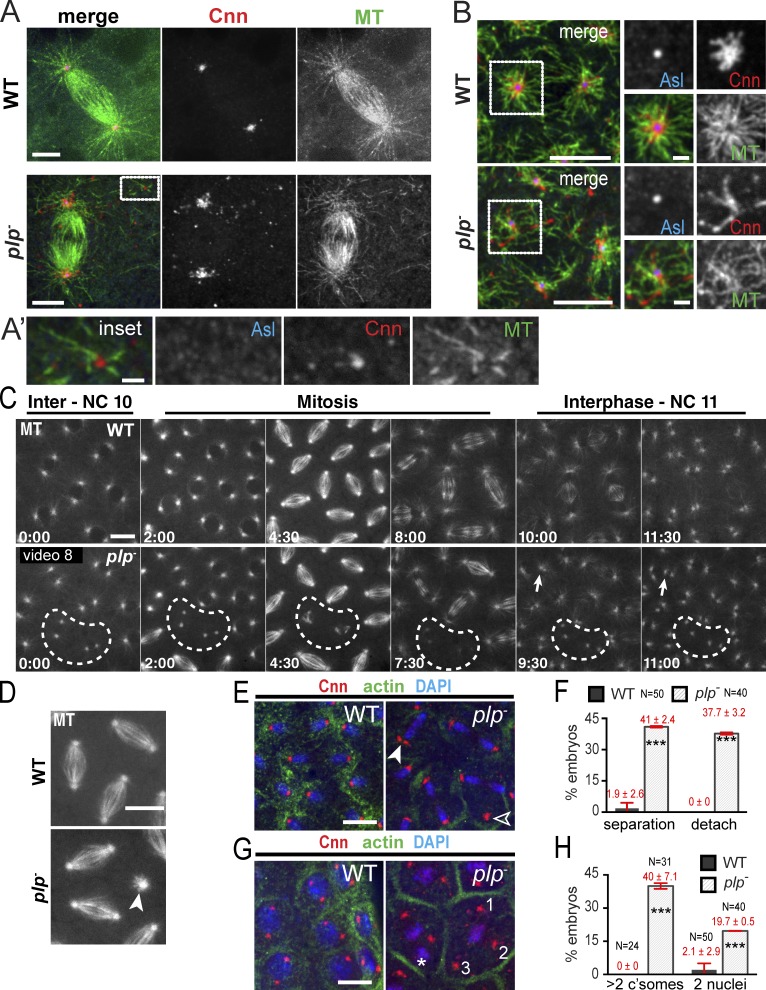
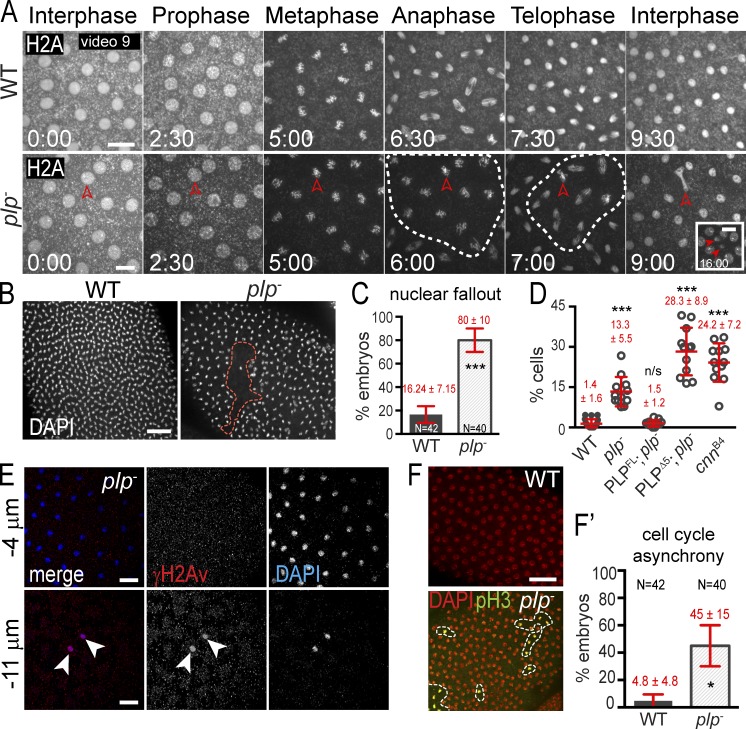
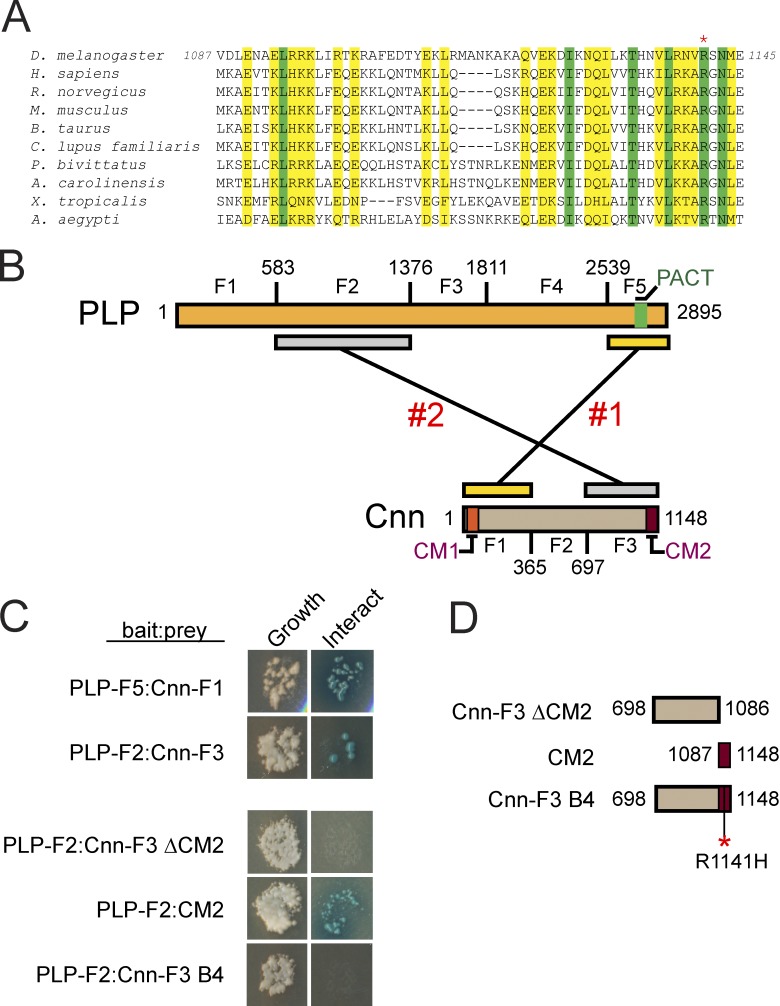
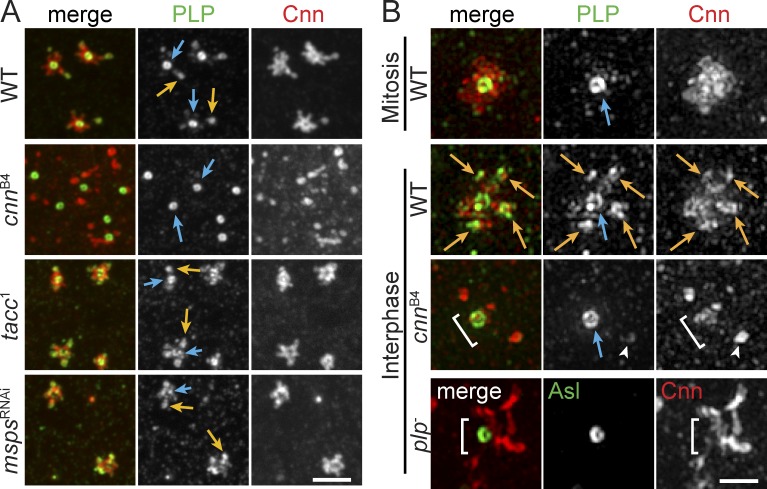
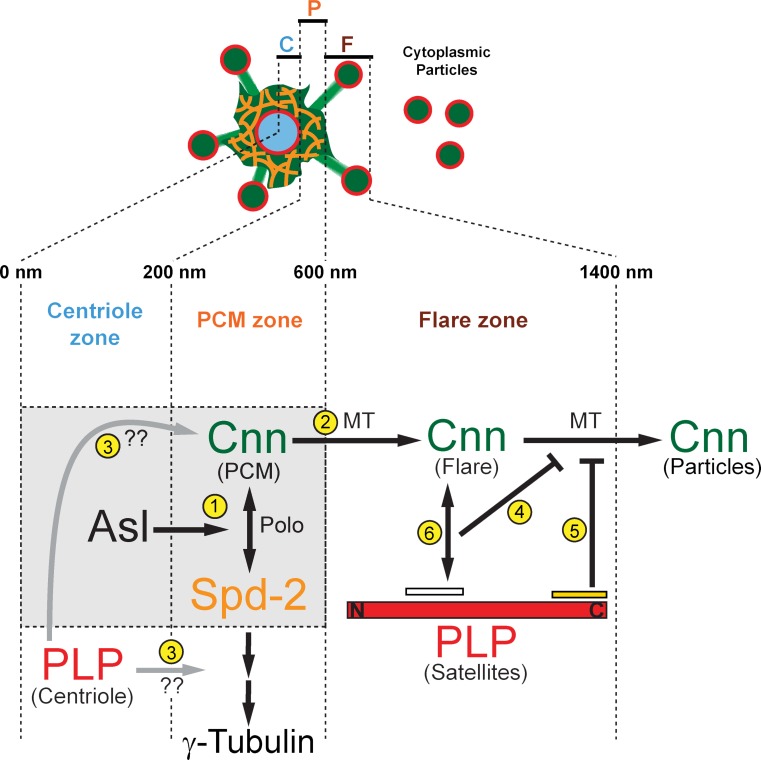
Pericentriolar material (PCM) mediates the microtubule (MT) nucleation and anchoring activity of centrosomes. A scaffold organized by Centrosomin (Cnn) serves to ensure proper PCM architecture and functional changes in centrosome activity with each cell cycle. Here, we investigate the mechanisms that spatially restrict and temporally coordinate centrosome scaffold formation. Focusing on the mitotic-to-interphase transition in Drosophila melanogaster embryos, we show that the elaboration of the interphase Cnn scaffold defines a major structural rearrangement of the centrosome. We identify an unprecedented role for Pericentrin-like protein (PLP), which localizes to the tips of extended Cnn flares, to maintain robust interphase centrosome activity and promote the formation of interphase MT asters required for normal nuclear spacing, centrosome segregation, and compartmentalization of the syncytial embryo. Our data reveal that Cnn and PLP directly interact at two defined sites to coordinate the cell cycle-dependent rearrangement and scaffolding activity of the centrosome to permit normal centrosome organization, cell division, and embryonic viability.


Figures

Figure 1.
Figure 1.
Rearrangement of Cnn at the mitotic-to-interphase transition. (A) Live Cnn-GFP and H2A-RFP in a pseudo-cell (broken line) of a WT embryo through three cell cycles. Arrows show the enlarged regions below (Cnn, white). Cnn flares (red arrowheads) and separating daughter centrosomes (white arrowheads) in interphase are indicated. Bars in top panels, 5 µm. (B and C) SIM images of mitotic (B) and interphase (C) embryos stained for Cnn. Centrosomes (red boxes) are magnified to the right as projections (B′ and C′) and single optical sections (B″ and C″) through the centrosome center. Interphase flare (red arrowhead) and centriole position (white arrows) are shown. (B‴ and C‴) Cytoplasmic regions (orange boxes) show particles (open arrowheads) and a particle release event (orange arrow). (D) Live Cnn-GFP at mitotic exit. Released particles (orange) and unfolding flares (red) are shown. Time is given in minutes:seconds.
Figure 2.
Figure 2.
Reorganization of the centrosome structure in interphase. (A) SIM images of WT embryos stained for the indicated proteins. The presence (arrows) and absence (arrowheads) of γTub within Cnn flares is shown. (B) Mean radial intensity distribution of centrosome proteins in mitosis (left) and interphase (right) calculated from line scans derived from n = 30–110 centrosomes (broken lines in A). Shaded areas show the centriole (C, blue), PCM (P, orange), and flare (F, brown) zones as defined by the outer edges (OE) of Asl, γTub, and Cnn, respectively (see Materials and methods). The asterisk denotes satellite or flare measurement. (B′) Diagram of centrosome zones at mitosis (left) and interphase (right). (C) Confocal projections of the indicated proteins assayed for localization to the C, P, and F zones; +, present; −, absent; and +/−, low or variable levels; *, protein detected by GFP transgene. See Fig. S1 C for contrast-enhanced versions of Sas4, Bld10, Plk4, Polo, and Spd2. Open arrowheads show low localization of protein to the flare zone; closed arrowheads show Polo extending into the PCM zone. The brown arrowhead highlights the strong localization of PLP to the flare zone. (D) SIM image of a WT interphase centrosome with a Cnn flare (bracket); arrows show PLP at the centriole (blue) and satellites (brown). Line scan (broken line, D′) shows representative distribution relative to the centriole center. Bars: (A and D) 2.5 µm; (C) 1 µm.
Figure 3.
Figure 3.
PLPFL localizes to dynamic satellite structures. (A and B) Embryos were stained for the indicated proteins. Arrows show PLP at centrioles (blue) and satellites (brown). The boxed sections are enlarged below. (C) Live PLPFL shows interphase PLP satellites (arrowheads) in NC 12 and 13. Time is given in minutes:seconds. (D) Anterograde (green) and retrograde (blue) satellite run relative to centriole (asterisk). Time is given in seconds. (D′) Corresponding kymograph and plot of distance over time (D″). (E) Average velocity of directed runs; n.s., not significant; n = 27 runs. (F) Frequency of satellites with directed (≥0.5 µm) runs; n = 58 centrosomes. Bars: (A and B, top) 5 µm; (A and B, bottom) 1 µm; (C) 5 µm; (D) 2 µm.
Figure 4.
Figure 4.
Cnn and PLP are packaged together into dynamic flares. (A) Live PLPFL and Cnn-mCherry at two centrosome pairs within a single embryo show coincidence (arrowheads) at the tip of an extended flare. Red arrows show particle release. (B) Particle associates with existing PCM (green arrows). The asterisks mark the centriole. Time is given in seconds. Bars, 1 µm.
Figure 5.
Figure 5.
PLP organizes the Cnn scaffold. (A and B) Live Cnn-mCherry in WT (A) and plp (B) embryos in interphase. Released particles (arrows), extending flare (arrowheads), and disrupted PCM (bracket) are shown. Time is given in seconds. (C and D) Embryos stained for Cnn. (E) Cnn flare length in interphase embryos; n > 80 centrosomes. Mean ± SD is indicated. (F) Cytoplasmic Cnn particles in a 100-µm2 area (interphase embryos: WT n = 87, plp n = 18, PLPΔ5 n = 24, cnnB4 n = 21; mitotic embryos: WT n = 40, plp n = 18, PLPΔ5 n = 9, cnnB4 n = 15). Data are mean ± SD (error bars). ***, P < 0.001; ****, P < 0.0001 by a Student’s two-tailed t test relative to WT. Data shown are from a single representative experiment out of two or more repeats. Bars: (A and B) 2.5 µm; (C and D) 5 µm.
Figure 6.
Figure 6.
PLP is required for MT organization. (A and B) WT and plp mitotic (A) and interphase (B) embryos stained for the indicated proteins. (A’) Acentriolar Cnn particle (inset) organizes MTs. Boxes in B show radial MT array, enlarged in the insets on the right. (C and D) Live GFP-MT in embryos. Broken circles show MTOC inactivation. Arrows show nuclear collisions and the arrowhead shows an orthogonal spindle. (E) Centrosome separation (closed arrowhead) and detachment (open arrowhead) defects are quantified in F. (G) Centrosome and nucleus positioning defects with two nuclei (asterisk) and more than two centrosomes (numerals) per pseudo-cell are quantified in H and F, and show mean ± SD (error bars). ***, P < 0.0001. Data shown are from a single representative experiment out of two repeats. Bars: (A and B, main panels) 5 µm; (A′ and B, right) 1 µm; (C–G) 10 µm.
Figure 7.
Figure 7.
PLP maintains genome stability. (A) Live H2A-RFP in embryos. Broken circles show mitotic asynchrony. Arrowheads show lagging chromosomes (9:00) followed by NUF (16:00). (B) NUF (broken circle) detected by DAPI. (C and D) The frequency (C) and amount (D) of NUF is quantified. (E) γH2Av (red) labels nuclei (DAPI, blue) ejected from the cortex. Arrowheads show nuclei that have undergone nuclear fallout and stain positive for γ-H2A.The negative sign indicates distance below the embryo surface. (F) Embryos stained with DAPI (red; all nuclei) and pH3 (green; mitotic nuclei) to detect mitotic asynchrony. Results are quantified in F′. Data are mean ± SEM (error bars) for C, all other data are mean ± SD. Time is given in minutes:seconds. *, P < 0.01; ***, P < 0.0001; n.s., not significant. Data shown are from a single representative experiment out of two or more repeats. Bars: (A) 10 µm; (B, E, and F) 20 µm.
Figure 8.
Figure 8.
Identification of two sites of direct interaction between Cnn and PLP. (A) ClustalW multiple sequence alignment of the Cnn CM2 motif; similar (yellow) and identical (green) residues are shown. The asterisk shows an invariant arginine mutated in cnnB4 mutants. (B) Graphic showing PLP and Cnn truncations used in Y2H. Two distinct interaction sites are shown. (C) Y2H assays for growth (left) and interaction (right; Materials and methods). (D) Graphic showing truncations of Cnn-F3 used for interaction refinement. The asterisk shows the R1141H mutation that mimics the cnnB4 mutation.
Figure 9.
Figure 9.
Localization of PLP to satellites requires Cnn CM2. Embryos were stained for the indicated proteins and imaged by confocal microscopy (A) or SIM (B). PLP satellites (orange arrows) are present in all genotypes but cnnB4 mutants, which resemble mitotic centrosomes. The PLP centriole pool is present in all genotypes (blue arrows). plp and cnnB4 mutants do not properly assemble PCM around the centriole (brackets). Arrowheads show a cytoplasmic particle or rare PLP satellite in cnnB4 mutant. Bars: (A) 2.5 µm; (B) 1 µm.
Figure 10.
Figure 10.
Model of PLP-Cnn coregulation at interphase centrosomes. Diagram depicting centrosome scaffold formation during interphase. Our data support an interphase-specific Cnn scaffold in the interphase flare zone that is organized by PLP satellites. See text for details.

References

    1. Archambault V., D’Avino P.P., Deery M.J., Lilley K.S., and Glover D.M.. 2008. Sequestration of Polo kinase to microtubules by phosphopriming-independent binding to Map205 is relieved by phosphorylation at a CDK site in mitosis. Genes Dev. 22:2707–2720. 10.1101/gad.486808 - DOI - PMC - PubMed
    1. Balczon R., Bao L., and Zimmer W.E.. 1994. PCM-1, A 228-kD centrosome autoantigen with a distinct cell cycle distribution. J. Cell Biol. 124:783–793. 10.1083/jcb.124.5.783 - DOI - PMC - PubMed
    1. Basto R., Brunk K., Vinadogrova T., Peel N., Franz A., Khodjakov A., and Raff J.W.. 2008. Centrosome amplification can initiate tumorigenesis in flies. Cell. 133:1032–1042. 10.1016/j.cell.2008.05.039 - DOI - PMC - PubMed
    1. Bond J., Roberts E., Springell K., Lizarraga S.B., Scott S., Higgins J., Hampshire D.J., Morrison E.E., Leal G.F., Silva E.O., et al. . 2005. A centrosomal mechanism involving CDK5RAP2 and CENPJ controls brain size. Nat. Genet. 37:353–355. (published erratum appears in Nat. Genet. 2005. 37:555) 10.1038/ng1539 - DOI - PubMed
    1. Brownlee C.W., Klebba J.E., Buster D.W., and Rogers G.C.. 2011. The protein phosphatase 2A regulatory subunit twins stabilizes Plk4 to induce centriole amplification. J. Cell Biol. 195:231–243. 10.1083/jcb.201107086 - DOI - PMC - PubMed

Publication types

LinkOut - more resources