. 2015 Jul 6;210(1):153-68.
doi: 10.1083/jcb.201503019.

Schwann cell autophagy, myelinophagy, initiates myelin clearance from injured nerves

Affiliations

Schwann cell autophagy, myelinophagy, initiates myelin clearance from injured nerves

Jose A Gomez-Sanchez et al. J Cell Biol. .

Abstract

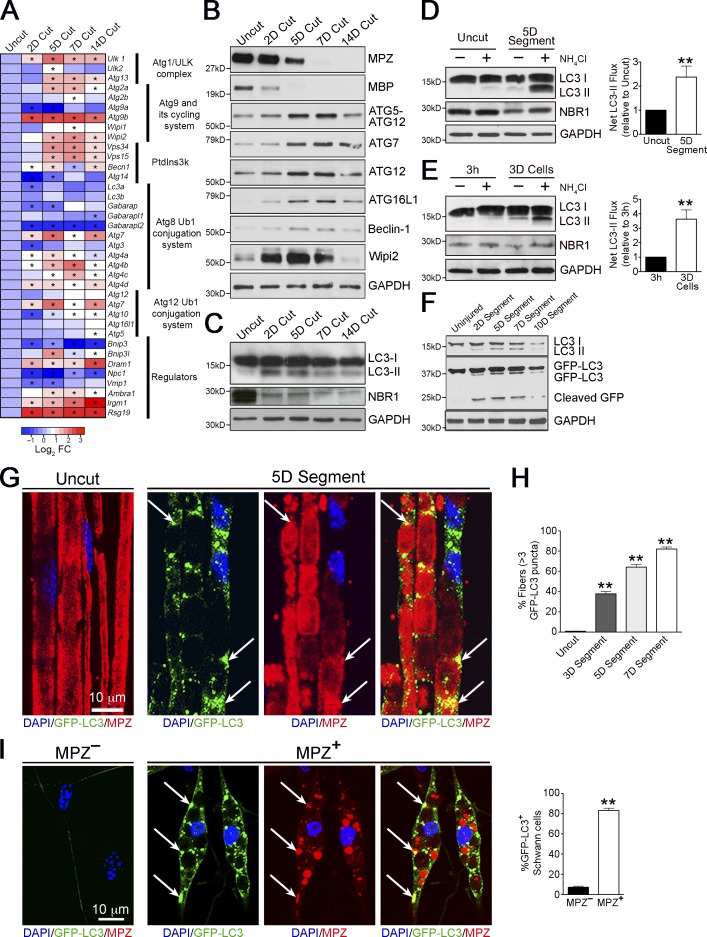
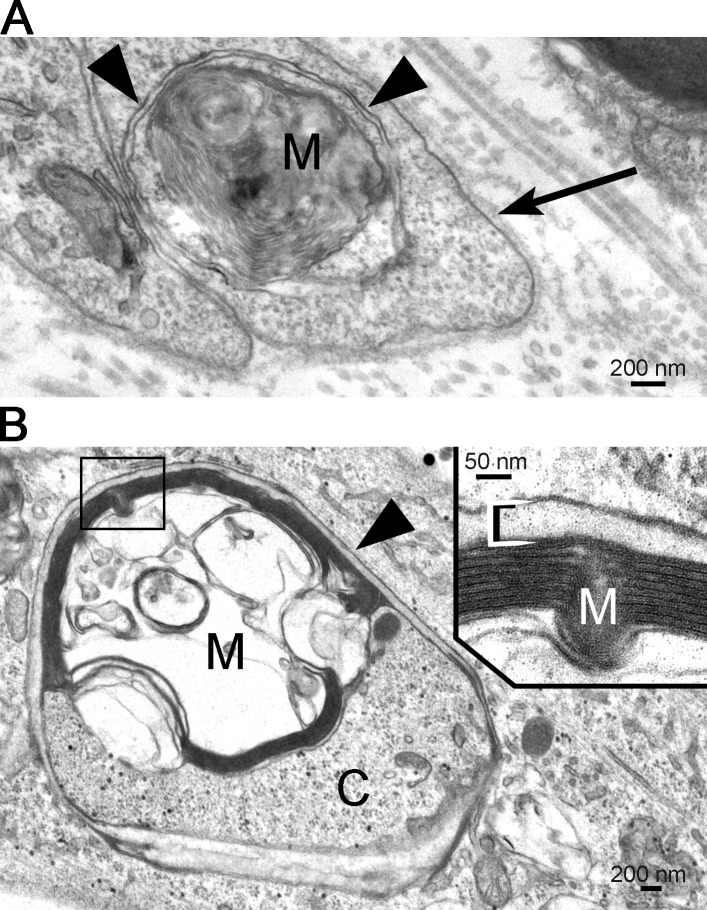
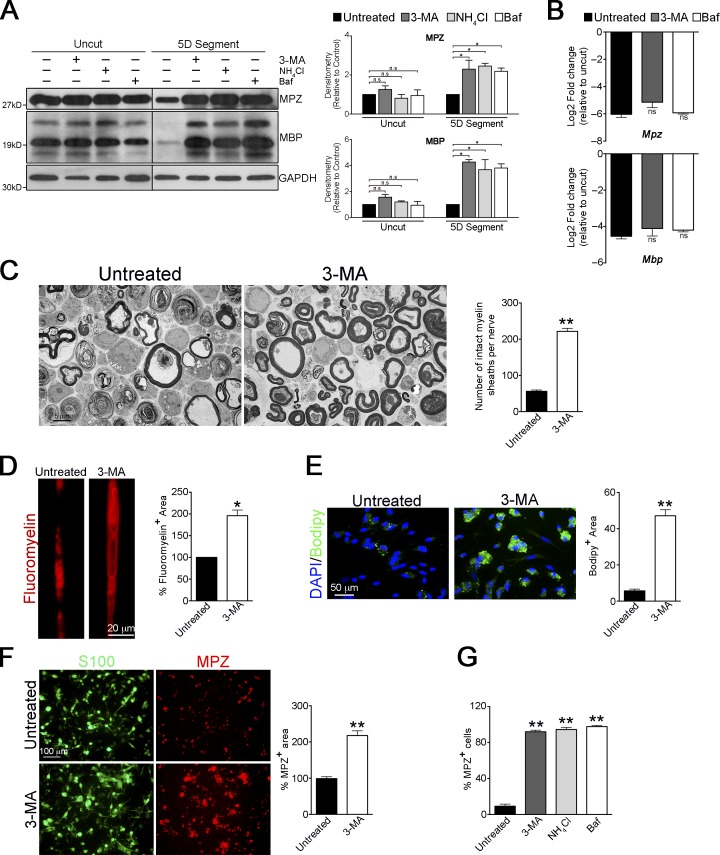
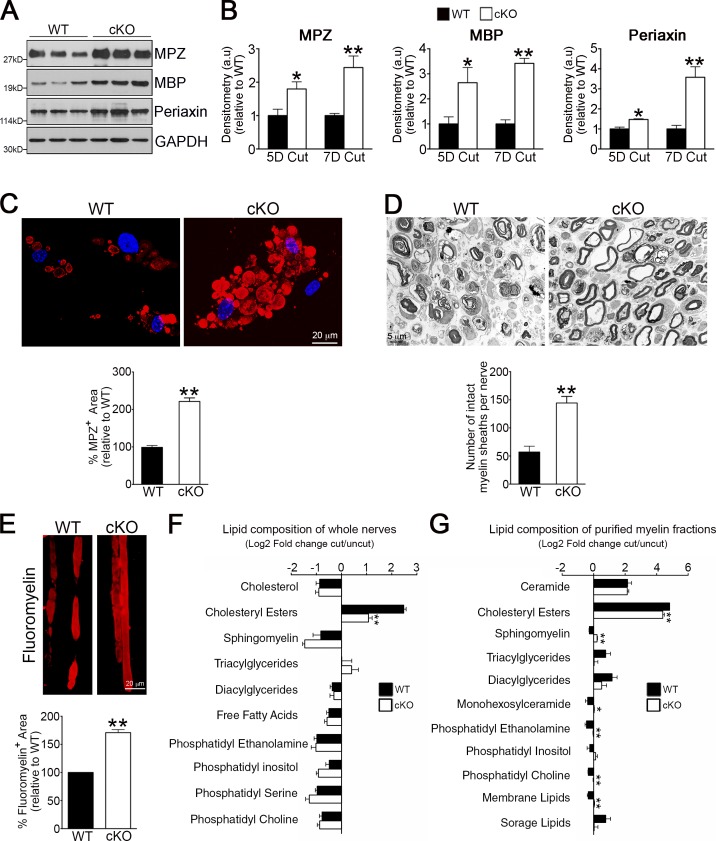
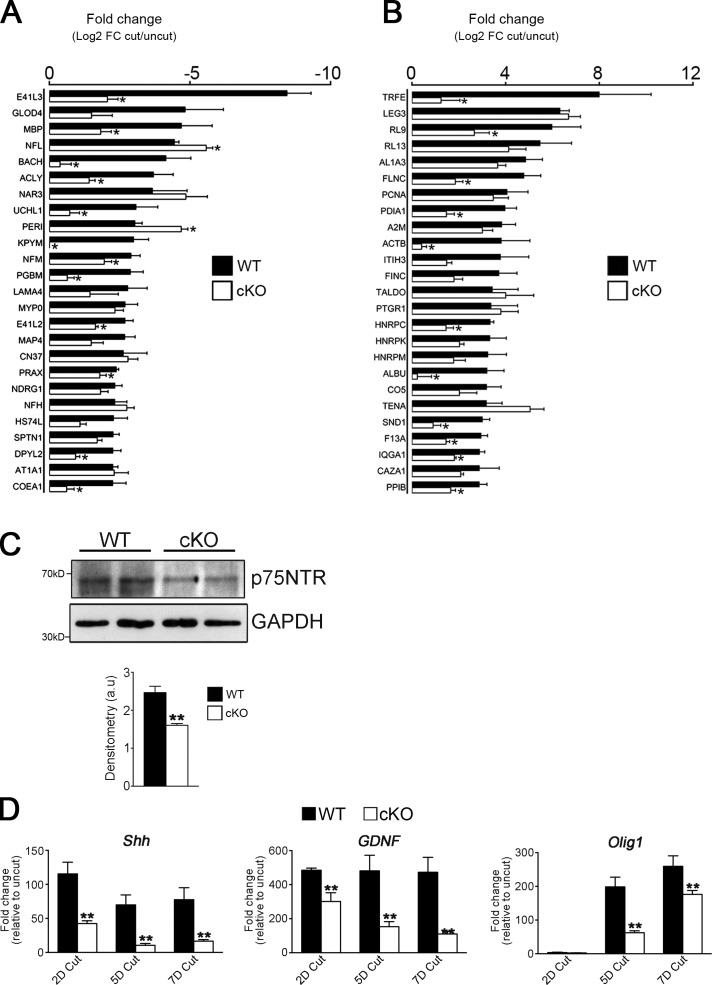
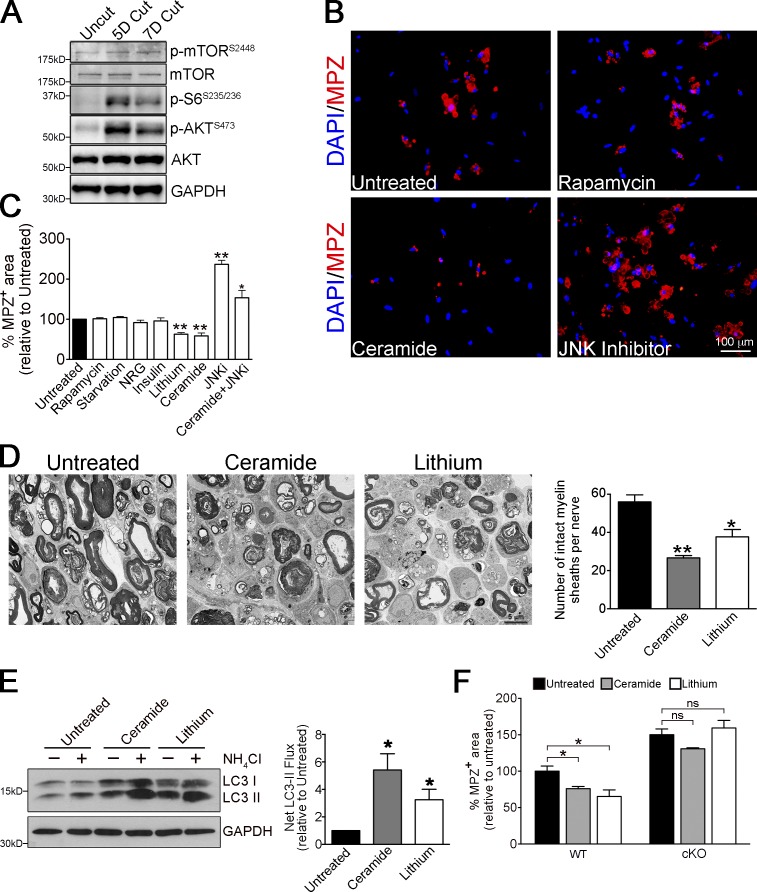
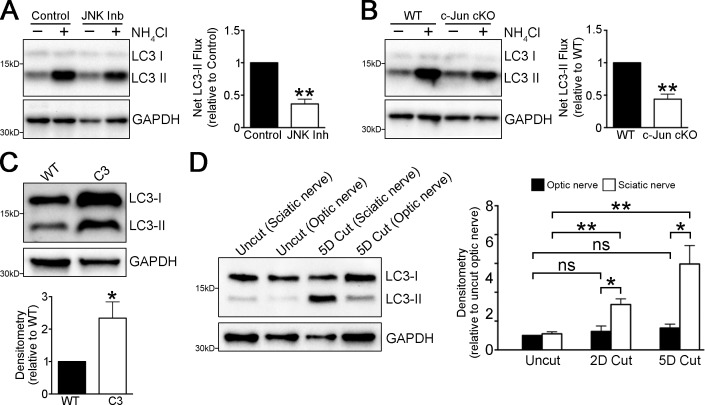
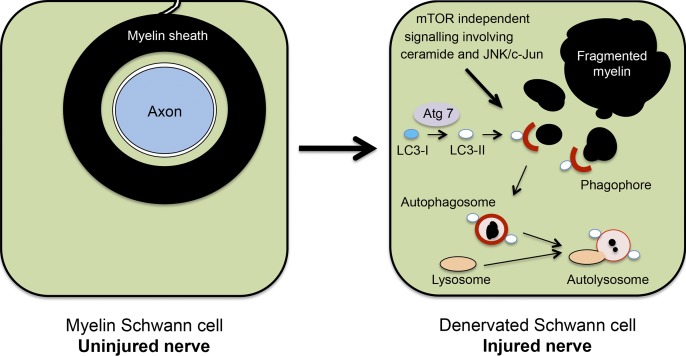
Although Schwann cell myelin breakdown is the universal outcome of a remarkably wide range of conditions that cause disease or injury to peripheral nerves, the cellular and molecular mechanisms that make Schwann cell-mediated myelin digestion possible have not been established. We report that Schwann cells degrade myelin after injury by a novel form of selective autophagy, myelinophagy. Autophagy was up-regulated by myelinating Schwann cells after nerve injury, myelin debris was present in autophagosomes, and pharmacological and genetic inhibition of autophagy impaired myelin clearance. Myelinophagy was positively regulated by the Schwann cell JNK/c-Jun pathway, a central regulator of the Schwann cell reprogramming induced by nerve injury. We also present evidence that myelinophagy is defective in the injured central nervous system. These results reveal an important role for inductive autophagy during Wallerian degeneration, and point to potential mechanistic targets for accelerating myelin clearance and improving demyelinating disease.


Figures

Figure 1.
Figure 1.
Autophagy is activated during Wallerian degeneration. (A) Heat map showing qPCR analysis of changes in expression of autophagy-related genes in cut nerves in vivo at different time points (e.g., 2D Cut = 2 d after nerve cut) relative to control uncut nerves. Data are expressed as log2 fold change relative to uncut nerves (red-blue color scale). Significant changes (P < 0.05) are denoted by asterisks within the heat map. Bar graphs depicting fold changes of all the genes examined are shown in Fig. S1. (B and C) Western blotting showing expression of selected autophagy-related proteins (B), and LC3 (LC3-I, 18 kD; LC3-II, 16 kD) and NBR1 (C), in uncut nerves and cut nerves in vivo at different time points. Myelin proteins MPZ and MBP are used as controls to show demyelination after nerve cut. GAPDH is used as a loading control. Quantification of Western blots is shown in Fig. S2, A and B, respectively. (D and E) Western blots showing that LC3-II and NBR1 accumulate after a 3-h treatment with the lysosomal blocker NH4Cl in nerve segments maintained in vitro (D), and dissociated Schwann cell cultures (E). Graphs show significantly higher net LC3-II flux (D) in demyelinating nerves (5 d in vitro [5D]) compared with freshly isolated nerves (Uncut), and demyelinating Schwann cells (E) cultured for 3 d (3D) compared with freshly plated cells cultured for 3 h (3h). Data are presented as mean ± SEM (error bars) from a minimum of three independent experiments. **, P < 0.01. A quantification of NBR1 levels is shown in Fig. S2 (C and D). (F) Western blots showing expression of endogenous LC3 and GFP-LC3 in nerve segments from GFP-LC3 mice maintained in vitro at different time points. Cleaved GFP bands demonstrate a transient increase in autophagic flux after nerve injury. Quantification of Western blots is shown in Fig. S2 E. (G–I) GFP-LC3 puncta in nerves from GFP-LC3 mice. (G) The immunolabeled micrographs show the accumulation of GFP-LC3 puncta in teased nerve segments maintained in vitro for 5 d compared with control teased uncut nerves. MPZ labels myelin. Individual MPZ and GFP-LC3 labeling for 5D nerve segments are shown to illustrate colocalization of MPZ+ myelin debris and GFP-LC3+ autophagosomes (arrows). (H) Graph shows quantification of fibers positive for GFP-LC3 puncta in nerves cultured for 3, 5, and 7 d. n = 3 mice for each time point. Data are presented as mean ± SEM (error bars). **, P < 0.01 (cultured segments relative to uncut nerves). (I) Immunolabeling showing elevated expression of GFP-LC3 puncta in dissociated Schwann cells degrading myelin, shown by the presence of MPZ+ myelin compared with that seen in MPZ Schwann cells. Individual MPZ and GFP-LC3 labeling for MPZ+ Schwann cells are shown to illustrate colocalization of MPZ+ myelin debris and GFP-LC3+ autophagosomes (arrows). The graph shows quantification of the number of GFP-LC3+ Schwann cells that are MPZ+ or MPZ. Data are presented as mean ± SEM (error bars) from a minimum of three independent experiments with a minimum of 60 cells analyzed per experiment. **, P < 0.01 (MPZ+ cells relative to MPZ cells).
Figure 2.
Figure 2.
Schwann cell autophagosomes enclose degraded myelin. Electron micrographs show the presence of structures typical of autophagosomes surrounding myelin debris. (A) Myelin debris (M) are surrounded by the double membrane of an autophagosome (arrowheads) within a Schwann cell in a nerve piece. Note the basal lamina surrounding the Schwann cell processes (arrow) and the collagen fibrils outside the basal lamina. (B) Myelin debris (M) and cytoplasm (C) are enclosed by an autophagosome (arrowhead) in a cultured Schwann cell. The myelin is shown at high magnification in the inset.
Figure 3.
Figure 3.
Pharmacological block of autophagy prevents myelin degradation. (A) Western blot showing a block in degradation of the myelin proteins MPZ and MBP in nerve segments maintained in vitro for 5 d and treated with different pharmacological inhibitors: untreated, lysosomal inhibitor, NH4Cl, and autophagy inhibitors 3-MA and bafilomycin A1 (Baf). No such effect is seen in freshly isolated nerve segments treated with these inhibitors for 3 h. The black line indicates that intervening lanes have been spliced out. Graphs show densitometric quantification of Western blots. Data are presented as mean ± SEM (error bars) from three independent experiments. n.s., nonsignificant; *, P < 0.05. (B) qPCR analysis showing no significant differences (n.s.) in mRNA levels of Mpz and Mbp in nerve segments maintained in vitro for 5 d and treated with 3-MA and Baf, compared with untreated segments. Data are expressed as log2 fold change in 5D cultured nerve segments relative to uncut nerves. n = 3 for each condition. Data are presented as mean ± SEM (error bars). (C) Electron micrographs showing abundant intact myelin sheaths in nerve segments cultured in vitro for 4 d in the presence of 3-MA, compared with untreated cultures. The graph shows a quantification of the number of intact myelin sheaths in untreated segments and segments treated with 3-MA. (D) Teased fibers from untreated and 3-MA treated nerve segments (5 d) stained with FluoroMyelin red. The graph shows a quantification of the myelin fluorescent area. (E) Immunolabeling showing a block in the degradation of lipids (Bodipy+ cells) in dissociated Schwann cell cultures after 3 d of 3-MA treatment. Graph shows quantification of Bodipy+ area. (F) 3-MA blocks myelin protein degradation in dissociated Schwann cell cultures. Immunolabeling showing a block in degradation of MPZ in dissociated Schwann cells (S100+) cultured for 5 d in the presence of 3-MA. The graph shows MPZ+ area in dissociated cultures treated with 3-MA. (G) Graph showing the number of MPZ+ Schwann cells in dissociated cultures treated for 5 d with 3-MA, bafilomycin, and NH4Cl. (C–G) Data are presented as mean ± SEM (error bars) from three independent experiments with a minimum of 10 picture frames analyzed per condition/experiment. *, P < 0.05; **, P < 0.01 (treated cells relative to untreated controls).
Figure 4.
Figure 4.
Genetic inactivation of autophagy retards myelin degradation in vivo. (A) Western blot showing higher levels of the myelin proteins MPZ, MBP, and Periaxin in 5 d cut nerves from Atg7 cKO mice compared with WT controls. (B) Densitometric analysis of Western blots showing higher levels of myelin proteins in 5 and 7 d cut nerves from Atg7 cKO mice compared with WT controls. For each comparison, the value for cKO is normalized to that seen in WT. n = a minimum of three mice for the genotype/time point. Data are presented as mean ± SEM (error bars). *, P < 0.05; **, P < 0.01 (Atg7 cKO relative to WT). (C) Immunolabeling showing MPZ+ myelin inclusions in cultured WT Schwann cells and cells from Atg7 cKO nerves that often show bloated “cauliflower” morphology. The graph shows quantification of MPZ+ area. Data are presented as mean ± SEM (error bars) from three independent experiments with a minimum of 60 cells analyzed per condition. **, P < 0.01 (Atg7 cKO relative to WT). (D) Electron micrographs showing several intact myelin sheath profiles in 5 d cut nerves from Atg7 cKO mice. The graph shows a quantification of the number of intact myelin sheaths. Data are presented as mean ± SEM (error bars) from three independent experiments with a minimum of 18 picture frames analyzed per condition/experiment. **, P < 0.01 (Atg7 cKO relative to WT). (E) Teased fibers of 5 d cut nerves from WT and Atg7 cKO mice stained with FluoroMyelin red to show myelin. The graph shows a quantification of the myelin fluorescent area. Data are presented as mean ± SEM (error bars) from three independent experiments with a minimum of 10 picture frames analyzed per condition/experiment. **, P < 0.01 (Atg7 cKO relative to WT). (F) The lipid composition of whole sciatic nerves from 5 d cut WT and Atg7 cKO mice expressed as log2 fold change compared with uncut nerves. n = a minimum of four mice for each genotype. Data are presented as mean ± SEM (error bars). **, P < 0.01. (G) The lipid composition of purified myelin obtained from sciatic nerves from 5 d cut WT and Atg7 cKO mice, expressed as log2 fold change compared with uncut nerves. The individual lipid species detected by UPLC were grouped in distinct lipid classes as shown in the graph. “Membrane lipids” refers to all lipid species detected that are the major structural lipids in the eukaryotic membrane, including phosphatidylethanolamines, phosphatidylcholines, and phosphatidylinositols, and “storage lipids” include triacylglycerides and cholesteryl esters. See Table S2 for changes in levels of individual lipid species in WT and Atg7 cKO mice. n = 3 mice for each genotype. Data are presented as mean ± SEM (error bars). *, P < 0.05; **, P < 0.01 (Atg7 cKO relative to WT).
Figure 5.
Figure 5.
Genetic inactivation of autophagy retards the generation of repair cells after injury in vivo. (A and B) Graph showing fold change of the top 25 down-regulated (A) and up-regulated (B) proteins in 5 d cut nerves relative to uninjured nerves in WT and Atg7 cKO mice from proteomics analysis (Fig. S4 E). n = 5 mice for each genotype. Data are presented as mean ± SEM (error bars). *, P < 0.05 (Atg7 cKO relative to WT). (C) Western blot showing lower levels of the repair Schwann cell marker p75NTR in 5 d cut nerves from Atg7 cKO mice compared with WT controls. The graph shows densitometric analysis of Western blots. n = 3 mice for each genotype. Data are presented as mean ± SEM (error bars). **, P < 0.01. (D) qPCR analysis showing significantly lower levels of the mRNA levels of the repair Schwann cell markers Shh, GDNF, and Olig1 in 2, 5, and 7 d cut nerves from Atg7 cKO mice compared with WT controls. Data are expressed as fold change in cut nerves relative to uncut nerves. n = 3 mice for each genotype/time point. Data are presented as mean ± SEM (error bars). **, P < 0.01 (Atg7 cKO relative to WT).
Figure 6.
Figure 6.
Myelinophagy is mTOR independent and promoted by lithium and ceramide. (A) Western blot showing increased expression of pmTOR, p-S6, and p-AKT in cut WT nerves. Quantification of Western blots is shown in Fig. S5 A. (B) Immunolabeling showing regulation of MPZ breakdown by rapamycin, ceramide, or JNK inhibitor SP600125 in Schwann cell cultures (from P8 mice animals, treated 3 d in vitro). Myelin breakdown is unchanged by rapamycin, reduced by ceramide, and increased by JNK inhibitor compared with untreated cultures. (C) Graph showing MPZ+ myelin area in Schwann cell cultures (as in Fig. 6 B) after different treatments. Data are presented as mean ± SEM (error bars) from three independent experiments with a minimum of 200 cells analyzed per condition/experiment. *, P < 0.05; **, P < 0.01 (treated cells relative to untreated controls). (D) Electron micrographs showing fewer intact myelin sheaths in nerve segments maintained in vitro for 4 d in the presence of ceramide and lithium, compared with control cultures. The graph shows quantification of the number of intact myelin sheaths in control segments and segments treated with ceramide and lithium. Data are presented as mean ± SEM (error bars) from three independent experiments with a minimum of 10 picture frames analyzed per condition/experiment. *, P < 0.05; **, P < 0.01 (treated cells relative to untreated controls). (E) Western blot showing increased LC3 II accumulation in nerve segments maintained in vitro for 3 d and treated with ceramide or lithium in the presence or absence of NH4Cl (3 h treatment). The graph shows increased net LC3 II flux after ceramide and lithium treatment compared with control cultures. Data are presented as mean ± SEM (error bars) from three independent experiments. *, P < 0.05 (treated cells relative to untreated controls). (F) Graph showing quantification of MPZ+ area in control Schwann cell cultures (WT) and cultures in which autophagy was blocked (Atg7 cKO cultures). The increased myelin degradation of MPZ seen after treatment with ceramide and lithium in WT dissociated Schwann cell cultures is blocked in Atg7 cKO cultures. See Fig. S5 D for pictures of immunolabeling. Data are presented as mean ± SEM (error bars) from three independent experiments with a minimum of 10 picture frames analyzed per condition/experiment. *, P < 0.05; ns, not significant (treated cells relative to untreated controls).
Figure 7.
Figure 7.
Regulation of myelinophagy. (A and B) Graph showing reduced LC3 II accumulation in nerve segments (A) maintained in vitro for 5 d and treated with JNK inhibitor in the presence and absence of NH4Cl (3 h treatment) and in nerve segments (B) maintained in vitro for 5 d from cJun cKO mice compared with WT mice, in the presence and absence of NH4Cl (3 h treatment). Graphs show reduced net LC3 II flux. Data are presented as mean ± SEM (error bars) from three independent experiments. **, P < 0.01 (treated cells relative to untreated cells; cJun cKO relative to WT). (C) Western blots showing elevated LC3 II levels in uninjured C3 nerves compared with WT nerves. The graph shows densitometric quantification of blots. n = 3 mice for each genotype. Data are presented as mean ± SEM (error bars). *, P < 0.05 (C3 mice relative to WT). (D) Western blots showing that LC3 II levels in optic nerves are substantially lower than in sciatic nerve 3 and 5 d after cut. The graph shows densitometric quantification of blots. Data are presented as mean ± SEM (error bars) from three independent experiments. *, P < 0.05 (sciatic nerves relative to optic nerves); **, P < 0.01 (cut sciatic nerves relative to uncut nerves); n.s., not significant (cut optic nerves relative to uncut nerves).
Figure 8.
Figure 8.
Outline of myelinophagy. (left) A transverse section through a myelin Schwann cell in an uninjured nerve. Note that the myelin sheath is in direct continuity with the Schwann cell membrane and an integral component of the Schwann cell. (right) A myelin Schwann cell after nerve injury and axonal degeneration. Note that the myelin sheath has broken up into myelin fragments lying in the Schwann cell cytoplasm. The proposed role of autophagy in digesting these fragments is illustrated.

Comment in

  • Myelinophagy: Schwann cells dine in.
    Thumm M, Simons M. Thumm M, et al. J Cell Biol. 2015 Jul 6;210(1):9-10. doi: 10.1083/jcb.201506039. J Cell Biol. 2015. PMID: 26150387 Free PMC article.

References

    1. Arthur-Farraj P.J., Latouche M., Wilton D.K., Quintes S., Chabrol E., Banerjee A., Woodhoo A., Jenkins B., Rahman M., Turmaine M., et al. . 2012. c-Jun reprograms Schwann cells of injured nerves to generate a repair cell essential for regeneration. Neuron. 75:633–647. 10.1016/j.neuron.2012.06.021 - DOI - PMC - PubMed
    1. Barr J., Caballería J., Martínez-Arranz I., Domínguez-Díez A., Alonso C., Muntané J., Pérez-Cormenzana M., García-Monzón C., Mayo R., Martín-Duce A., et al. . 2012. Obesity-dependent metabolic signatures associated with nonalcoholic fatty liver disease progression. J. Proteome Res. 11:2521–2532. 10.1021/pr201223p - DOI - PMC - PubMed
    1. Bligh E.G., and Dyer W.J.. 1959. A rapid method of total lipid extraction and purification. Can. J. Biochem. Physiol. 37:911–917. 10.1139/o59-099 - DOI - PubMed
    1. Brosius Lutz A., and Barres B.A.. 2014. Contrasting the glial response to axon injury in the central and peripheral nervous systems. Dev. Cell. 28:7–17. 10.1016/j.devcel.2013.12.002 - DOI - PubMed
    1. Chrast R., Saher G., Nave K.A., and Verheijen M.H.. 2011. Lipid metabolism in myelinating glial cells: lessons from human inherited disorders and mouse models. J. Lipid Res. 52:419–434. 10.1194/jlr.R009761 - DOI - PMC - PubMed

Publication types

MeSH terms

Substances