. 2015 Sep;66(3):534-42.
doi: 10.1161/HYPERTENSIONAHA.115.05320. Epub 2015 Jul 6.

Salt Sensitivity in Response to Renal Injury Requires Renal Angiotensin-Converting Enzyme

Affiliations

Salt Sensitivity in Response to Renal Injury Requires Renal Angiotensin-Converting Enzyme

Jorge F Giani et al. Hypertension. 2015 Sep.

Abstract

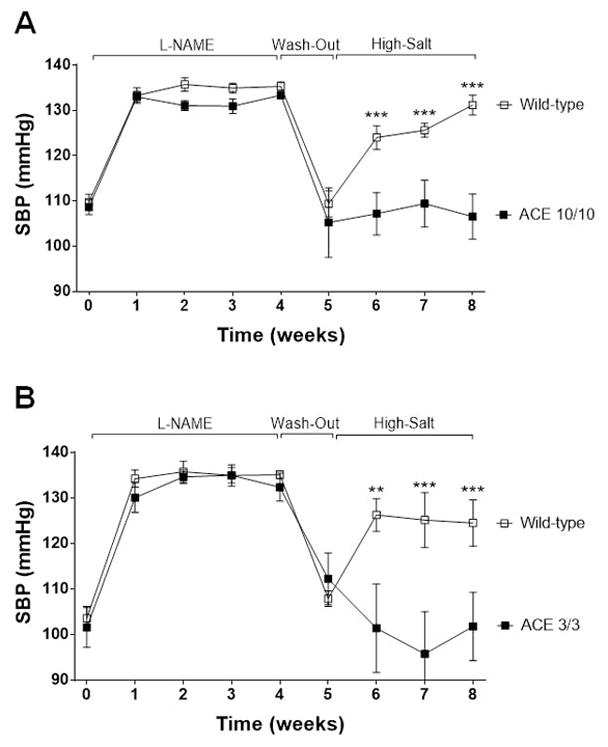
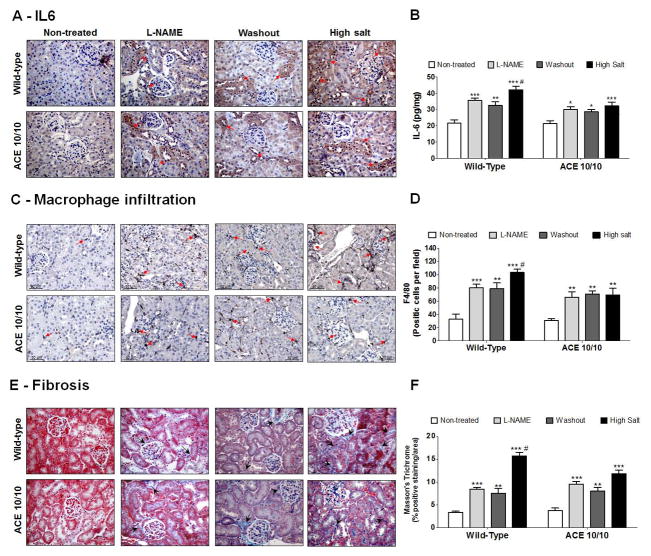
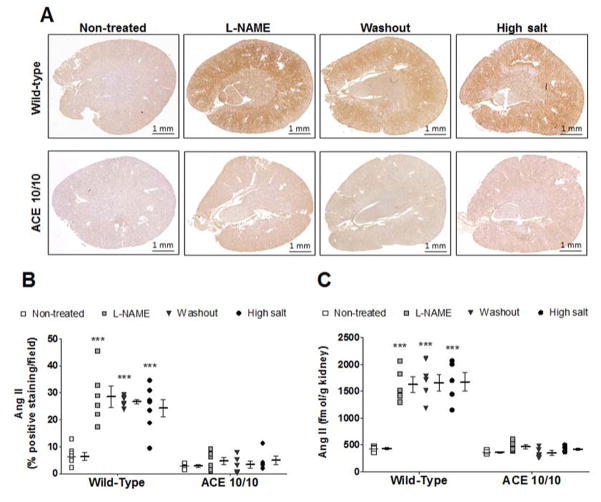
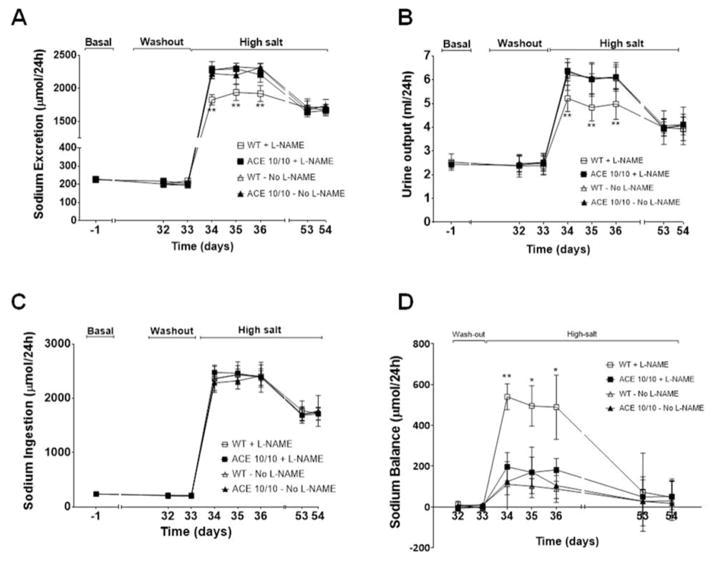
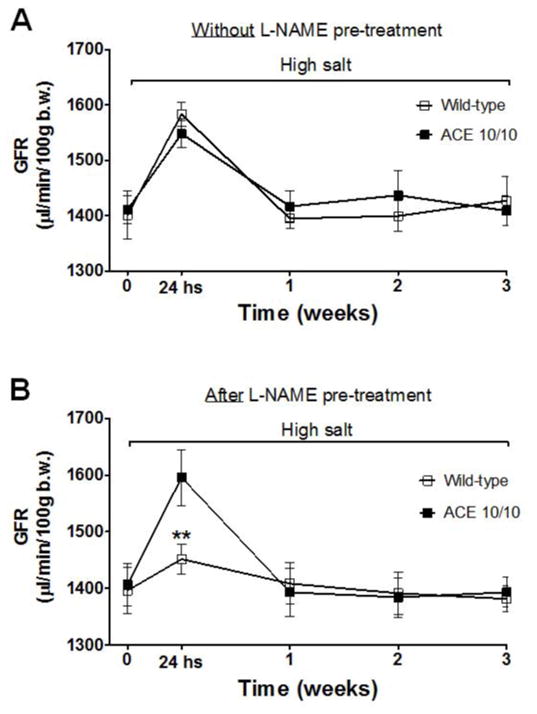
Recent evidence indicates that salt-sensitive hypertension can result from a subclinical injury that impairs the kidneys' capacity to properly respond to a high-salt diet. However, how this occurs is not well understood. Here, we showed that although previously salt-resistant wild-type mice became salt sensitive after the induction of renal injury with the nitric oxide synthase inhibitor Nω-nitro-l-arginine methyl ester hydrochloride; mice lacking renal angiotensin-converting enzyme, exposed to the same insult, did not become hypertensive when faced with a sodium load. This is because the activity of renal angiotensin-converting enzyme plays a critical role in (1) augmenting the local pool of angiotensin II and (2) the establishment of the antinatriuretic state via modulation of glomerular filtration rate and sodium tubular transport. Thus, this study demonstrates that the presence of renal angiotensin-converting enzyme plays a pivotal role in the development of salt sensitivity in response to renal injury.

Keywords: angiotensin-converting enzyme; diet; glomerular filtration rate; hypertension; inflammation.


Figures

Figure 1
Figure 1. The absence of renal ACE prevents the development of salt-sensitive hypertension
ACE 10/10 (A), ACE 3/3 (B) and wild-type (WT) mice were exposed to 4 weeks of L-NAME, a 1-week washout period, and then, 3 weeks of high salt diet (4%). L-NAME was given to WT (0.5 mg/mL) and mutant mice (1.5 mg/mL) in the drinking water. SBP: Systolic blood pressure. Values represent mean ± SEM. n = 6–17 per group, **p<0.01, ***p<0.001.
Figure 2
Figure 2. Wild-type (WT) and ACE 10/10 mice display similar levels of renal inflammation and injury during post L-NAME hypertension
Kidneys from WT and ACE 10/10 mice were collected at the end of each phase of the post L-NAME protocol. Renal sections were stained for IL-6 (A) and results were confirmed by ELISA in kidney homogenates. Data were expressed as pg of IL-6 per mg of total kidney protein (B). Macrophage infiltration was performed by F4/80 staining (C) and data were expressed as F4/80 positive cells per area (D). Fibrosis was assessed by Masson’s Trichrome staining (E) and expressed as percentage of positive staining per area (F). L-NAME was given to WT (0.5 mg/mL) and ACE 10/10 (1.5 mg/mL) in the drinking water. Values represent the mean ± SEM. n = 5–11 per group, *p<0.05; **p<0.01; ***p<0.001 vs. non-treated mice; #p<0.05 vs. all groups.
Figure 3
Figure 3. Renal angiotensin (Ang) II immunostaining during post L-NAME hypertension
Kidneys from wild-type and ACE 10/10 mice were collected after each phase of the post L-NAME protocol. Renal sections were stained for Ang II (A) and values were expressed as percentage of positive staining per area (B). Renal Ang II content was confirmed by an enzyme immunoassay and data were expressed as fmol of Ang II per gram of kidney (C). L-NAME was given to WT (0.5 mg/mL) and ACE 10/10 (1.5 mg/mL) in the drinking water. n = 5–10 per group, ***p<0.001 vs. non-treated mice.
Figure 4
Figure 4. Mice lacking renal ACE display improved sodium (Na+) handling
Wild-type (WT) and ACE 10/10 mice were housed individually in metabolic cages with free access to food and water before and during the high-salt diet. Na+ excretion (A) and urine output (B) as well as Na+ ingestion (C) were used to calculate Na+ balance (D). Values were expressed as μmol Na+ per day. L-NAME was previously given to WT (0.5 mg/mL) and ACE 10/10 (1.5 mg/mL) in the drinking water. WT and ACE 10/10 mice not pre-treated with L-NAME were used as controls. Values represent mean ± SEM. n = 8 per group, *p<0.05; **p<0.01.
Figure 5
Figure 5. Renal ACE impairs the acute increase of glomerular filtration rate (GFR) elicited by a high salt diet
GFR was estimated by the transcutaneous method at the indicated times during the 3-week course of the high salt diet in: naïve, not pre-treated with L-NAME, wild-type and ACE 10/10 mice (A), and in animals previously exposed to the L-NAME (B). Values represent the mean ± SEM. n = 5–7 per group, **p<0.01.
Figure 6
Figure 6. Lower abundance and/or phosphorylation of NHE3, NKCC2, NCC and the cleaved (CL) subunit of ENaC were observed in animals lacking renal ACE after the washout phase
(A) Transporter expression was analyzed in kidney homogenates from non-treated mice and after the washout phase. L-NAME was given to wild-type (0.5 mg/mL) and mutant mice (1.5 mg/mL) in the drinking water. Immunoblots were performed with a constant amount of protein per lane. Relative abundance from each group is displayed below the corresponding blot as mean ± SEM. n = 12 per group, *p<0.05; **p<0.01; ***p<0.001 vs. corresponding non-treated mice. (B) Bars represent the relative reduction vs. non-treated mice (set as 0), *p<0.05; **p<0.01; ***p<0.001.
Figure 7
Figure 7. The absence of renal ACE amplifies reductions in abundance and/or phosphorylation of NCC and the cleaved (CL) portion of αENaC after 3 weeks of a high salt diet
(A) Transporter expression was analyzed in total kidney homogenates from non-treated mice and after a 3-week high salt phase. L-NAME was given to wild-type (0.5 mg/mL) and mutant mice (1.5 mg/mL) in the drinking water. Immunoblots were performed with a constant amount of protein per lane. Relative abundance from each group is displayed below the corresponding blot as mean ± SEM. n = 12 per group, *p<0.05; **p<0.01; ***p<0.001 vs. corresponding non-treated mice. (B) Bars represent the relative reduction vs. non-treated mice (set as 0), *p<0.05; **p<0.01; ***p<0.001.

References

    1. Sanada H, Jones JE, Jose PA. Genetics of salt-sensitive hypertension. Current hypertension reports. 2011;13:55–66. - PMC - PubMed
    1. Lifton RP. Molecular genetics of human blood pressure variation. Science. 1996;272:676–680. - PubMed
    1. Rodriguez-Iturbe B, Franco M, Tapia E, Quiroz Y, Johnson RJ. Renal inflammation, autoimmunity and salt-sensitive hypertension. Clin Exp Pharmacol Physiol. 2012;39:96–103. - PMC - PubMed
    1. Franco M, Tapia E, Bautista R, Pacheco U, Santamaria J, Quiroz Y, Johnson RJ, Rodriguez-Iturbe B. Impaired pressure natriuresis resulting in salt-sensitive hypertension is caused by tubulointerstitial immune cell infiltration in the kidney. American journal of physiology. Renal physiology. 2013;304:F982–990. - PMC - PubMed
    1. Kamat NV, Thabet SR, Xiao L, Saleh MA, Kirabo A, Madhur MS, Delpire E, Harrison DG, McDonough AA. Renal transporter activation during angiotensin-ii hypertension is blunted in interferon-gamma−/− and interleukin-17a−/− mice. Hypertension. 2015;65:569–576. - PMC - PubMed

Publication types