. 2015 Sep;81(18):6314-23.
doi: 10.1128/AEM.01545-15. Epub 2015 Jul 6.

Novel Strategies for Genomic Manipulation of Trichoderma reesei with the Purpose of Strain Engineering

Affiliations

Novel Strategies for Genomic Manipulation of Trichoderma reesei with the Purpose of Strain Engineering

Christian Derntl et al. Appl Environ Microbiol. 2015 Sep.

Erratum in

Abstract

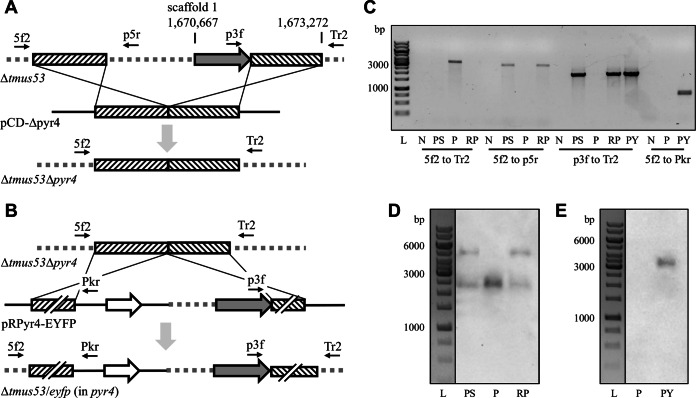
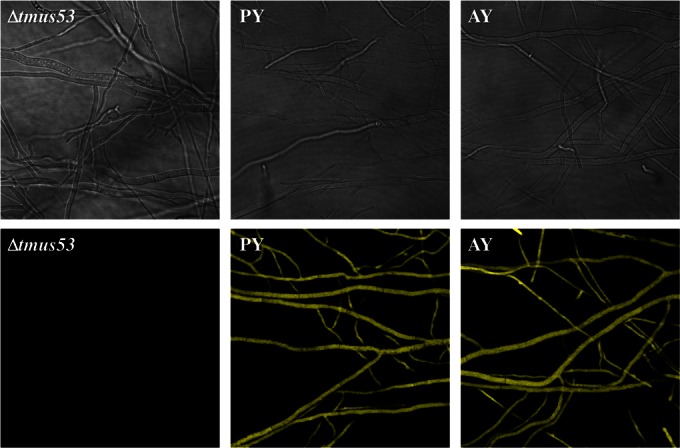
The state-of-the-art procedure for gene insertions into Trichoderma reesei is a cotransformation of two plasmids, one bearing the gene of interest and the other a marker gene. This procedure yields up to 80% transformation efficiency, but both the number of integrated copies and the loci of insertion are unpredictable. This can lead to tremendous pleiotropic effects. This study describes the development of a novel transformation system for site-directed gene insertion based on auxotrophic markers. For this purpose, we tested the applicability of the genes asl1 (encoding an enzyme of the l-arginine biosynthesis pathway), the hah1 (encoding an enzyme of the l-lysine biosynthesis pathway), and the pyr4 (encoding an enzyme of the uridine biosynthesis pathway). The developed transformation system yields strains with an additional gene at a defined locus that are prototrophic and ostensibly isogenic compared to their parental strain. A positive transformation rate of 100% was achieved due to the developed split-marker system. Additionally, a double-auxotrophic strain that allows multiple genomic manipulations was constructed, which facilitates metabolic engineering purposes in T. reesei. By employing goxA of Aspergillus niger as a reporter system, the influence on the expression of an inserted gene caused by the orientation of the insertion and the transformation strategy used could be demonstrated. Both are important aspects to be considered during strain engineering.


Figures

FIG 1
FIG 1
Modification of the pyr4 locus during strain generation. (A and B) Schematic drawings of the destruction of the pyr4 locus in the parental strain QM6a Δtmus53tmus53) by homologous recombination with the plasmid pCD-Δpyr4, yielding a pyr4 deletion strain (Δtmus53Δpyr4) (A), and integration of the EYFP gene expression cassette upstream of pyr4 by recombination with the plasmid pRPyr4-EYFP, yielding a reestablished strain additionally bearing the EYFP gene [Δtmus53/eyfp (in pyr4)] (B). The position of the pyr4 locus on scaffold 1 is indicated at the top. Thin black arrows indicate the approximate positions of the primers used for genomic characterization via PCR and subsequent sequencing. 5f2, 5pyr4_fwd2; p5r, pyr4_5rev; p3f, pyr4_3f; Tr2, Tpyr4_rev2; Pkr, Ppki_Mrev. Black-rimmed gray arrows represent the pyr4 gene, hatched boxes represent flanking regions for homologous recombination, gray arrows indicate homologous recombination events, black-rimmed white arrows represent the EYFP gene, gray dotted lines represent genomic DNA sequences, and solid black lines represent plasmid DNA sequences. (C tot E) Correct and exclusive integration events at the pyr4 locus were verified by PCR (C) and Southern blot analyses (D and E). (D) Southern blot analysis of BcuI-digested chromosomal DNA using the flanking regions as probes resulted in expected signals at bp 2469 and 5297 for the parent locus or at bp 2326 and 2500 for the modified locus. (E) Southern blot analysis of AatII-digested chromosomal DNA using the EYFP gene coding region as probe resulted in an expected signal at bp 3289. L, 1-kb DNA ladder; N, no-template control; PS, QM6a Δtmus53; P, QM6a Δtmus53 Δpyr4; RP, reestablished QM6a Δtmus53 (obtained via transformation with pCD-RPyr4); PY, QM6a Δtmus53/eyfp.
FIG 2
FIG 2
Modification of the asl1 locus during strain generation. (A and B) Schematic drawings of the partial deletion of asl1 in the parental strain QM6a Δtmus53tmus53) by homologous recombination with the plasmid pCD-Δasl1, yielding an asl1 deletion strain (Δtmus53 Δasl1) (A), and integration of the EYFP gene expression cassette upstream of asl1 by recombination with the plasmid pRAsl1-EYFP, yielding a reestablished strain additionally bearing the EYFP gene [Δtmus53/eyfp (in asl1)] (B). The position of the asl1 locus on scaffold 17 is indicated at the top. Thin black arrows indicate the approximate positions of the primers used for genomic characterization via PCR and subsequent sequencing. −2.1f, asl1-2.1kf; −900r, asl1-900r; 0f, asl1_0f; Pkr, Ppki_Mrev; Tcf, Tcbh2Mfwd. Black-rimmed gray arrows represent the asl1 gene, hatched boxes represent regions for homologous recombination, thick black arrows represent the hyg gene, gray arrows indicate homologous recombination events, black-rimmed white arrows represent the EYFP gene, gray dotted lines represent genomic DNA sequences, and solid black lines represent plasmid DNA sequences. (C to E) Correct and exclusive integration events at the asl1 locus were verified by PCR (C) and Southern blot analyses (D and E). (D) Southern blot analysis of PstI-digested chromosomal DNA using the hph coding region as probe resulted in expected signals at bp 2432 and 5040. (E) Southern blot analysis of NsiI-digested chromosomal DNA using the deleted promoter of asl1 as a probe resulted in an expected signal at bp 9999. (F) Southern blot analysis of EcoRI-digested chromosomal DNA using the EYFP gene coding region as a probe resulted in an expected signal at bp 4035. L, 1-kb DNA ladder; N, no-template control; PS, QM6a Δtmus53; A, QM6a Δtmus53Δasl1; RA, reestablished QM6a Δtmus53 (via transformation with pCD-RAsl1); AY, QM6a Δtmus53/eyfp; P, QM6a Δtmus53Δpyr4; PA, QM6a Δtmus53 Δpyr4 Δasl1.
FIG 3
FIG 3
Modification of the hah1 locus during strain generation. (A) Schematic drawing of the partial deletion of hah1 in the parental strain QM6a Δtmus53tmus53) by homologous recombination with the plasmid pCD-Δhah1, yielding a hah1 deletion strain (Δtmus53 Δhah1). The position of the hah1 locus on scaffold 25 is indicated at the top. Thin black arrows indicate the approximate positions of the primers used for genomic characterization via PCR and subsequent sequencing. P5f, Phah1_5f; 4.3r, hah1 + 4.3kr; Pkr, Ppki_Mrev; Tcf, Tcbh2Mfwd. The black-rimmed gray arrow represents the hah1 gene, hatched boxes represent regions for homologous recombination, thick black arrows represent the hyg gene, the gray arrow indicates a homologous recombination event, gray dotted lines represent genomic DNA sequences, and solid black lines represent plasmid DNA sequences. (B) Agarose gel electrophoresis of DNA fragments obtained by PCR in order to verify genetic modifications within the hah1 locus. L, 1-kb DNA ladder; N, no-template control; PS, QM6a Δtmus53; H, QM6a Δtmus53 Δhah1.
FIG 4
FIG 4
Effect of deletion of potential marker genes on the growth behavior of T. reesei. T. reesei strains QM6a Δtmus53tmus53), QM6a Δtmus53 Δpyr4pyr4), QM6a Δtmus53 Δasl1asl1), and QM6a Δtmus53 Δpyr4 Δasl1pyr4Δasl1) were inoculated with a piece of mycelium and grown in petri dishes containing minimal medium alone or supplemented with uridine (+U) and/or l-arginine (+A) for 4 days at 30°C. Strain QM6a Δtmus53 Δhah1hah1) was inoculated either with spores or a piece of mycelium and grown on minimal medium plates in the same way.
FIG 5
FIG 5
Microscopic analyses of T. reesei strains expressing EYFP. Bright-light (top panels) and fluorescence (bottom panels) live-cell images of QM6a Δtmus53tmus53), QM6aΔtmus53/eyfp bearing the EYFP gene expression cassette upstream of pyr4 (PY), and QM6a Δtmus53/eyfp bearing the EYFP gene expression cassette upstream of asl1 (AY) are shown.
FIG 6
FIG 6
Modification of the pyr4 locus for generation of goxA expression strains. (A and B) Schematic drawings of the insertion of the goxA expression cassette in forward or reverse orientation into the pyr4 locus of the parental strain QM6a Δtmus53tmus53) by homologous recombination with the plasmid pDelp4-pc2G-FW or pDelp4-pc2G-RV, resulting in the pyr4 deletion strains QM6a Δtmus53 Δpyr4/pc2G-FW [Δpyr4::goxA(fwd)] (A) and QM6a Δtmus53 Δpyr4/pc2G-RV [Δpyr4::goxA(rev)] (B), respectively. (C) Schematic drawing of the insertion of the goxA expression cassette into the pyr4 locus of QM6a Δtmus53 Δpyr4pyr4) by homologous recombination with the plasmid pRPyr4-pc2G-FW, resulting in strain QM6a Δtmus53/pc2G-FW [Δtmus53/goxA (in pyr4)]. The position of the pyr4 locus on scaffold 1 is indicated at the top. Thin black arrows indicate the approximate positions of the primers used for genomic characterization via PCR and subsequent sequencing. 5f2, 5pyr4_fwd2; Tr2, Tpyr4_rev2; Pcr, pchb2_rev-BamHI-NheI; Tgf, TgoxA_fwd; p3f; pyr4_3f. Black-rimmed gray arrows represent the pyr4 gene, hatched boxes represent regions for homologous recombination, thick black arrows represent the goxA gene, gray arrows indicate homologous recombination events, gray dotted lines represent genomic DNA sequences, and solid black lines represent plasmid DNA sequences. (D to F) Correct and exclusive integration events at the pyr4 locus were verified by PCR (D and E) and Southern blot analysis (F). (F) Southern blot analysis of SacII-digested chromosomal DNA using the goxA coding region as probe resulted in expected signals at bp 3002 and 3006 for QM6a Δtmus53 Δpyr4/pc2G-FW, at bp 2817 and 3191 for QM6a Δtmus53 Δpyr4/pc2G-RV, and at bp 1496 and 2987 for QM6a Δtmus53/pc2G-FW. L, 1-kb DNA ladder; N, no-template control; PS, QM6a Δtmus53; GF, QM6a Δtmus53 Δpyr4/pc2G-FW; GR, QM6a Δtmus53 Δpyr4/pc2G-RV; P, QM6a Δtmus53 Δpyr4; PG, QM6a Δtmus53/pc2G-FW.
FIG 7
FIG 7
Comparison of goxA expression depending on transformation strategy and orientation. (A) T. reesei strains QM6a Δtmus53/pc2G-FW (white bar), QM6a Δtmus53 Δpyr4/pc2G-FW (light gray bar), and QM6a Δtmus53 Δpyr4/pc2G-RV (dark gray bar) were precultured on glycerol and transferred to sophorose for 8 h. Glucose oxidase activity in supernatants was measured and normalized to the biomass (dry weight). Values are means from biological duplicates and technical triplicates and are given as fold changes (y axes) comparing the investigated strains (x axes). Error bars indicate standard deviations. (B) Three genetically identical T. reesei strains (QM6a Δtmus53pc2G-FW) were analyzed in an analogous experiment.

Similar articles

Cited by

References

    1. Kuhls K, Lieckfeldt E, Samuels GJ, Kovacs W, Meyer W, Petrini O, Gams W, Börner T, Kubicek CP. 1996. Molecular evidence that the asexual industrial fungus Trichoderma reesei is a clonal derivative of the ascomycete Hypocrea jecorina. Proc Natl Acad Sci U S A 93:7755–7760. doi:10.1073/pnas.93.15.7755. - DOI - PMC - PubMed
    1. Teeri T, Salovuori I, Knowles J. 1983. The molecular cloning of the major cellulase gene from Trichoderma reesei. Biotechnology 1:696–699. doi:10.1038/nbt1083-696. - DOI
    1. Kubicek CP, Harman GE. 1998. Trichoderma and Gliocladium. Taylor & Francis, London, United Kingdom.
    1. Kumar R, Singh S, Singh OV. 2008. Bioconversion of lignocellulosic biomass: biochemical and molecular perspectives. J Ind Microbiol Biotechnol 35:377–391. doi:10.1007/s10295-008-0327-8. - DOI - PubMed
    1. Cherry JR, Fidantsef AL. 2003. Directed evolution of industrial enzymes: an update. Curr Opin Biotechnol 14:438–443. doi:10.1016/S0958-1669(03)00099-5. - DOI - PubMed

Publication types

LinkOut - more resources