. 2015 Jul 27;212(8):1185-202.
doi: 10.1084/jem.20141286. Epub 2015 Jul 6.

Reticular dysgenesis-associated AK2 protects hematopoietic stem and progenitor cell development from oxidative stress

Affiliations

Reticular dysgenesis-associated AK2 protects hematopoietic stem and progenitor cell development from oxidative stress

Alberto Rissone et al. J Exp Med. .

Abstract

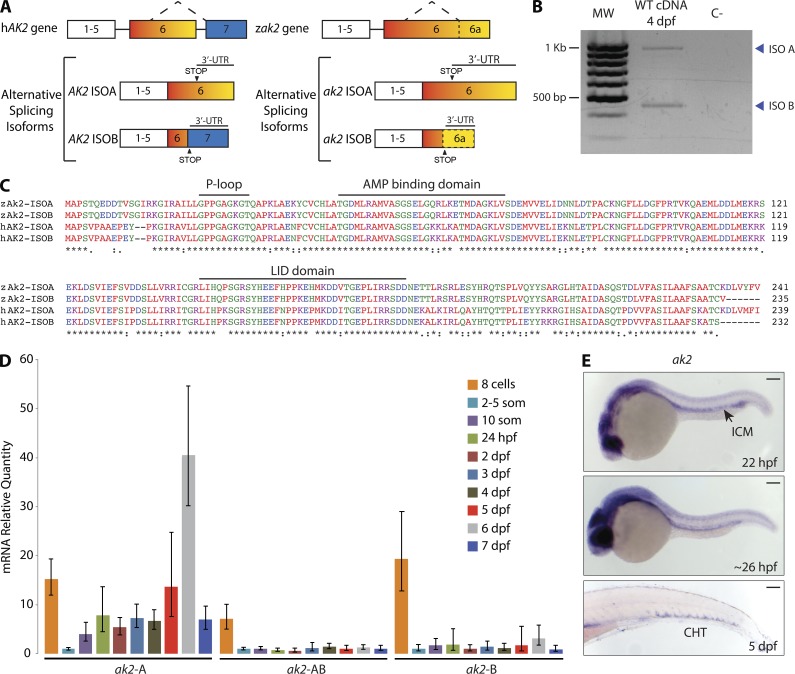
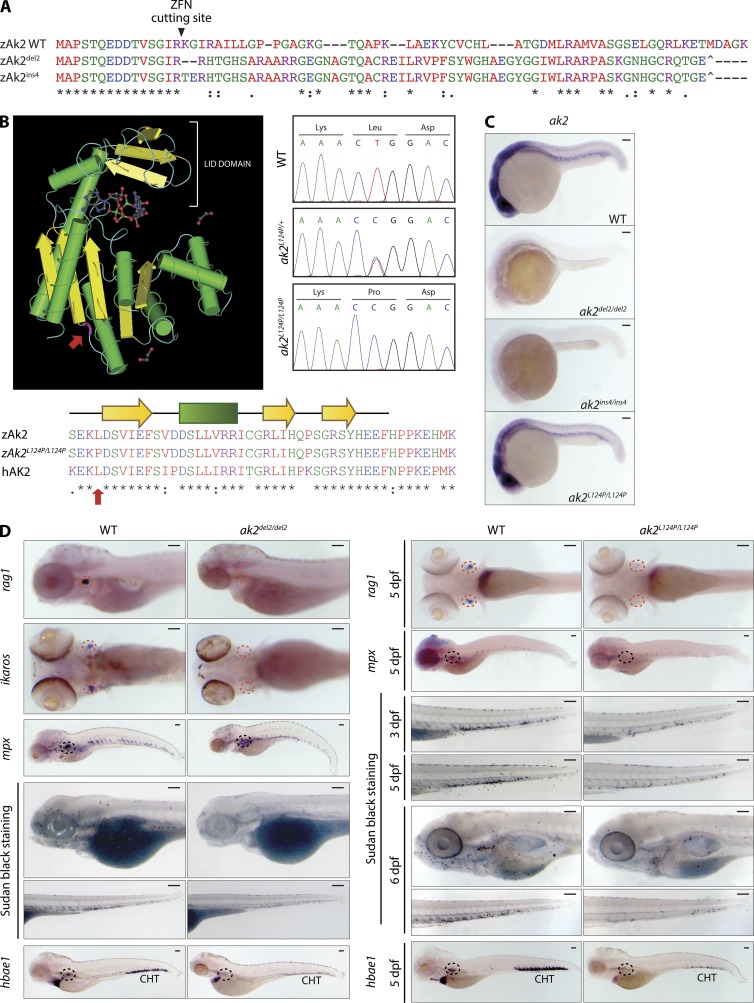
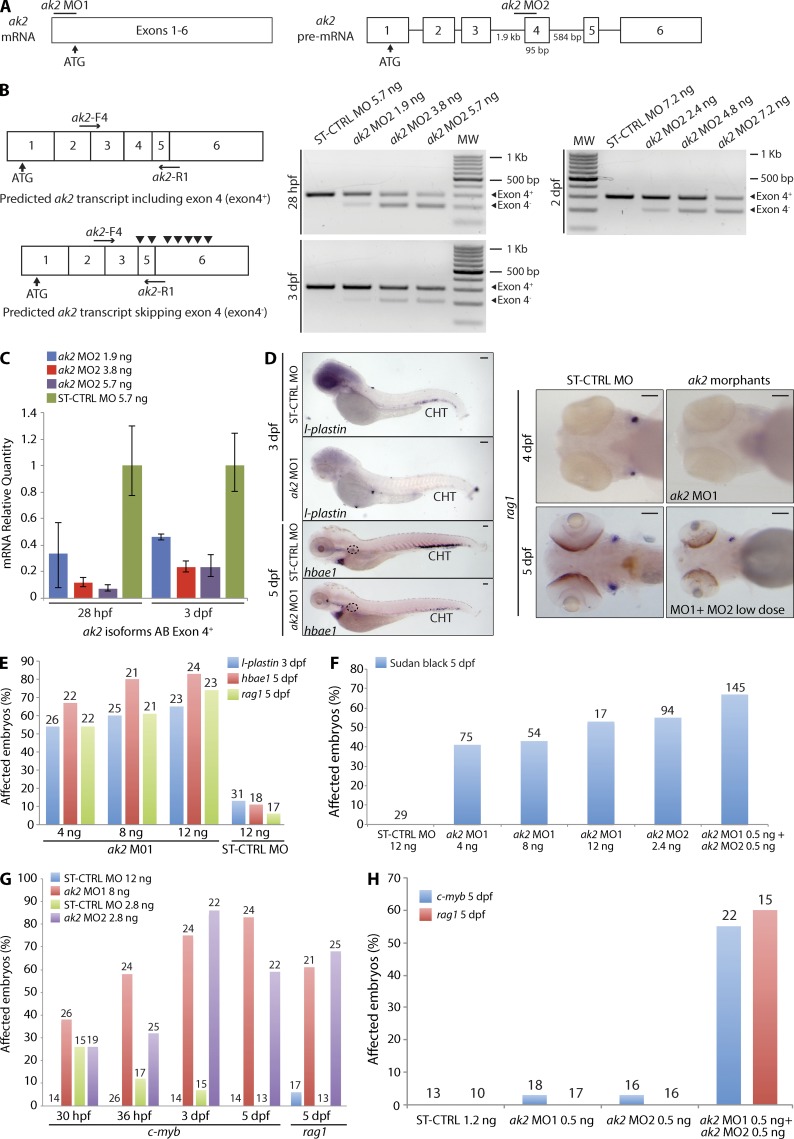
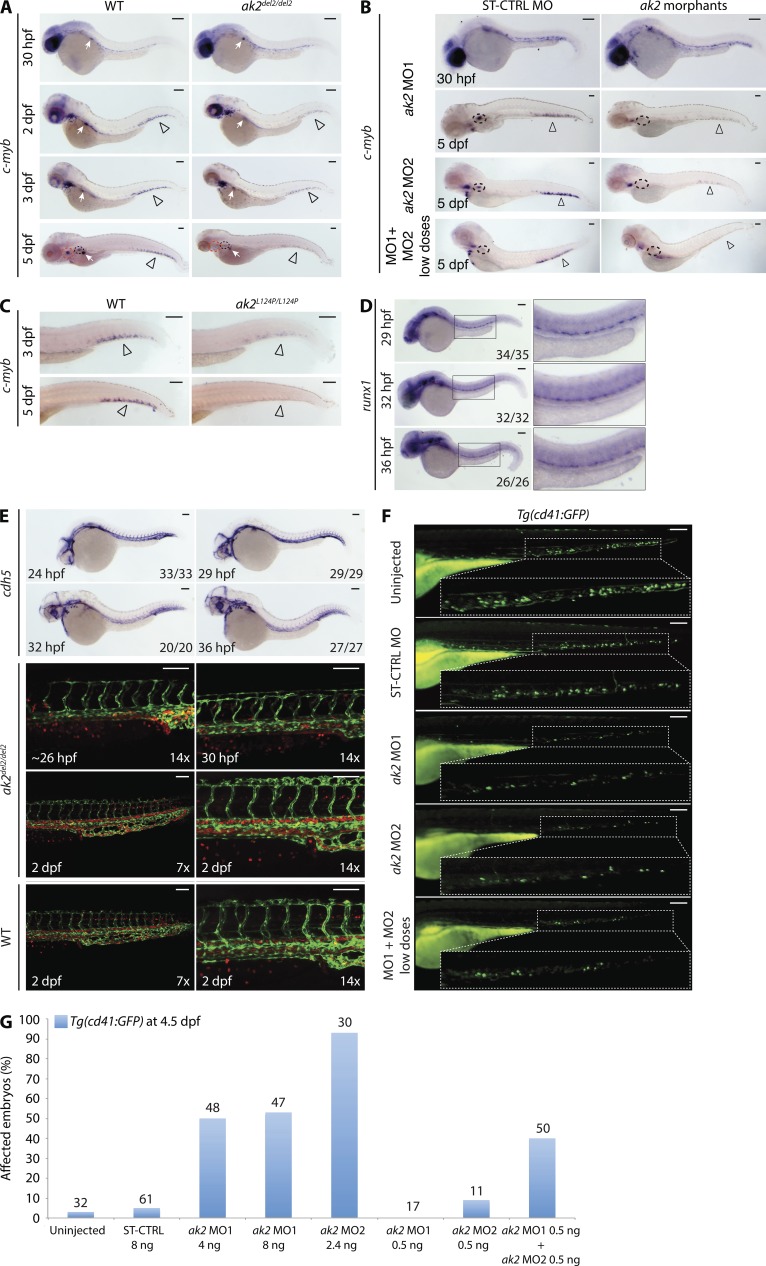
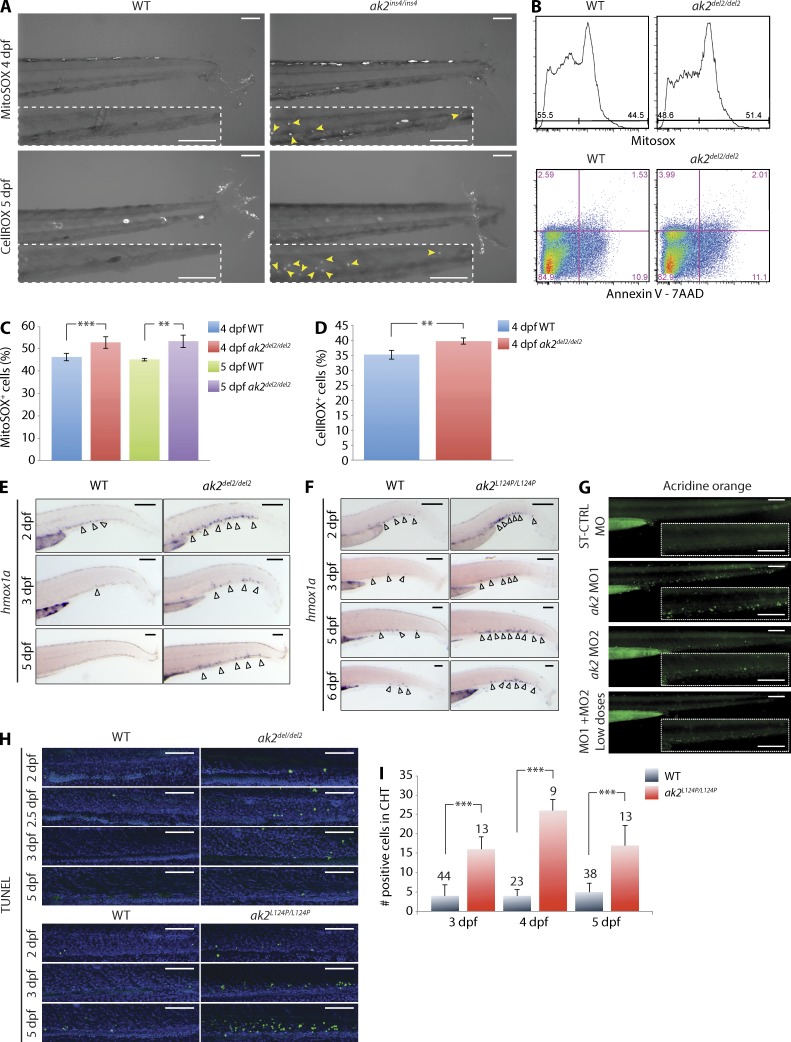
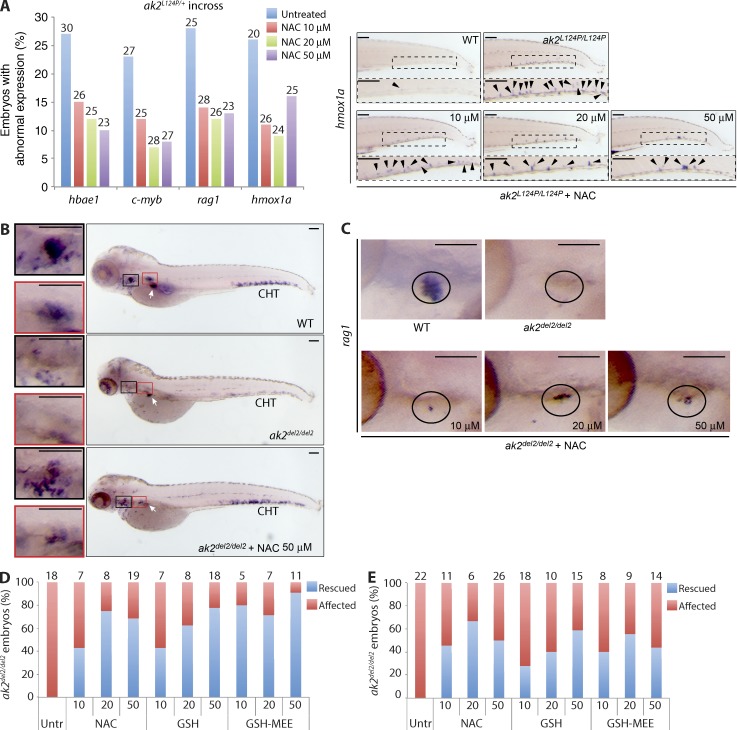
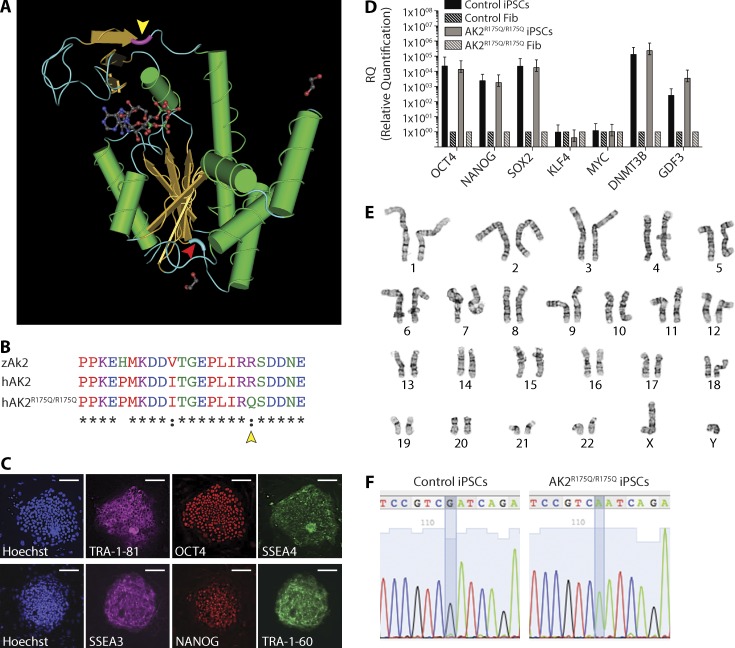
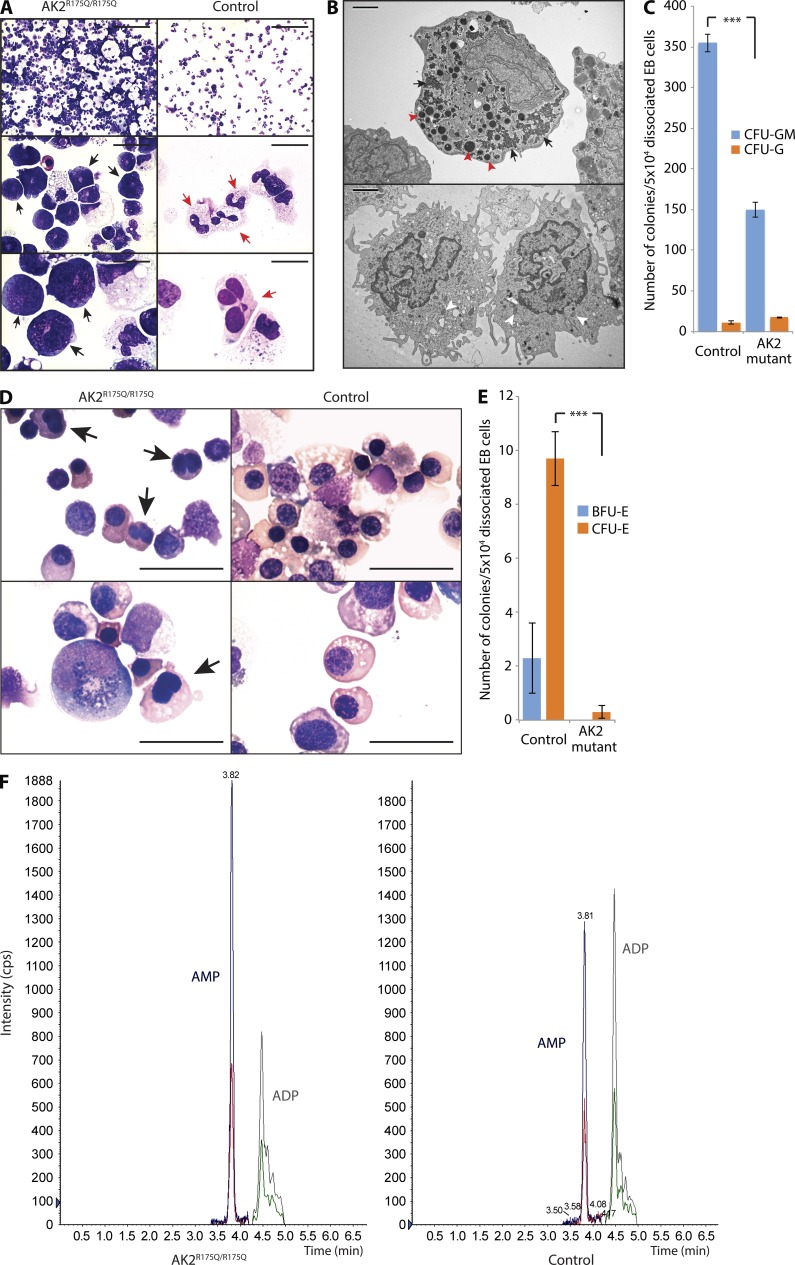
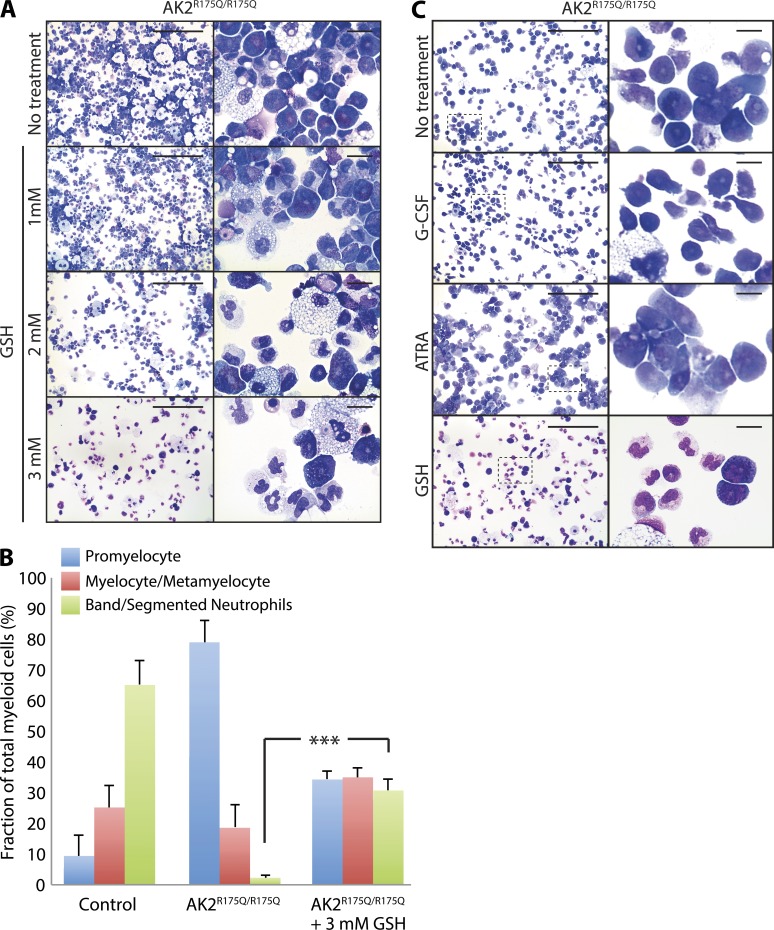
Adenylate kinases (AKs) are phosphotransferases that regulate the cellular adenine nucleotide composition and play a critical role in the energy homeostasis of all tissues. The AK2 isoenzyme is expressed in the mitochondrial intermembrane space and is mutated in reticular dysgenesis (RD), a rare form of severe combined immunodeficiency (SCID) in humans. RD is characterized by a maturation arrest in the myeloid and lymphoid lineages, leading to early onset, recurrent, and overwhelming infections. To gain insight into the pathophysiology of RD, we studied the effects of AK2 deficiency using the zebrafish model and induced pluripotent stem cells (iPSCs) derived from fibroblasts of an RD patient. In zebrafish, Ak2 deficiency affected hematopoietic stem and progenitor cell (HSPC) development with increased oxidative stress and apoptosis. AK2-deficient iPSCs recapitulated the characteristic myeloid maturation arrest at the promyelocyte stage and demonstrated an increased AMP/ADP ratio, indicative of an energy-depleted adenine nucleotide profile. Antioxidant treatment rescued the hematopoietic phenotypes in vivo in ak2 mutant zebrafish and restored differentiation of AK2-deficient iPSCs into mature granulocytes. Our results link hematopoietic cell fate in AK2 deficiency to cellular energy depletion and increased oxidative stress. This points to the potential use of antioxidants as a supportive therapeutic modality for patients with RD.


Figures

Figure 1.
Figure 1.
Zebrafish AK2 alternative splicing isoforms are expressed in hematopoietic regions during embryo development. (A) Schematic representation of human (hAK2) and zebrafish (zak2) conserved gene structure and alternative splicing mechanism. STOP indicates the position of the STOP codons. Neither exons nor introns are drawn to scale. (B) RT-PCR analysis on cDNA of 4 dpf WT embryos. The reverse primer AK2-ISO B R2 (Table S1) was used in the PCR reaction to bind to isoforms A and B. MW, molecular weight size marker; C−, negative control. Blue arrowheads point to the two different alternative splicing isoforms. The results are representative of two independent experiments. (C) Multiprotein sequence alignment of human (hAK2) and zebrafish (zAk2) AK2 splicing isoforms (indicated as ISOA and ISOB). Features of human AK2 structure are depicted above the amino acid sequences. Different colors indicate different physicochemical properties. (D) mRNA quantitative real-time PCR analysis showing the relative expression of AK2 splicing isoforms during embryo development using specific probes for isoforms A or B (ak2-A and ak2-B) or a common probe for A and B isoforms (ak2-AB). Expression levels were normalized to β-actin 2 (β-act 2) and elongation factor 1 α (ef1α), and mRNA from 2–5-somite stage embryos was used as reference. Error bars indicate the calculated maximum (RQmax) and minimum (RQmin) expression levels that represent the standard error of the mean expression level (RQ value). Data are pooled from at least three independent experiments. (E) Spatiotemporal analysis by stereomicroscopy of AK2 expression by WISH using a common probe for A and B isoforms at the indicated times. For each stage, at least 25 embryos have been analyzed. Data show one representative experiment out of two independently performed. ICM, intermediate cell mass; CHT, caudal hematopoietic tissue. Bars, 100 µm.
Figure 2.
Figure 2.
Zebrafish AK2 mutants present a wide array of hematopoietic defects. (A) Alignment of protein sequences encoded by the WT and ZFN-induced mutant alleles (del2 and ins4) shows the predicted frameshift after the Arg 15 codon targeted by the ZFN cutting site. Premature stop codons are also indicated (^). (B) 3D structure of human AK2 (left). (bottom) Partial sequence multi-alignment of WT (zAk2) and missense mutant zebrafish Ak2 (zAk2L124P/L124P) and human AK2 (hAK2). The mutated amino acid position is highlighted in both panels (red arrows). (right) Sequence chromatograms showing the nucleotide change for L124P missense mutation in heterozygous (ak2L124P/+) and homozygous (ak2L124P/L124P) embryos compared with the WT sequence. (C) Stereomicroscope images of WISH analysis on 24 hpf WT and mutant embryos using an antisense probe against ak2 mRNA (A and B transcripts). For each sample, at least 25 embryos have been analyzed. (D) Analysis of definitive hematopoietic phenotypes in ak2del2/del2 and ak2L124P/L124P mutants by WISH and stereomicroscopy. Red and black dashed circles indicate thymus and kidney regions, respectively. (left) Lateral views of embryos hybridized with rag1, mpx, and hbae1 and ventral views of ikaros hybridization at 5 dpf. Lateral views of embryos stained using Sudan black solution to mark granulocytes at 5 dpf. (right) Ventral views of rag1 and lateral views of mpx and hbae1 hybridized embryos at 5 dpf and lateral views of embryos stained using Sudan black solution at different stages of development. For each sample, at least 25 embryos have been analyzed. Data in C and D show one representative experiment out of two independently performed. Bars, 100 µm.
Figure 3.
Figure 3.
ak2 knockdown by MO injection phenocopies hematopoietic defects observed in ak2 zebrafish mutants. (A) Schematic representation of the two different MOs used in the study: ak2 MO1 blocking the mRNA translation and ak2 MO2 targeting the intron 3–exon 4 splice junction of the ak2 gene. Neither exons nor introns are drawn to scale. Numbers below the introns (straight lines) and exons (white boxes) indicate their size in bases. (B) Schematic representation of the predicted AK2 transcripts in MO-treated embryos. Black arrowheads in the bottom left panel indicate noncanonical STOP codons introduced by ak2 MO2–induced skipping of exon 4. Horizontal black arrows indicate the pair of primers used in RT-PCR (right panels) to test the effects of different doses of ak2 MO2 during development as indicated. MW, molecular weight size marker. (C) mRNA quantitative real-time PCR analysis of splicing MO activity (three different doses) at 28 hpf and 3 dpf. In both cases, ST-CTRL MO–injected embryos serve as reference. The error bars indicate the calculated maximum (RQmax) and minimum (RQmin) expression levels that represent the standard error of the mean expression levels (RQ value). (D–H) Qualitative and quantitative analysis of hematopoietic defects induced by ak2 MOs injection during definitive hematopoiesis assessed by WISH and stereomicroscopy. WT Ekkwill (EK) embryos were injected with different doses (4, 8, and 12 ng) of ak2 MO1 or ak2 MO2 (2.4 ng) and analyzed by WISH at different developmental stages using specific hematopoietic probes. ST-CTRL MO at the highest dose used for ak2 MO1 was used as a control. Numbers above bars indicate the total count of embryos analyzed. (D, left) Stereomicroscope lateral views of l-plastin (marker of macrophages and monocytes) and hbae1 WISH signals in ST-CTRL and ak2 MO1 morphants at 3 and 5 dpf. Black dashed circles indicate the position of the kidney. (right) Stereomicroscope ventral views of ST-CTRL MO, ak2 MO1 morphants, or ak2 MO1- and MO2-coinjected embryos hybridized with rag1 ISH probe to visualize differentiating lymphocytes in the thymus. For each sample, at least 25 embryos have been analyzed. Bars, 100 µm. (E) Effect of ak2 MO1 and ST-CTRL MO injection on the expression of l-plastin, hbae1, and rag1. (F) Effect of single ak2 MO injection and low dose coinjection on granulopoiesis (Sudan black stain). (G and H) Effect of single ak2 MO injection or low dose coinjection on the expression of c-myb and rag1 from 30 hpf to 5 dpf.. Data are presented as percentage of affected embryos. All data (B–H) show one representative experiment out of at least two independently performed.
Figure 4.
Figure 4.
AK2 deficiency impairs HSPC development in zebrafish. (A–C) Representative stereomicroscope images of WISH analyses of c-myb expression in ak2del2/del2 null mutants, ak2 morphants, and ak2L124P/L124P mutants. Red and black dashed circles mark thymus and kidney regions, respectively; open arrowheads indicate CHT regions. (A) Lateral views of right side of mutant embryos at different developmental stages compared with their WT siblings. White arrows mark insulin expression (positive control). (B) Lateral views of ST-CTRL MO and ak2 MO morphants at different developmental stages as indicated. Two different ak2 MOs (MO1 or MO2) were injected separately or in combination at low dose (MO1 + MO2 low doses). (C) Lateral views of the trunk/tail regions of ak2L124P/L124P mutant embryos at 3 and 5 dpf compared with their WT siblings. (D) Stereomicroscope images of WISH analysis of runx1 expression from 29 to 36 hpf in ak2del2 embryos from an intercross of heterozygous (ak2del2/+) adults (35, 32, and 26 embryos analyzed at 29, 32, and 36 hpf, respectively). (E) Analysis of vascular system development from 24 to 48 hpf in ak2del2 mutant embryos. (top) Stereomicroscope lateral views of WISH analysis with a cdh5 antisense probe on embryos from an intercross of heterozygous (ak2del2/+) adults (33, 29, 20, and 27 embryos analyzed at 24, 29, 32, and 36 hpf, respectively). (bottom) Confocal microscopy lateral views of the trunk/tail regions of ak2del2/del2 double transgenic Tg(fli1a:EGFP)y1;Tg(gata1a:dsRed)sd2 embryos and WT controls at different developmental stages; fli1a (EGFP) marks vascular development, and gata-1 (dsRed) marks red blood cells as indicated. (F) Stereomicroscope lateral views of trunk/tail region of 4.5 dpf Tg(cd41:GFP) embryos injected with different ak2 MOs. (G) Quantitative analysis of ak2 MO injections on Tg(cd41:GFP) embryos. Numbers above bars indicate the total number of embryos analyzed. Data are presented as percentage of affected embryos. For each panel (A–G), results of one representative experiment out of at least two independent replicates are shown. (A–F) For each sample at least, 20 embryos have been analyzed. Bars, 100 µm.
Figure 5.
Figure 5.
AK2 mutant zebrafish demonstrate increased levels of cellular oxidative stress and apoptosis in hematopoietic tissues. (A) Confocal microscopy assessment of oxidative stress in the CHT region of WT and ak2ins4/ins4 mutant embryos probed with the MitoSOX or CellROX indicators at the indicated stages. Yellow arrowheads in the dashed insets indicate MitoSOX- or CellROX-positive cells in CHT regions. (B) Representative quantitative analysis by flow cytometry of oxidative stress, apoptosis, and cell death on 5 dpf ak2del2/del2 and control embryos (60 embryos each) using MitoSOX Red and Annexin V + 7-AAD, respectively. (C and D) Quantitative analysis of MitoSOX Red (C) and CellROX Green (D) staining at 4 and 5 dpf in ak2del2/del2 mutants and WT siblings (60 embryos each). (E) WISH analysis of hmox1a expression in ak2del2/del2 mutants and their WT siblings at different stages of development. (F) WISH analysis of hmox1a expression in ak2L124P/L124P mutants and their WT siblings at different stages of development. (E and F) Open arrowheads indicate hmox1a-positive cells. (G) Stereomicroscope analysis of acridine orange staining of AK2 morphants at 3 dpf. Dashed insets show CHT regions. (H) Confocal analysis of fluorescent TUNEL staining in CHT regions of WT siblings and ak2del2/del2 and ak2L124P/L124P mutant embryos from 2 to 5 dpf. Each panel represents a crop of the CHT region from a 14× magnification image. The green signal indicates TUNEL-positive cells and the blue signal indicates DAPI staining. (A and E–H) For each sample, at least 25 embryos have been analyzed. Bars, 100 µm. (I) Quantitative analysis of TUNEL AP staining on WT siblings and ak2L124P/L124P missense mutant embryos from 3 to 5 dpf. The number of embryos analyzed is shown above each column. In panels C, D, and I, error bars indicate standard deviation; **, P < 0.01; ***, P < 0.001 for the indicated comparisons using an unpaired Student’s t test. Data in C and D are pooled from at least three independent experiments. Data in A, B, and E–I are representative of at least two independent experiments.
Figure 6.
Figure 6.
Antioxidant treatment induces rescue of hematopoietic phenotypes in AK2 zebrafish mutants. (A) Embryos from an incross of heterozygous ak2L124P mutants were treated with different doses of NAC (10, 20, or 50 µM) until 5 dpf when the expression of different markers was assessed by WISH. (left) Quantification of rescue induced by NAC treatment of ak2L124P missense mutants. Data are presented as the percentage of abnormal expression of each marker by WISH analysis at the indicated concentrations. The number of embryos analyzed is shown above each column. All observed differences compared with the untreated embryos are significant (P < 0.005, Z-test). (right) Representative stereomicroscopy images of tail regions of WT siblings and ak2L124P/L124P mutants untreated or treated with different doses of NAC. Black arrowheads indicate hmox1a-positive cells in CHT regions (boxed insets). (B) Lateral views of WT siblings and ak2del2/del2 mutants showing c-myb expression (WISH) in untreated and treated with 50 µM NAC embryos at 5 dpf. Red and black insets show thymus and kidney regions, respectively; white arrows mark insulin expression (positive control). (C) Lateral views of rag 1 expression (WISH) in thymic region of WT siblings, ak2del2/del2 mutants untreated and treated with increasing concentrations of NAC at 5 dpf. Black circles show thymic region in each sample. (A [right], B, and C) For each sample, at least 25 embryos have been analyzed. Bars, 100 µm. (D and E) Quantitative analysis of the effect of antioxidant treatment on c-myb (D) and rag1 (E) expression at 5 dpf in embryos from an incross of heterozygous ak2del2 mutants. Data are presented as the percentage of ak2del2/del2 null embryos. Numbers above columns indicate the total number of ak2del2/del2-null mutants found in each group of genotyped embryos. Data (A–E) are representative of at least two independent experiments.
Figure 7.
Figure 7.
Generation and characterization of human AK2R175Q/R175Q iPSCs. (A) Schematic representation of the annotated 3D structure of the human AK2 protein. The amino acid position mutated in patient-derived AK2R175Q/R175Q mutant fibroblasts and iPSC lines is highlighted in violet (yellow arrowhead). The amino acid position mutated in ak2L124P/L124P mutant zebrafish is marked in light blue (red arrowhead). (B) Partial sequence multi-alignment of the LID domain of zebrafish (zAk2) and human (hAK2) proteins and the human mutated form (hAK2R175Q/R175Q). Yellow arrowhead marks the amino acid position mutated in patient-derived cell lines. (C–F) iPSCs were generated from AK2-deficient dermal and control foreskin fibroblasts. (C) Representative confocal microscopy images showing the expression of human pluripotency markers (TRA-1-81 and SSEA3 [magenta], Oct4 and NANOG [red], and SSEA4 and TRA-1-60 [green]) using immunofluorescently labeled antibodies in AK2R175Q/R175Q iPSCs; cellular content is highlighted by nuclear staining with Hoechst 33342 (blue). Bars, 100 µm. (D) mRNA analysis using quantitative real-time PCR of the indicated pluripotency-associated genes in AK2R175Q/R175Q and control iPSCs. AK2R175Q/R175Q and control iPSCs gene expression was compared with the respective parental fibroblasts (Fib), and human β-actin gene expression (hACTB) was used as housekeeping gene. Error bars indicate standard error. (E) Karyotype and G-banding analysis of AK2R175Q/R175Q iPSCs. (F) Sequencing of the genomic region surrounding the mutation in the control and patient-derived AK2-mutated iPSC line. Data (C–F) are representative of at least two independent experiments.
Figure 8.
Figure 8.
AK2 deficiency affects in vitro granulopoiesis, erythropoiesis, and the adenine nucleotide profile of human myeloid cells. (A) Microscopic analysis of in vitro myeloid differentiation of AK2R175Q/R175Q and control iPSCs; black arrows indicate promyelocytes; red arrows indicate mature neutrophils. (B) Electron microscopy assessment of AK2R175Q/R175Q iPSC-derived myeloid precursors and control cells. Red arrowheads mark large electron-dense primary granules, and black arrows indicate glycogen storage in the cytoplasm (top). White arrowheads highlight pale secondary granules (bottom). (C) The number of myeloid colonies grown from 50k dissociated EB cells after 14 d of culture on methylcellulose was assessed (***, P < 0.001, χ2 test). Data represent the mean of three experiments, and error bars depict standard error. (D) In vitro erythroid differentiation of AK2R175Q/R175Q and control iPSCs was assessed by microscopy. Black arrows indicate incomplete nuclear separation. (A, B, and D) Data are representative of at least three independent experiments. Bars: (A, top) 100 µm; (A, middle) 20 µm; (A and D, bottom) 10 µm; (B) 2 µm; (D, top) 25 µm. (E) Number of red blood cell–forming colonies (BFU-E and CFU-E) grown from 50k dissociated EB cells after 14 d of culture on methylcellulose (***, P < 0.003, χ2 test). Data represent the mean of three independent experiments, and error bars depict standard error. (F) Quantification of cellular AMP and ADP content in AK2R175Q/R175Q iPSC-derived myeloid cells and control myeloid cells by tandem mass spectrometry. Data are representative of three independent experiments. iPSCs generated from a human foreskin fibroblast line were used as WT control in all experiments (A–F).
Figure 9.
Figure 9.
Antioxidant treatment rescues myeloid differentiation of human AK2R175Q/R175Q iPSCs. (A) Microscopy analysis of in vitro myeloid maturation of AK2R175Q/R175Q iPSCs in the presence of different concentrations of the antioxidant agent GSH in the culture medium as indicated. Data are representative of at least three independent experiments. (B) Maturation stage–specific comparison of GSH-treated and untreated AK2R175Q/R175Q myeloid lineage cells versus control. Data are presented as the percent fraction of total myeloid cells and represent the mean of three experiments. Error bars depict standard error (***, P < 0.0001, χ2 test). iPSCs generated from a human foreskin fibroblast line were used as WT control. (C) Microscopy analysis of in vitro myeloid maturation of AK2R175Q/R175Q iPSCs in the presence of 25 ng/ml G-CSF, 1 µM ATRA, or 3 mM GSH. Magnified images of boxed areas are presented in the right panels. Data are representative of at least two independent experiments. Bars: (A and C, left) 100 µm; (A and C, right) 10 µm.

Comment in

References

    1. Al-Zahrani D., Al-Ghonaium A., Al-Mousa H., Al-Kassar A., and Roifman C.M.. 2013. Skeletal abnormalities and successful hematopoietic stem cell transplantation in patients with reticular dysgenesis. J. Allergy Clin. Immunol. 132:993–996. 10.1016/j.jaci.2013.04.055 - DOI - PubMed
    1. Aloj G., Giardino G., Valentino L., Maio F., Gallo V., Esposito T., Naddei R., Cirillo E., and Pignata C.. 2012. Severe combined immunodeficiences: new and old scenarios. Int. Rev. Immunol. 31:43–65. 10.3109/08830185.2011.644607 - DOI - PubMed
    1. Antoine C., Müller S., Cant A., Cavazzana-Calvo M., Veys P., Vossen J., Fasth A., Heilmann C., Wulffraat N., Seger R., et al. . European Society for Immunodeficiency. 2003. Long-term survival and transplantation of haemopoietic stem cells for immunodeficiencies: report of the European experience 1968-99. Lancet. 361:553–560. 10.1016/S0140-6736(03)12513-5 - DOI - PubMed
    1. Argenton F., Giudici S., Deflorian G., Cimbro S., Cotelli F., and Beltrame M.. 2004. Ectopic expression and knockdown of a zebrafish sox21 reveal its role as a transcriptional repressor in early development. Mech. Dev. 121:131–142. 10.1016/j.mod.2004.01.001 - DOI - PubMed
    1. Bandlow W., Strobel G., Zoglowek C., Oechsner U., and Magdolen V.. 1988. Yeast adenylate kinase is active simultaneously in mitochondria and cytoplasm and is required for non-fermentative growth. Eur. J. Biochem. 178:451–457. 10.1111/j.1432-1033.1988.tb14469.x - DOI - PubMed

Publication types

MeSH terms

Supplementary concepts