. 2015 Jul 21;112(29):9034-9.
doi: 10.1073/pnas.1501032112. Epub 2015 Jul 6.

In vitro modeling of hyperpigmentation associated to neurofibromatosis type 1 using melanocytes derived from human embryonic stem cells

Affiliations

In vitro modeling of hyperpigmentation associated to neurofibromatosis type 1 using melanocytes derived from human embryonic stem cells

Jennifer Allouche et al. Proc Natl Acad Sci U S A. .

Abstract

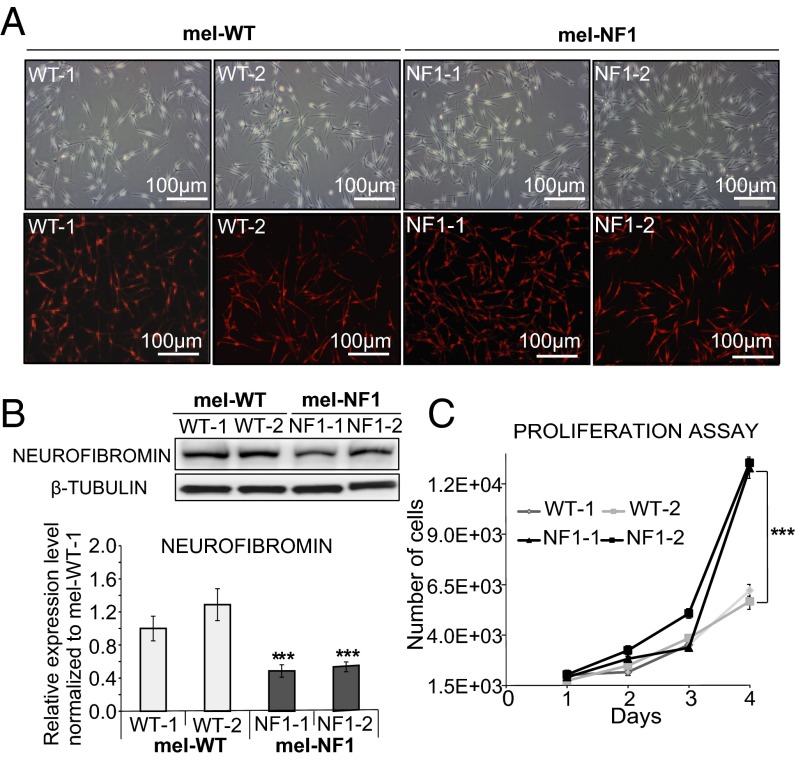
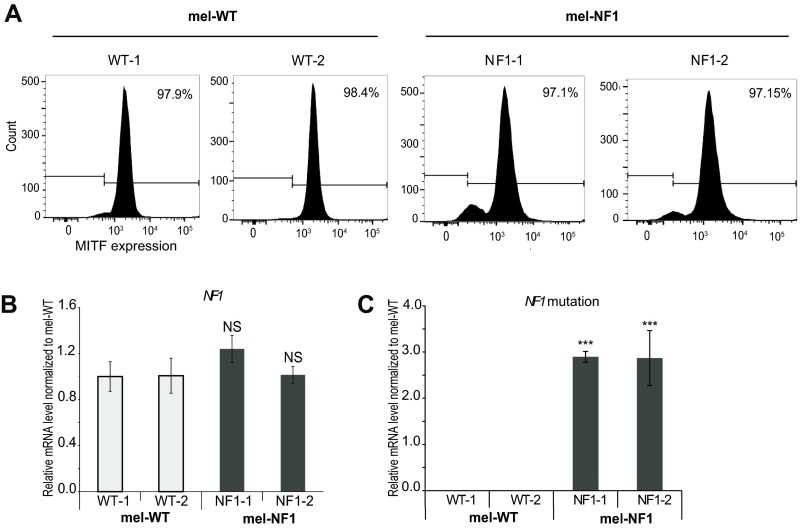
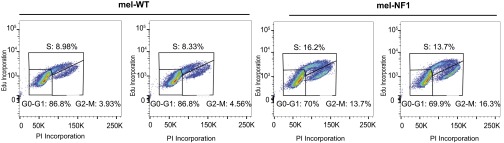
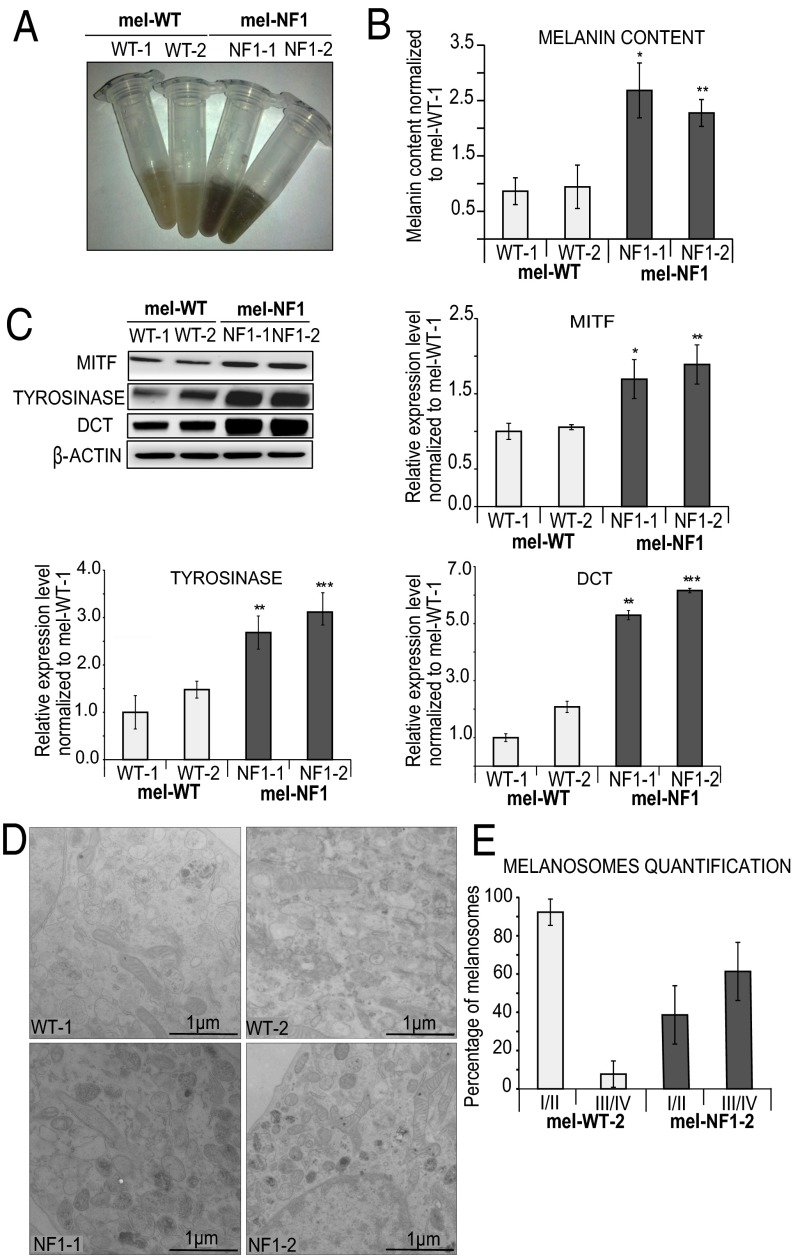
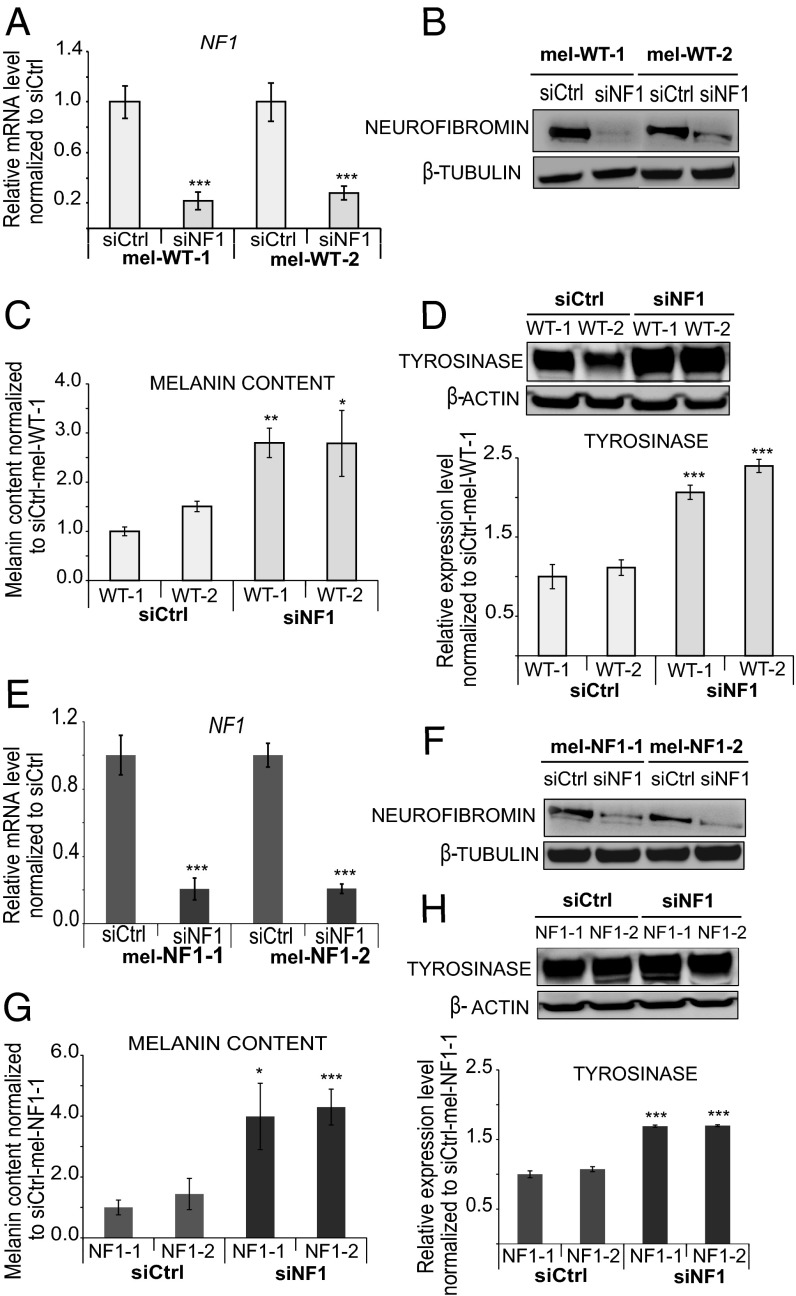
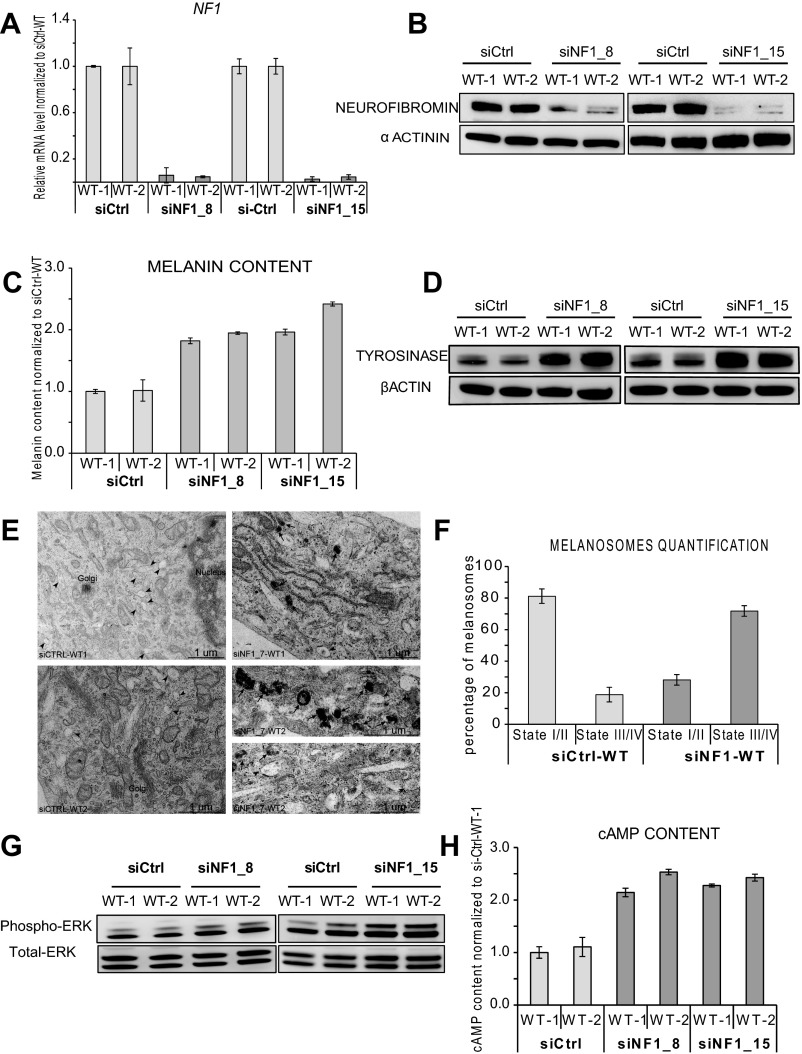
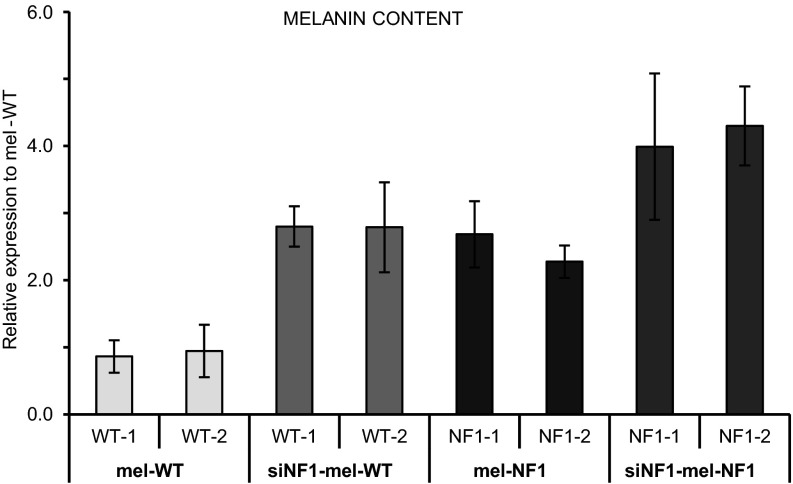
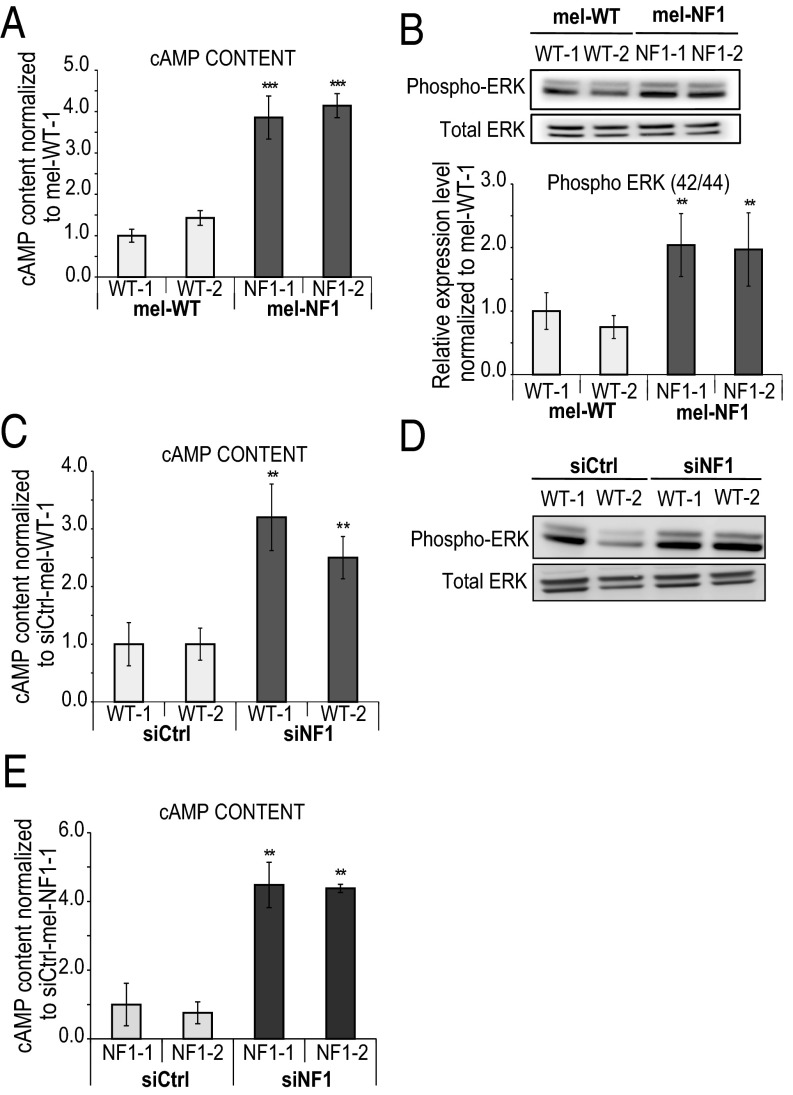
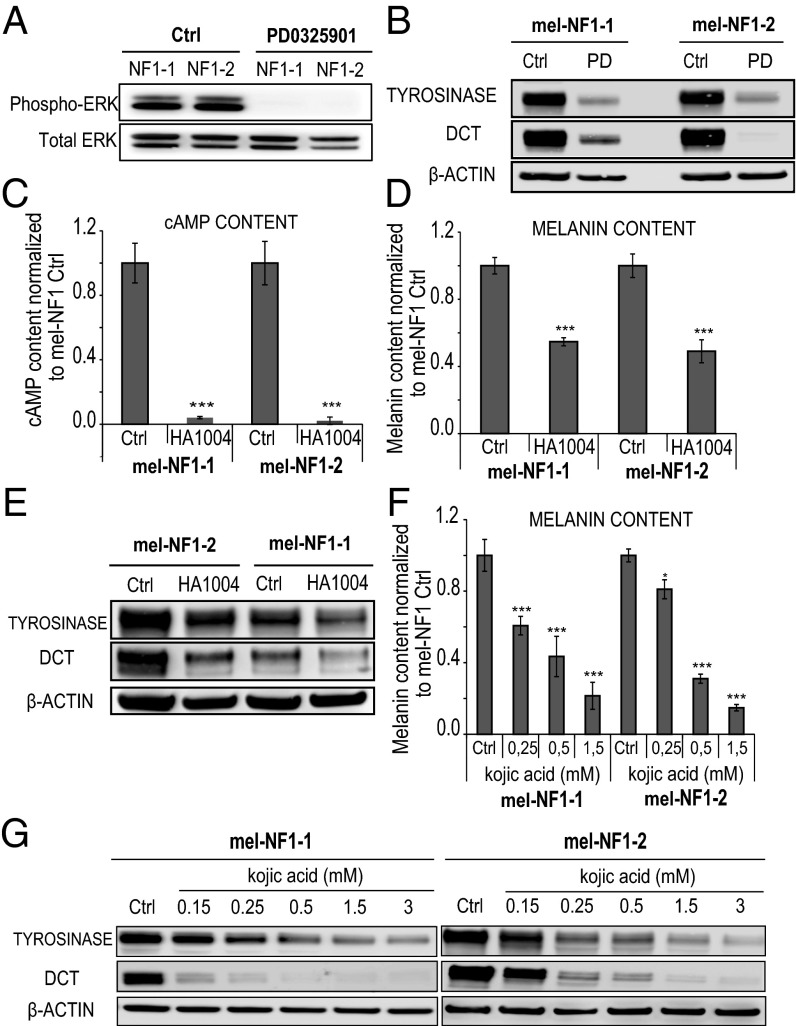
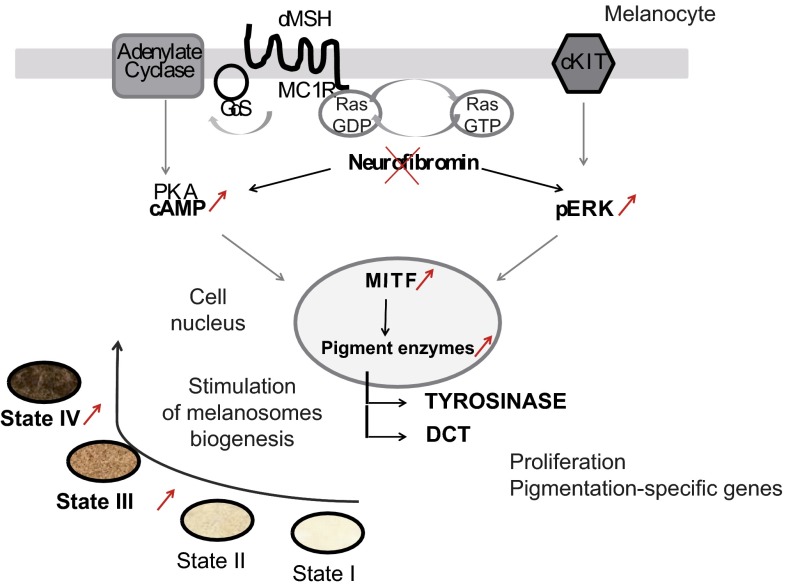
"Café-au-lait" macules (CALMs) and overall skin hyperpigmentation are early hallmarks of neurofibromatosis type 1 (NF1). One of the most frequent monogenic diseases, NF1 has subsequently been characterized with numerous benign Schwann cell-derived tumors. It is well established that neurofibromin, the NF1 gene product, is an antioncogene that down-regulates the RAS oncogene. In contrast, the molecular mechanisms associated with alteration of skin pigmentation have remained elusive. We have reassessed this issue by differentiating human embryonic stem cells into melanocytes. In the present study, we demonstrate that NF1 melanocytes reproduce the hyperpigmentation phenotype in vitro, and further characterize the link between loss of heterozygosity and the typical CALMs that appear over the general hyperpigmentation. Molecular mechanisms associated with these pathological phenotypes correlate with an increased activity of cAMP-mediated PKA and ERK1/2 signaling pathways, leading to overexpression of the transcription factor MITF and of the melanogenic enzymes tyrosinase and dopachrome tautomerase, all major players in melanogenesis. Finally, the hyperpigmentation phenotype can be rescued using specific inhibitors of these signaling pathways. These results open avenues for deciphering the pathological mechanisms involved in pigmentation diseases, and provide a robust assay for the development of new strategies for treating these diseases.

Keywords: disease modeling; embryonic stem cells; hyperpigmentation; melanocytes; neurofibromatosis type 1.


Conflict of interest statement

The authors declare no conflict of interest.

Figures

Fig. 1.
Fig. 1.
Characterization of mel-NF1 cells derived from hESCs carrying an NF1 mutation. (A) Microscopy analysis of mel-WT and mel-NF1 cells, and immunofluorescence analysis of the melanocyte marker TYRP1 in mel-WT and mel-NF1 cells. (Scale bar: 100 μm.) (B) Western blot analysis of neurofibromin expression in mel-WT and mel-NF1 cells. β-tubulin served as a loading control. Densitometry measurement of protein levels was relative to control mel-WT-1 cells. Data are presented as mean ± SD (n = 3) normalized to the expression in WT-1 cells. (C) Automated quantification at different time points after plating of DAPI nuclear staining in mel-WT and mel-NF1 cells. Results are expressed as mean ± SD (n = 3). ***P < 0.001, ANOVA followed by Dunnett’s multiple-comparison test with WT-1.
Fig. S1.
Fig. S1.
Characterization of mel-NF1 cells. (A) Flow cytometry analysis of the melanocyte marker MITF in mel-WT-1 and WT-2 and mel-NF1-1 and NF1-2 cells. (B) qRT-PCR analysis of NF1 mRNA expression in mel-WT-1 and WT-2 and mel-NF1-1 and NF1-2 cells. qRT-PCR results are presented as fold change relative to mel-WT-1 cells after normalization against housekeeping gene 18S (n = 3). (C) Taqman qPCR of mutated probe (without four nucleotides) vs. WT probe in mel-WT-1 and WT-2 and mel-NF1-1 and NF1-2 cells. qRT-PCR results are presented as fold change relative to mel-WT-1 cells (n = 3). NS, not significant. ***P < 0.001, ANOVA followed by Dunnett’s multiple-comparison test with mel-WT-1 cells.
Fig. S2.
Fig. S2.
Increased proliferation rate of mel-NF1 cells derived from hESCs carrying the NF1 mutation. Shown is a representative image of cell cycle progression after EdU incorporation in mel-WT and mel-NF1 cells by flow cytometry analysis. Annotations indicate distribution of cells in G0/G1, S, G2, and M phases (15,000 events total).
Fig. 2.
Fig. 2.
Phenotypic changes in melanocytes associated with NF1 mutation. (A) Representative cell lysates from mel-WT and mel-NF1 cells. (B) Quantification of melanin cell content by spectrophotometry in mel-WT and mel-NF1 cells. Measurements were performed using 105 cells of each cell type. Results are expressed as mean ± SD (n = 3). (C) Western blot analysis of MITF, tyrosinase, and DCT expression in mel-WT and mel-NF1 cells. β-actin served as a loading control. Densitometry measurement of protein levels is presented as mean ± SD (n = 3) normalized to the expression in WT-1 cells. (D) Representative EM images of melanosome stages in mel-WT and mel-NF1 cells. Characteristic immature unpigmented (stage I/II) and mature pigmented (stage III/IV) melanosomes are observed in the soma of melanocytes. (Scale bar: 1 µm.) (E) Quantification of melanosome maturation in mel-WT-2 and mel-NF1-2 cell lines. Data are presented as mean ± SD (n = 100 stages of melanosomes). *P < 0.05, **P < 0.01, ***P < 0.001, ANOVA followed by Dunnett’s multiple-comparison test with WT-1 cells.
Fig. 3.
Fig. 3.
Neurofibromin depletion with siRNA in mel-WT and mel-NF1 cells. (A) qRT-PCR analysis of NF1 transcript expression in mel-WT-1 and mel-WT-2 cells transfected with either siRNA targeting NF1 (siNF1) or control siRNA (siCtrl). qRT-PCR levels are presented as fold change relative to siCtrl-mel-WT cells. Results are expressed as mean ± SD (n = 3). (B) Western blot analysis of neurofibromin expression in mel-WT-1 and mel-WT-2 cells transfected with siNF1 or siCtrl. β-tubulin served as a loading control (n = 1). (C) Melanin content in siCtrl-mel-WT-1 and WT-2 and siNF1-mel-WT-1 and WT-2 cells. Measurements were performed using 105 cells of each cell type. Data are presented as mean ± SD (n = 3) normalized to the expression in siCtrl-mel-WT-1 cells. (D) Western blot analysis of tyrosinase expression in siNF1-mel-WT-1 and WT-2 and siCtrl-mel-WT-1 and WT-2 cells. β actin served as a loading control. Densitometry measurement of protein levels was relative to siCtrl-mel-WT-1 cells. Results are expressed as mean ± SD (n = 3). (E) qRT-PCR analysis of NF1 transcript expression in mel-NF1-1 and NF1-2 cells transfected with siNF1 and siCtrl. qRT-PCR values are presented as fold change relative to siCtrl-mel-NF1 cells. Results are expressed as mean ± SD (n = 3). (F) Western blot analysis of neurofibromin expression in mel-NF1-1 and mel-NF1-2 cells transfected with siCtrl or siNF1. β-tubulin served as a loading control (n = 1). (G) Melanin content in siCtrl-mel-NF1-1 and NF1-2 and siNF1-mel-NF1-1 and NF1-2 cells. Measurements were performed using 105 cells of each cell type. The results are expressed as a relative level normalized to siCtrl-mel-NF1-1 cells. Data are presented as mean ± SD (n = 3). (H) Western blot analysis of tyrosinase expression in siCtrl-mel-NF1and siNF1-mel-NF1 cells. β-actin served as a loading control. Results are expressed as mean ± SD (n = 3), *P < 0.05, **P < 0.01, ***P < 0.001, ANOVA followed by Dunnett’s multiple-comparison test with siCtrl-mel-WT cells (A, C, and D) or siCtrl-mel-NF1-1 cells (E, G, and H).
Fig. S3.
Fig. S3.
Neurofibromin depletion with siRNA (siNF1_8; siNF1_15) in mel-WT cells. (A) qRT-PCR analysis of NF1 transcript expression in mel-WT-1 and mel-WT-2 cells transfected with either siRNA targeting different domains of NF1 (siNF1_8 and siNF1_15) or siCtrl. qRT-PCR results are presented as fold change relative to siCtrl-mel-WT cells after normalization against housekeeping gene 18S. Results are expressed as mean ± SD. (B) Western blot analysis of neurofibromin expression in mel-WT-1 and mel-WT-2 cells transfected with siNF1_8, siNF1_15 or siCtrl. α-actinin served as a loading control. (C) Melanin content in siCtrl-mel-WT-1 and WT-2 and mel-WT-1 and WT-2 cells transfected with siNF1_8 and siNF1_15. Measurements were performed using 105 cells of each cell type. Data are presented as mean ± SD normalized to the expression in siCtrl-mel-WT-1 cells. (D) Western blot analysis of tyrosinase expression in mel-WT-1 and WT-2 cells transfected with in siNF1_8, siNF1_15 and siCtrl-mel-WT-1 and WT-2 cells. β-actin served as a loading control. (E) Representative EM images of melanosome maturation in mel-WT cells transfected with siNF1 (siNF1_7) and siCtrl-mel-WT. Characteristic immature (stage I/II) and mature (stage III/IV) melanosomes are observed in the soma of melanocytes. (Scale bar: 1 µm.) (F) Quantification of melanosome maturation in siNF1-mel-WT and siCtrl-mel-WT cell lines. Data are presented as mean ± SD (n = 100 stages of melanosomes). (G) Western blot analysis of Phospho-p44/42 ERK1/2 in siCtrl-mel-WT-1 and WT-2 and mel-WT-1 and WT-2 cells transfected with siNF1_8 and siNF1_15. Total ERK served as a control. (H) Direct ELISA analysis of cAMP content in siCtrl-mel-WT-1 and Wt-2 and siNF1_8 and siNF1_15-mel-WT-1 and WT-2 cells. Measurements were performed using 105 cells of each cell type. Results were normalized to siCtrl-mel-WT-1 and are expressed as mean ± SD.
Fig. S4.
Fig. S4.
Proliferation rate after neurofibromin depletion. (A) Automated quantification at different time points after plating of DAPI nuclear staining in siCtrl-mel-WT and siNF1-mel-WT cells. (B) Cell cycle progression after EdU incorporation in siCtrl-mel-WT and siNF1-mel-WT cells (siNF1_7, siNF1_8, siNF1_15) by flow cytometry analysis. Annotations indicate distribution of cells in G0/G1, S, G2, and M phases (15,000 events total). (C) Automated quantification at different time points after plating of DAPI nuclear staining in siCtrl-mel-NF1 and siNF1-mel-NF1 cells.
Fig. S5.
Fig. S5.
Comparative analysis of melanin content in the function of neurofibromin expression. Shown is a compiled representation of melanin content in mel-WT-1 and WT-2, siNF1-mel-WT-1 and WT-2, mel-NF1-1 and NF1-2, and siNF1-mel-NF1-1 and NF1-2 cells. Measurements were performed using 105 cells of each cell type. Results were normalized to mel-WT-1 control and are expressed as mean ± SD (n = 3).
Fig. 4.
Fig. 4.
Impact of neurofibromin expression in cAMP and ERK1/2 signaling pathways in melanocytes. (A) Direct ELISA analysis of cAMP content in mel-WT and mel-NF1 cells. Results are expressed as mean ± SD (n = 3). Measurements were performed using 105 cells of each cell type. The results were normalized to siCtrl-mel-WT-1 cells. (B) (Upper) Western blot analysis of Phospho-p44/42 MAPK (ERK1/2) in mel-NF1 cells compared with mel-WT cells. Total ERK served as a control. (Lower) Densitometry measurement of protein levels relative to control mel-WT-1 cells. Results are expressed as mean ± SD (n = 3). (C) Direct ELISA analysis of cAMP content in siCtrl-mel WT-1 and WT-2 and siNF1-mel WT-1 and WT-2 cells. Measurements were performed using 105 cells of each cell type. Results were normalized to siCtrl-mel WT-1 cells and are presented as mean ± SD (n = 3). (D) Western blot analysis of Phospho-p44/42 ERK1/2 in siCtrl-mel WT-1 and WT-2 and siNF1-mel WT-1 and WT-2 cells. Total ERK served as a control (n = 1). (E) Direct ELISA analysis of cAMP content in siCtrl-mel NF1-1 and NF1-2 and siNF1-mel NF1-1 and NF1-2 cells. Measurements were performed using 105 cells of each cell type. The results were normalized to siCtrl-mel NF1-1. Results are expressed as mean ± SD (n = 3). **P < 0.01, ***P < 0.001, ANOVA followed by Dunnett’s multiple-comparison test compared with WT-1 (A and B), siCtrl-mel WT-1 (C), or siCtrl-mel NF1-1 (E).
Fig. 5.
Fig. 5.
Effects in mel-NF1 cells of specific inhibitors targeting downstream signaling pathways of neurofibromin on melanogenesis. (A) Western blot analysis of phospho-p44/42 MAPK (ERK1/2) after PD0325901 treatment in mel-NF1-1 and NF1-2 cells. Total ERK served as a control (n = 2). (B) Western blot analysis of tyrosinase and DCT expression after PD0325901 treatment in mel-NF1-1 and NF1-2 cells. β-actin served as a loading control (n = 2). (C) Direct ELISA analysis of cAMP content in mel-NF1-1 and NF1-2 cells after HA1004 treatment. Measurements were performed using 105 cells of each cell type. Results were normalized to mel-NF1 control and are expressed as mean ± SD (n = 3). (D) Melanin content in mel-NF1-1 and NF1-2 cells after HA1004 treatment. Measurements were performed using 105 cells of each cell type. Results were normalized to mel-NF1 control and are expressed as mean ± SD (n = 3). (E) Western blot analysis of tyrosinase and DCT expression after HA1004 treatment in mel-NF1-1 and NF1-2 cells. β actin served as a loading control. (F) Melanin content after treatment of mel-NF1-1 and mel-NF1-2 cells with various concentrations of kojic acid. Results are expressed as mean ± SD (n = 3). (G) Western blot analysis of tyrosinase and DCT expression after treatment with various concentrations of kojic acid in mel-NF1-1 and mel-NF1-2 cells. β-actin served as a loading control (n = 1). *P < 0.05, ***P < 0.001, ANOVA followed by Dunnett’s multiple-comparison test with NF1-1 control or NF1-2 control cells (C, D, and F).
Fig. S6.
Fig. S6.
Schematic representation of melanocyte hyperpigmentation in the NF1 disease model.

Comment in

  • What's up NF1?
    Grill C, Larue L. Grill C, et al. Pigment Cell Melanoma Res. 2016 Jan;29(1):4-5. doi: 10.1111/pcmr.12423. Epub 2015 Nov 3. Pigment Cell Melanoma Res. 2016. PMID: 26394792 No abstract available.

References

    1. Trovó-Marqui AB, Tajara EH. Neurofibromin: A general outlook. Clin Genet. 2006;70(1):1–13. - PubMed
    1. Maertens O, et al. Molecular dissection of isolated disease features in mosaic neurofibromatosis type 1. Am J Hum Genet. 2007;81(2):243–251. - PMC - PubMed
    1. De Schepper S, Boucneau J, Lambert J, Messiaen L, Naeyaert J-M. Pigment cell-related manifestations in neurofibromatosis type 1: An overview. Pigment Cell Res. 2005;18(1):13–24. - PubMed
    1. Gutmann DH, et al. The diagnostic evaluation and multidisciplinary management of neurofibromatosis 1 and neurofibromatosis 2. JAMA. 1997;278(1):51–57. - PubMed
    1. Wolkenstein P, Zeller J, Revuz J, Ecosse E, Leplège A. Quality-of-life impairment in neurofibromatosis type 1: A cross-sectional study of 128 cases. Arch Dermatol. 2001;137(11):1421–1425. - PubMed

Publication types