. 2015 Aug 11;112(32):10044-9.
doi: 10.1073/pnas.1511570112. Epub 2015 Jul 6.

Chloroplasts extend stromules independently and in response to internal redox signals

Affiliations

Chloroplasts extend stromules independently and in response to internal redox signals

Jacob O Brunkard et al. Proc Natl Acad Sci U S A. .

Abstract

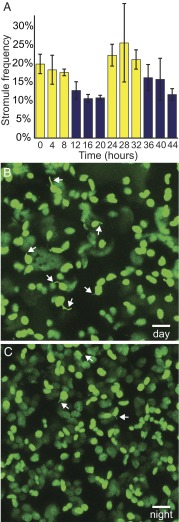
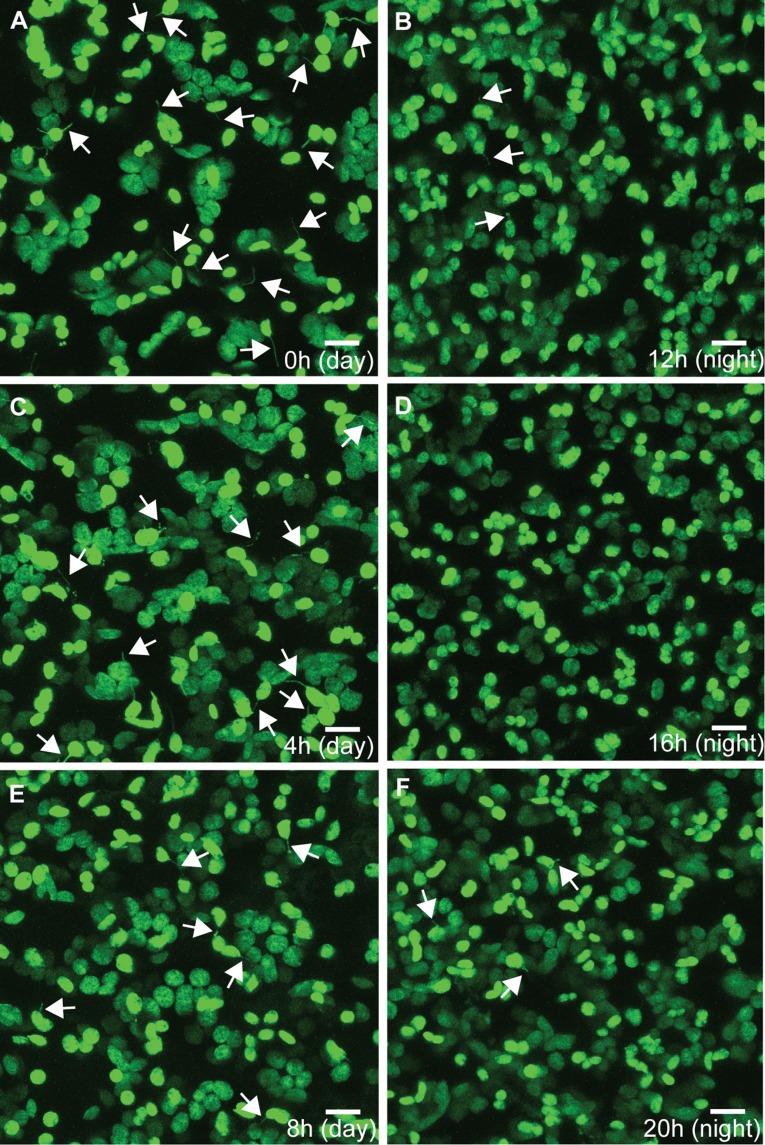
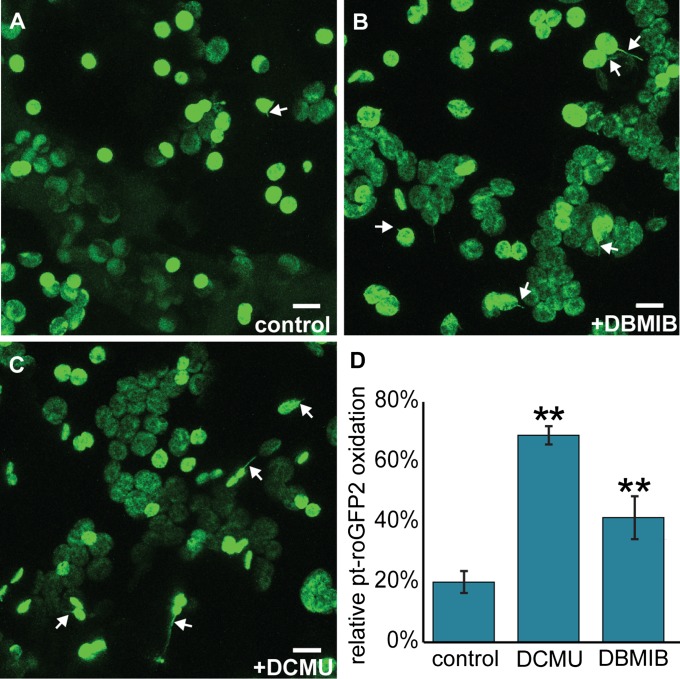
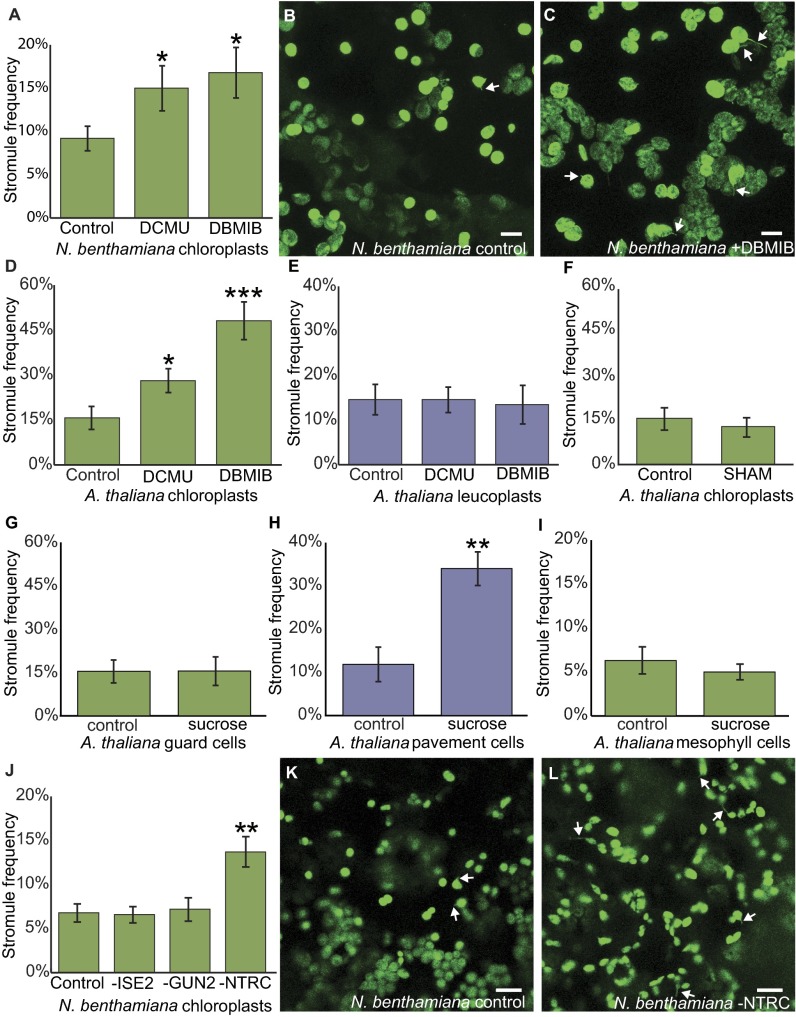
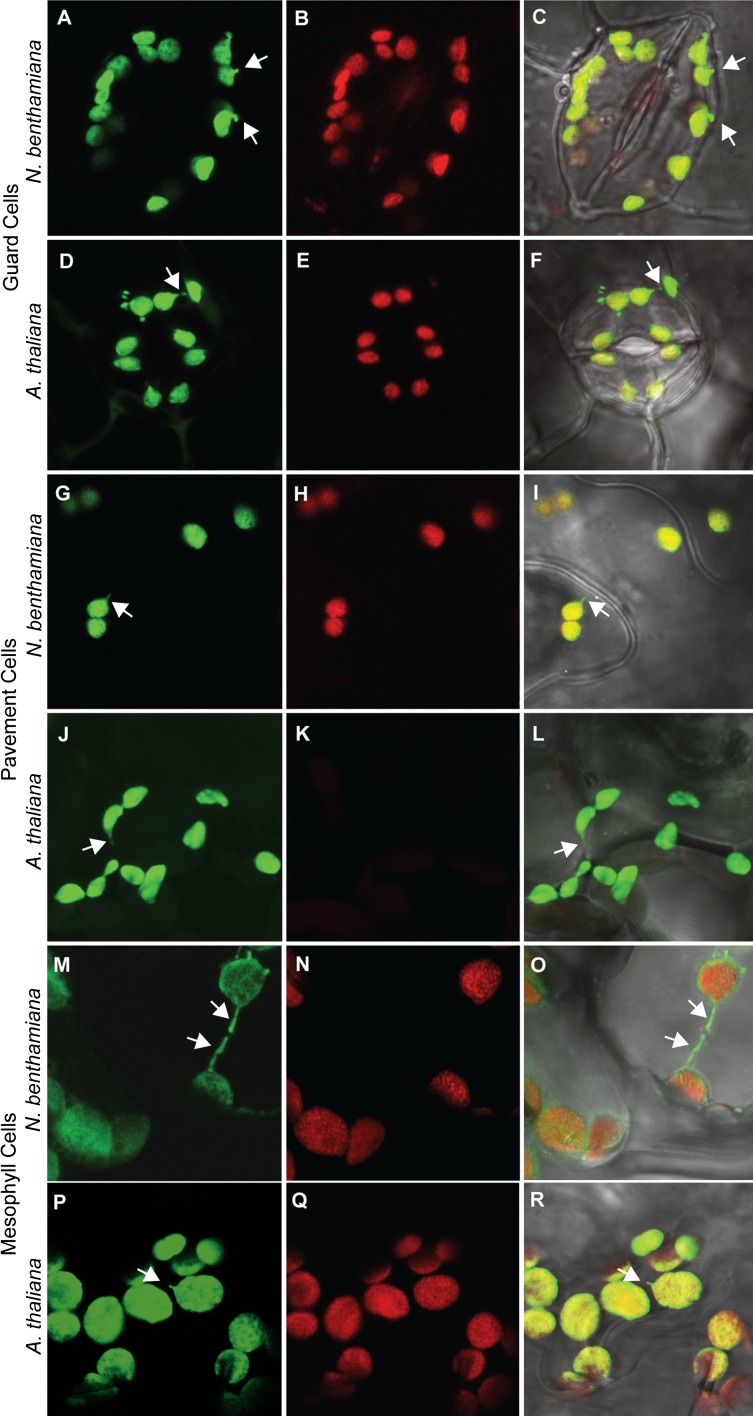
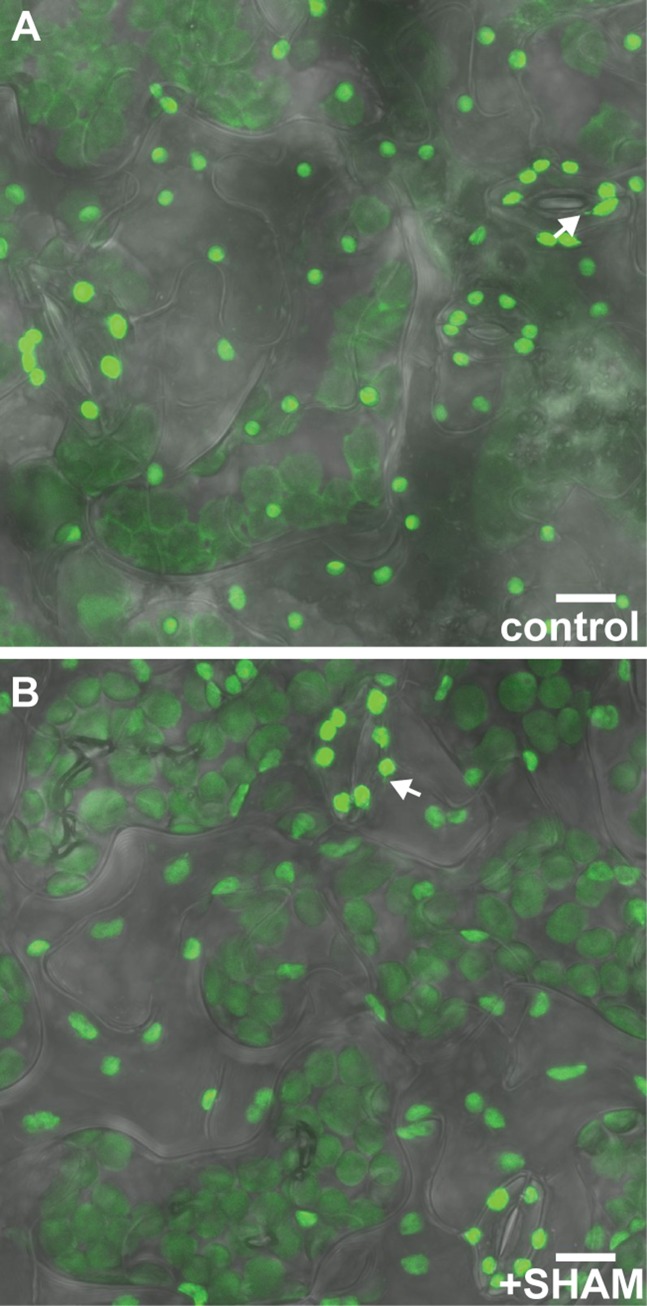
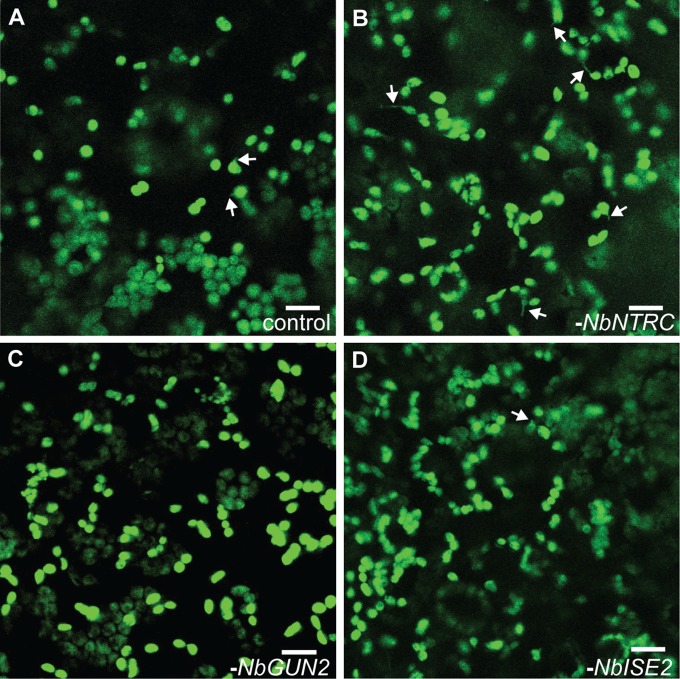
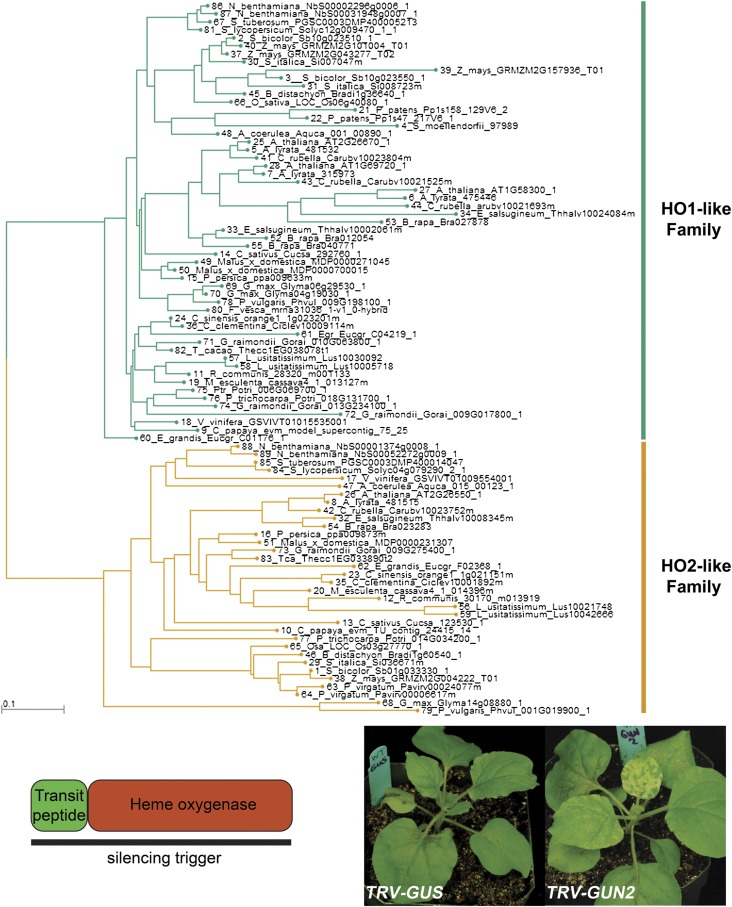
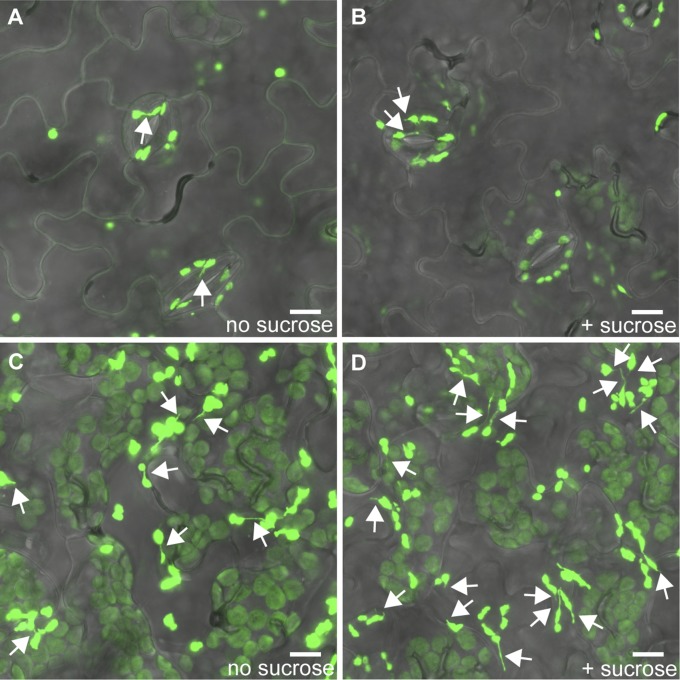
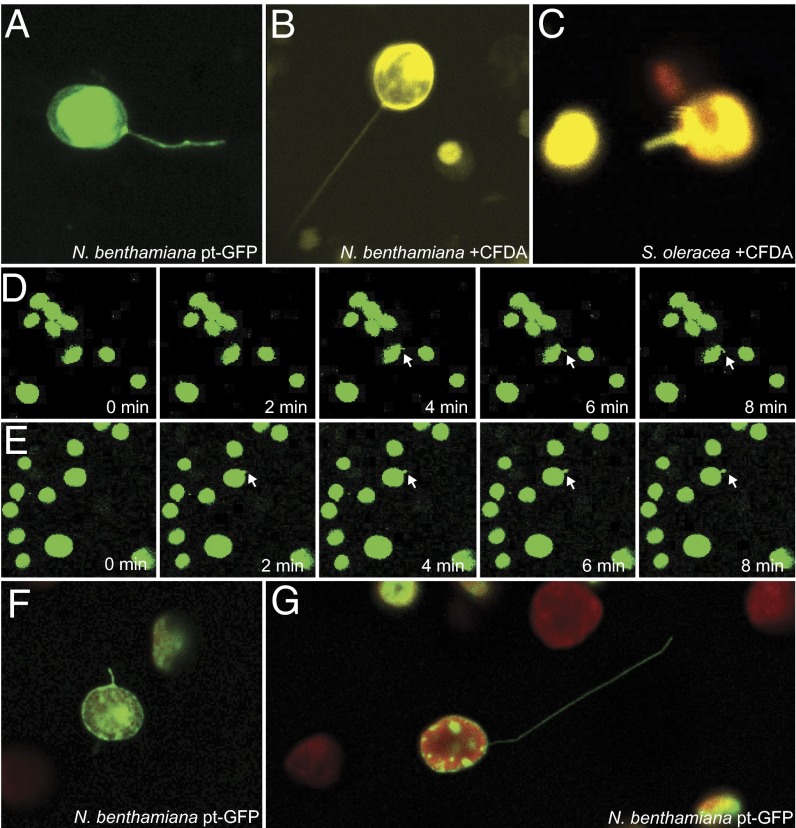
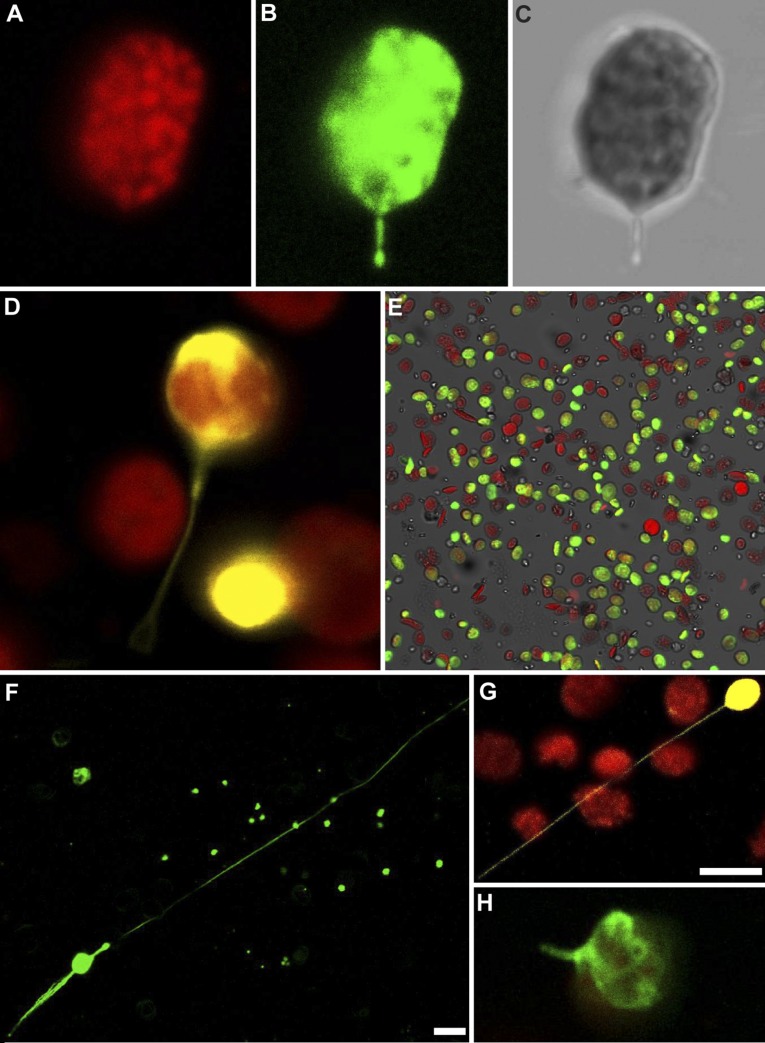
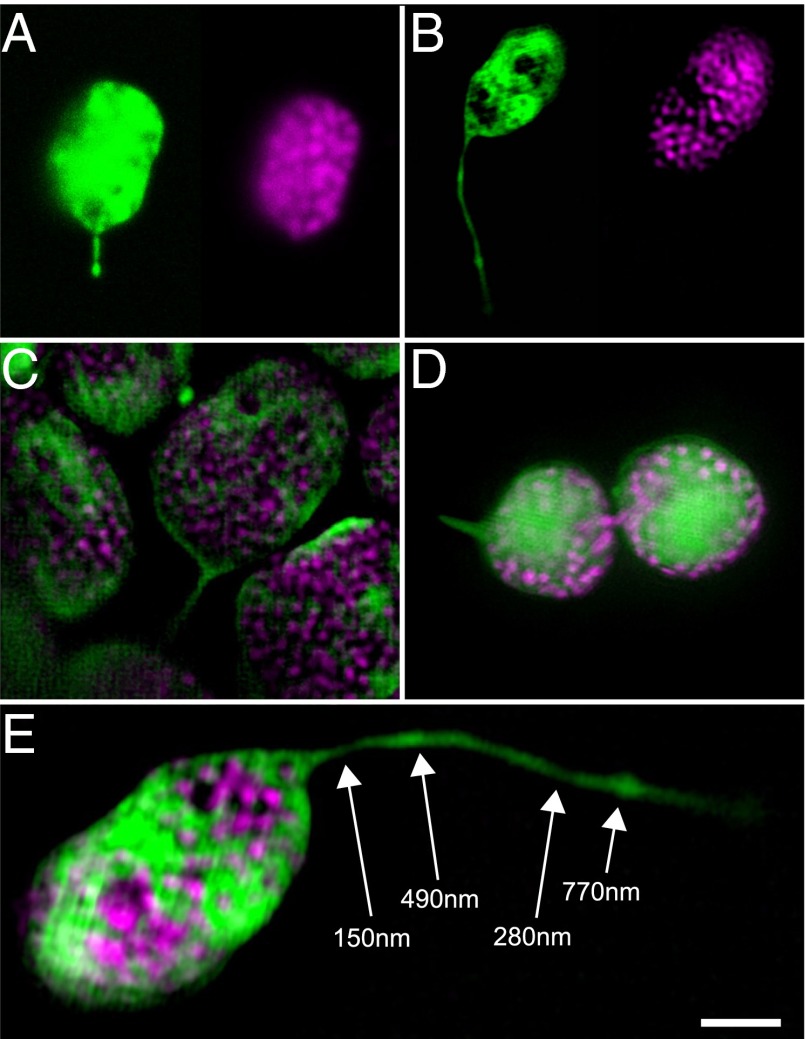
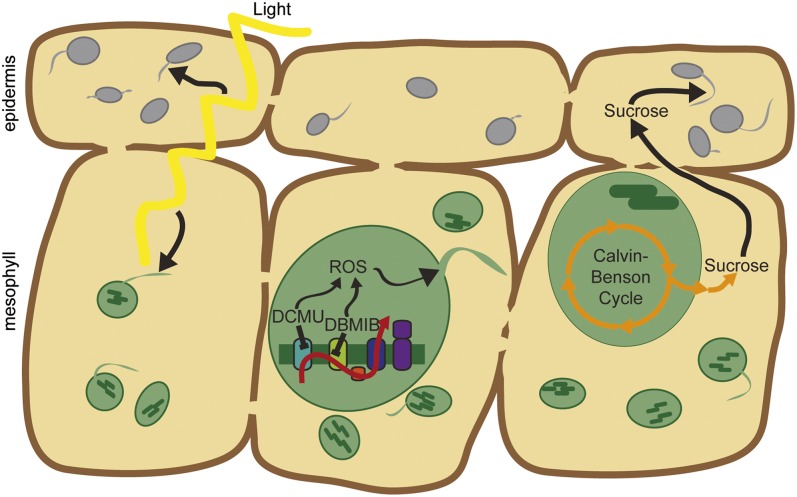
A fundamental mystery of plant cell biology is the occurrence of "stromules," stroma-filled tubular extensions from plastids (such as chloroplasts) that are universally observed in plants but whose functions are, in effect, completely unknown. One prevalent hypothesis is that stromules exchange signals or metabolites between plastids and other subcellular compartments, and that stromules are induced during stress. Until now, no signaling mechanisms originating within the plastid have been identified that regulate stromule activity, a critical missing link in this hypothesis. Using confocal and superresolution 3D microscopy, we have shown that stromules form in response to light-sensitive redox signals within the chloroplast. Stromule frequency increased during the day or after treatment with chemicals that produce reactive oxygen species specifically in the chloroplast. Silencing expression of the chloroplast NADPH-dependent thioredoxin reductase, a central hub in chloroplast redox signaling pathways, increased chloroplast stromule frequency, whereas silencing expression of nuclear genes related to plastid genome expression and tetrapyrrole biosynthesis had no impact on stromules. Leucoplasts, which are not photosynthetic, also made more stromules in the daytime. Leucoplasts did not respond to the same redox signaling pathway but instead increased stromule formation when exposed to sucrose, a major product of photosynthesis, although sucrose has no impact on chloroplast stromule frequency. Thus, different types of plastids make stromules in response to distinct signals. Finally, isolated chloroplasts could make stromules independently after extraction from the cytoplasm, suggesting that chloroplast-associated factors are sufficient to generate stromules. These discoveries demonstrate that chloroplasts are remarkably autonomous organelles that alter their stromule frequency in reaction to internal signal transduction pathways.

Keywords: chloroplasts; leucoplasts; light signaling; redox signaling; stromules.


Conflict of interest statement

The authors declare no conflict of interest.

Figures

Fig. 1.
Fig. 1.
Chloroplast stromule frequency varies with diurnal cycles. (A) Stromule frequency rises in the day (yellow bars) and decreases at night (blue bars) in chloroplasts of N. benthamiana seedlings (n ≥ 22, P < 0.0005). (B and C) Representative images of N. benthamiana epidermal chloroplasts labeled with stromal GFP (green) in the day (B) and at night (C). Some stromules are indicated by white arrows. As a visual aid, here and in other figures; not all stromules are indicated, and the indicated stromules were selected at random. Error bars indicate SE. (Scale bars: 10 μm.)
Fig. S1.
Fig. S1.
Representative images of stromule frequency over the course of 48 h during a 12-h light/12-h dark cycle. N. benthamiana chloroplast stromule frequency is high throughout the day (A, dawn; C, 4 h after dawn; E, 8 h after dawn) and low throughout the night (B, dusk; D, 4 h after dusk; F, 8 h after dusk). Chloroplasts and stromules are labeled with stromal GFP. Some stromules are indicated by white arrows. (Scale bars: 10 μm.)
Fig. S2.
Fig. S2.
Oxidation of stromal redox buffers by ROS from photosynthesis induces stromules in chloroplasts. (A–C) Representative images of stromule formation with control (A), DBMIB (B), and DCMU (C) treatments in N. benthamiana chloroplasts. (D) Both DBMIB and DCMU cause strong oxidation of chloroplast redox buffers, as measured by pt-roGFP2 in A. thaliana cotyledons. n ≥28. **P < 0.01. Chloroplasts and stromules are labeled with stromal GFP. Some stromules are indicated by white arrows. Error bars indicate SE. (Scale bars: 10 μm.)
Fig. 2.
Fig. 2.
ROS in the chloroplast induce stromules. (A) DCMU and DBMIB treatments both increase stromule frequency in chloroplasts of N. benthamiana seedlings (n ≥ 20, P < 0.05). (B and C) Representative images of N. benthamiana chloroplasts treated with control (B) or with DBMIB (C). (D) A. thaliana epidermal chloroplast stromule frequency increases after DCMU or DBMIB treatment (DCMU, n ≥ 16, P < 0.05; DBMIB, n ≥ 10, P < 0.0005). (E) Stromule frequency in A. thaliana epidermal leucoplasts is unaffected by DCMU or DBMIB treatment (DCMU, n ≥ 16, P = 0.98; DBMIB, n ≥ 10, P = 0.84). (F) A. thaliana epidermal chloroplast stromule frequency is unaffected by SHAM (n ≥ 13, P = 0.57). (G) A. thaliana epidermal chloroplast frequency is similar in chloroplasts with or without sucrose treatment (n ≥ 8, P = 0.96). (H) A. thaliana epidermal leucoplast stromule frequency increases after sucrose treatment (n ≥ 8, P < 0.01). (I) Stromule frequency is not affected by sucrose treatment in A. thaliana mesophyll chloroplasts (n ≥ 8, P = 0.52). (J) Silencing NbNTRC increases stromule frequency in N. benthamiana leaves (n = 8, P < 0.01), but silencing NbISE2 or NbGUN2 does not affect stromule frequency (n = 8, P > 0.82). (K and L) Representative images of N. benthamiana chloroplasts in control (K) or after silencing NbNTRC (L). Chloroplasts and stromules in are labeled with GFP. Some stromules are indicated by white arrows. Error bars indicate SE. *P < 0.05; **P < 0.01; ***P < 0.0005. (Scale bars: 10 μm.)
Fig. S3.
Fig. S3.
Representative images of chloroplasts and leucoplasts in N. benthamiana and A. thaliana visualized with confocal laser scanning microscopy. Guard cells (A–C and D–F), pavement cells (G–I and J–L), and mesophyll cells (M–O and P–R) all contain chloroplasts in N. benthamiana, as do A. thaliana guard cells (E) and mesophyll cells (Q); however, A. thaliana pavement cells (J–L) have leucoplasts that lack chlorophyll (K). Green, stromal GFP; red, chlorophyll autofluorescence; gray, transmitted light. Some stromules are indicated by white arrows. Error bars indicate SE.
Fig. S4.
Fig. S4.
SHAM does not impact stromule frequency in A. thaliana guard cells. Stromule frequency is similar in guard cells with control treatment (A) and those with SHAM treatment (B). Green, stromal GFP; gray, transmitted light. Some stromules are indicated by white arrows. (Scale bars: 10 μm.)
Fig. S5.
Fig. S5.
Representative images of stromule frequency in N. benthamiana after silencing NbNTRC (B), NbGUN2 (C), or NbISE2 (D), versus control (A). Green, stromal GFP. Some stromules are indicated by white arrows. (Scale bars: 10 μm.)
Fig. S6.
Fig. S6.
Identification of GUN2 orthologs in N. benthamiana. A gene tree of heme oxygenases arranged homologs into two clades: HO1 (or GUN2)-like and HO2-like. (Upper) N. benthamiana has two HO1 homeologs. (Lower Left) The silencing trigger against NbGUN2 was designed to cover the entire gene sequence (837 bp). (Lower Right) Silencing NbGUN2 caused expected phenotypes, such as chlorosis.
Fig. S7.
Fig. S7.
The silencing trigger for NbGUN2 (bottom line) was cloned using primers specific to NbGUN2a (NbS00031948g0007). Here, the silencing trigger is aligned against the homeologous gene, NbGUN2b (NbS00002296g0006). Mismatches are indicated with red hashtags, aligned primer sequences are in bold type and underscored.
Fig. S8.
Fig. S8.
Identification of NTRC orthologs in N. benthamiana. (Upper) A gene tree based on AtNTRC arranged homologs into two clades: NTRA/NTRB-like and NTRC-like. N. benthamiana has two NTRC homeologs. (Lower Left) The silencing trigger against NbNTRC was designed against a sequence that encodes part of the NADPH oxidoreductase domain. (Lower Right) Plants without gene silencing (TRV-GUS) appeared similar to plants silencing NbNTRC expression (TRV-NbNTRC).
Fig. S9.
Fig. S9.
The silencing trigger for NbNTRC (top line) was cloned using primers specific to either NbNTRC homeolog. The annotated cDNA sequence of Nb00000092g0027.1 includes an intron (numbered here as nucleotides 610–696; bottom row, top alignment) that was not detected in any of the sequences we cloned, and is thus likely a misannotation or rare isoform. Accounting for this discrepancy, the silencing trigger is ∼99% identical to both NbNTRC homeologs. Mismatches are indicated with red hashtags; aligned primer sequences are in bold type and underscored.
Fig. S10.
Fig. S10.
Sucrose increases leucoplast but not chloroplast stromule frequency. Representative images of stromule frequency with and without sucrose treatment in A. thaliana epidermal cells. Stromule frequency is similar in chloroplasts (found in guard cells in the epidermis) without sucrose treatment (A) or with sucrose treatment (B). Sucrose treatment increases stromule frequency in leucoplasts (D) compared with control (C). Plastids and stromules are labeled with stromal GFP (green). Some stromules are indicated by white arrows. (Scale bars: 10 μm.)
Fig. 3.
Fig. 3.
Isolated chloroplasts form stromules. N. benthamiana chloroplasts labeled with stromal GFP (A, green) or CFDA staining (B, yellow) show stromules after isolation from their cellular environment. (C) Chloroplasts isolated from S. oleracea and stained with CFDA (yellow; chlorophyll autofluorescence, red) also have stromules. (D and E) Isolated N. benthamiana chloroplasts labeled with stromal GFP form new stromules over time. Newly forming stromules are indicated by white arrows. (F and G) N. benthamiana chloroplasts isolated with a Percoll purification step and labeled with stromal GFP (green; chlorophyll autofluorescence, red) also have stromules.
Fig. S11.
Fig. S11.
Stromules of isolated chloroplasts visualized by confocal microscopy and 3D-SIM. (AC) After extraction from cells, isolated chloroplasts of N. benthamiana have stromules, as visualized by either stromal GFP fluorescence (B) or transmitted light (C), whereas chlorophyll autofluorescence remains restricted to the thylakoids (A). (D) CFDA also labels stromules in isolated N. benthamiana chloroplasts (CFDA, yellow; chlorophyll, red). (E) Representative example of sample purity after chloroplast isolation protocol. Many chloroplasts are fully intact, with stromal GFP (green); some were damaged during extraction and have lost stromal GFP, but retain the thylakoid membranes (chlorophyll autofluorescence, red); and very small quantitites of nonfluorescent materials remain with the sample (transmitted light, gray). (F and G) After isolation, some N. benthamiana chloroplasts have stromules that are very long, as visualized by GFP (F, in green) or CFDA staining (G, in yellow; chlorophyll autofluorescence, red). (H) Isolated A. thaliana chloroplasts expressing stromal roGFP2 (green) also have stromules after extraction from cells. (Scale bars: 5 μm.)
Fig. 4.
Fig. 4.
Examples of fluorescent stromules in N. benthamiana chloroplasts visualized by 3D structured illumination microscopy (3D-SIM). (A and B) Comparison of confocal laser scanning microscopy (A; also shown in Fig. S11) and 3D-SIM (B; also shown in E and in Movie S3) to visualize chloroplast structure (Left: stromal GFP, green; Right: thylakoid chlorophyll, magenta). In particular, note the improved resolution of stromule width and the clarity of the thylakoid grana in the 3D-SIM z-slice (B). (C) 3D-SIM z-slice image of mesophyll chloroplasts with stromules. (D) An epidermal chloroplast connected by a thin bridge that contains both stroma and thylakoids also has a stromule (Left), as shown by SIM. (E) 3D-SIM reveals variability in stromule width. Stromal GFP, green; chlorophyll autofluorescence, magenta. (Scale bar: 2 μm.) One z-slice from a 3D-SIM reconstruction is shown, with measured stromule diameters labeled at indicated positions (white arrows).
Fig. 5.
Fig. 5.
Stromules are initiated by signals within the chloroplast. (Left) Stromule frequency increases in the light (daytime) in both chloroplasts and leucoplasts. (Center) ROS generated from the pETC trigger stromule formation in chloroplasts. (Right) Sucrose promotes stromule formation in leucoplasts, but not chloroplasts. Sucrose is synthesized in the cytosol from products of the Calvin–Benson cycle in chloroplasts and then moves into neighboring heterotrophic pavement cells via plasmodesmata. For simplicity of presentation, only photosynthetic mesophyll cells are shown (and not photosynthetic guard cells), because there is no evidence suggesting that stromules in these cell types behave differently.

Comment in

References

    1. Koussevitzky S, et al. Signals from chloroplasts converge to regulate nuclear gene expression. Science. 2007;316(5825):715–719. - PubMed
    1. Estavillo GM, et al. Evidence for a SAL1-PAP chloroplast retrograde pathway that functions in drought and high light signaling in Arabidopsis. Plant Cell. 2011;23(11):3992–4012. - PMC - PubMed
    1. Burch-Smith TM, Brunkard JO, Choi YG, Zambryski PC. Organelle-nucleus cross-talk regulates plant intercellular communication via plasmodesmata. Proc Natl Acad Sci USA. 2011;108(51):E1451–E1460. - PMC - PubMed
    1. Stonebloom S, et al. Redox states of plastids and mitochondria differentially regulate intercellular transport via plasmodesmata. Plant Physiol. 2012;158(1):190–199. - PMC - PubMed
    1. Xiao Y, et al. Retrograde signaling by the plastidial metabolite MEcPP regulates expression of nuclear stress-response genes. Cell. 2012;149(7):1525–1535. - PubMed

Publication types

MeSH terms