. 2015 Jul 21;112(29):E3883-92.
doi: 10.1073/pnas.1501662112. Epub 2015 Jul 6.

Long noncoding RNA derived from CD244 signaling epigenetically controls CD8+ T-cell immune responses in tuberculosis infection

Affiliations

Long noncoding RNA derived from CD244 signaling epigenetically controls CD8+ T-cell immune responses in tuberculosis infection

Yang Wang et al. Proc Natl Acad Sci U S A. .

Abstract

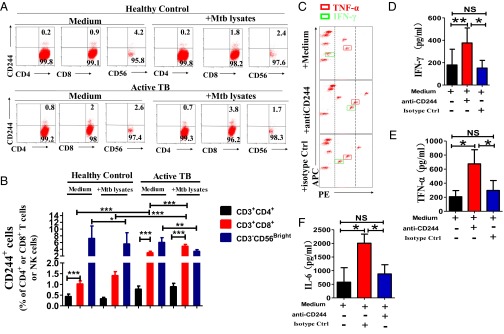
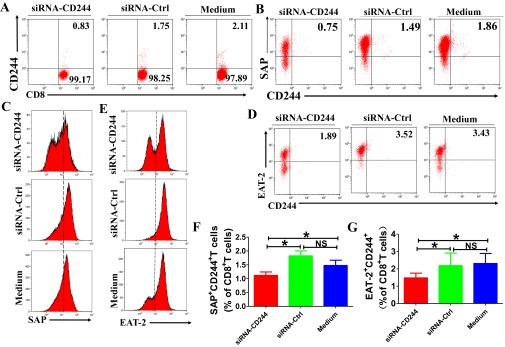
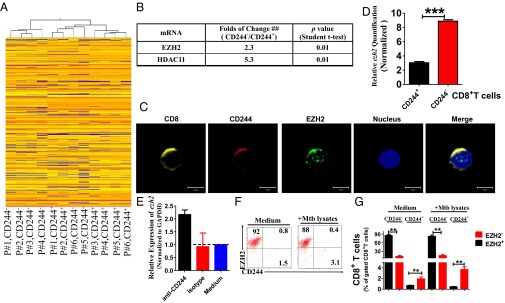
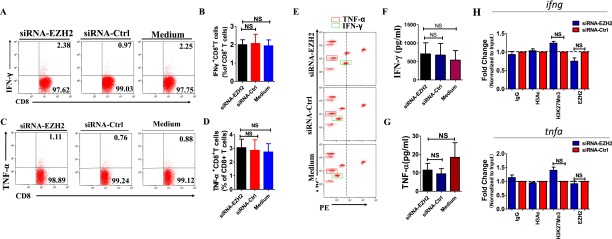
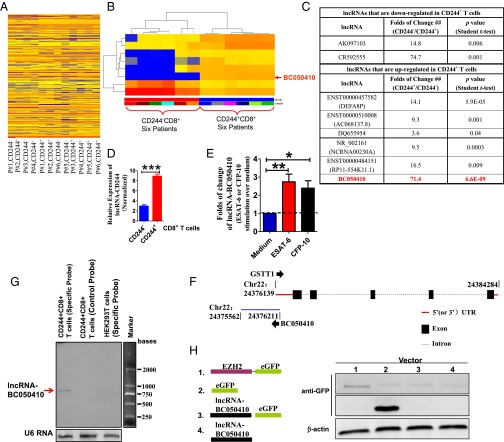
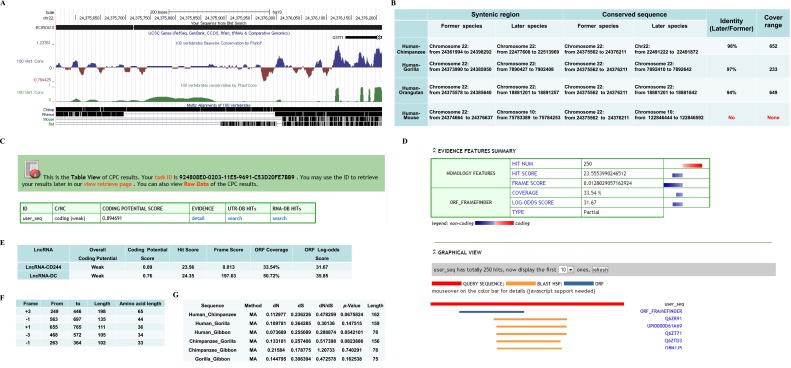
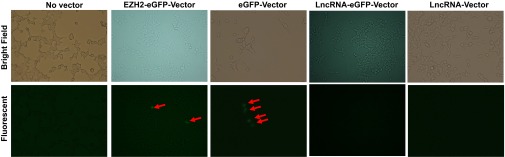
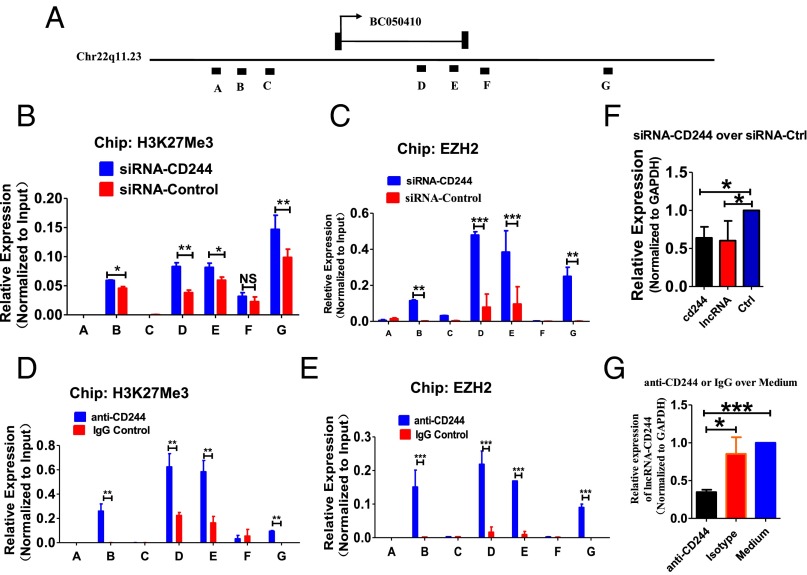
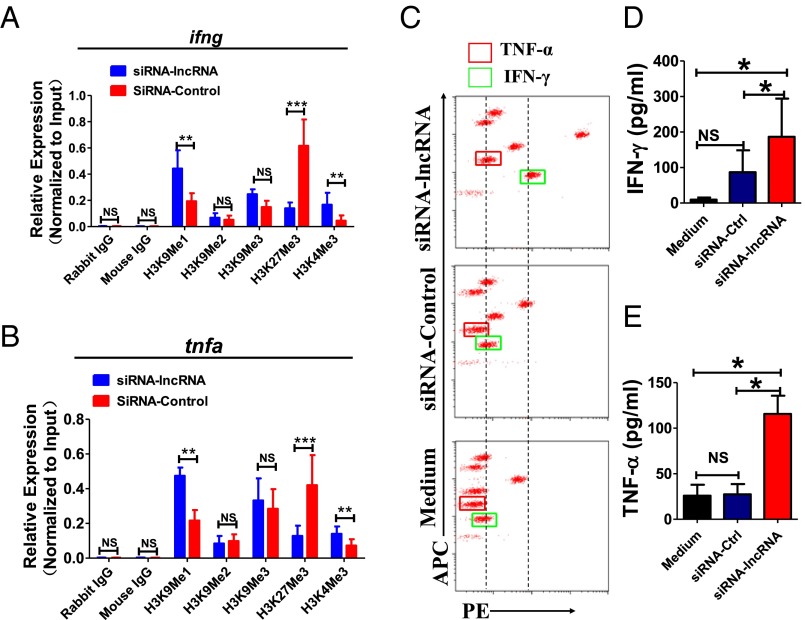
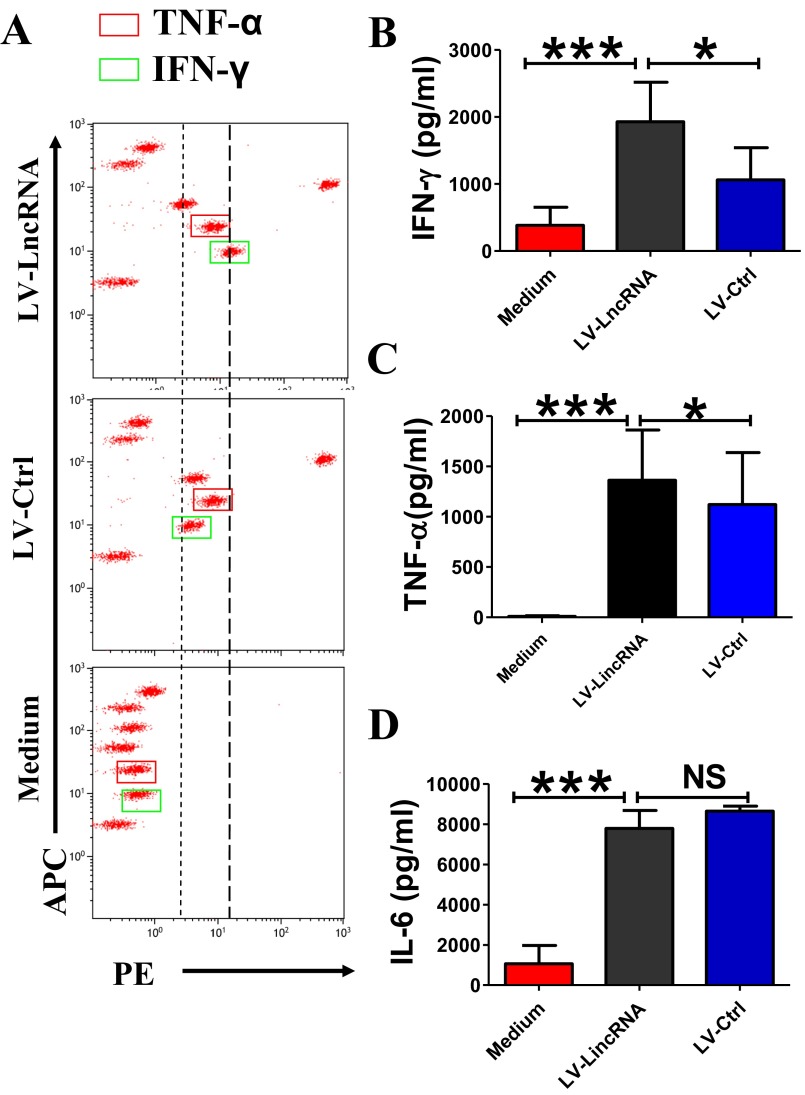
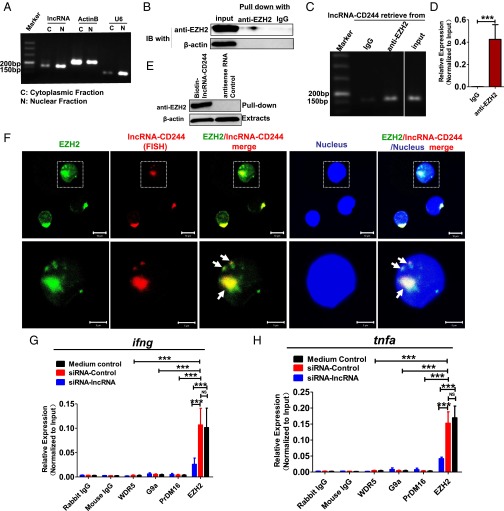
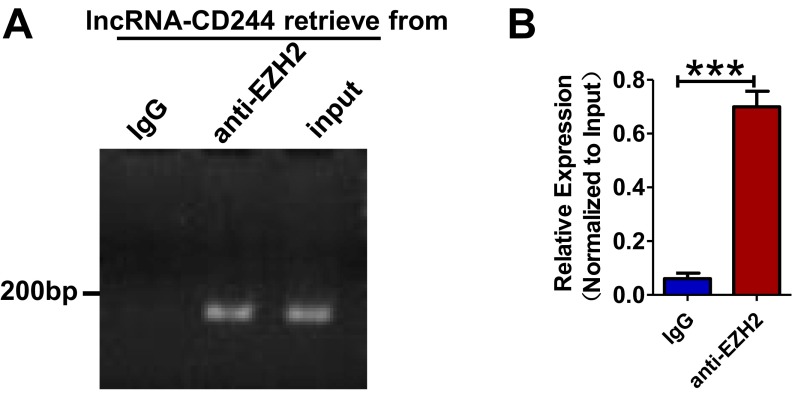
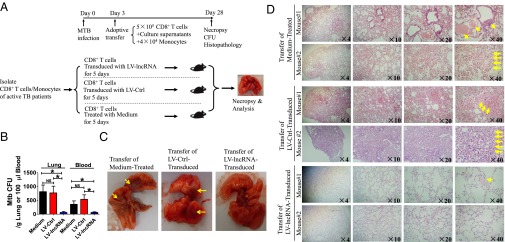
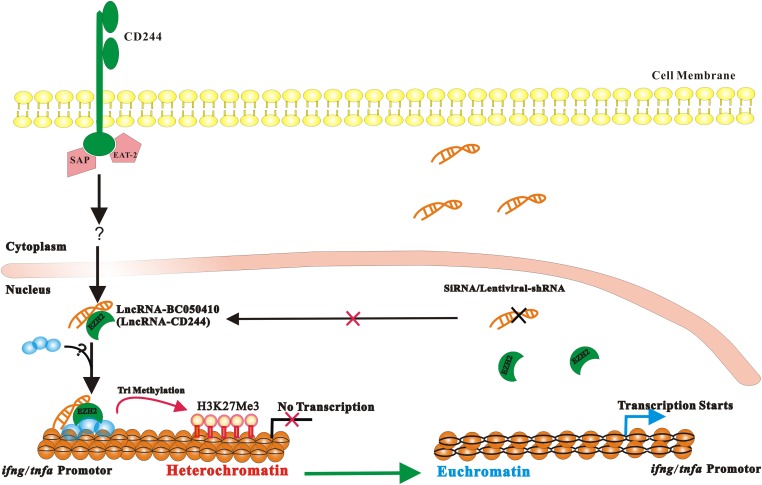
Molecular mechanisms for T-cell immune responses modulated by T cell-inhibitory molecules during tuberculosis (TB) infection remain unclear. Here, we show that active human TB infection up-regulates CD244 and CD244 signaling-associated molecules in CD8(+) T cells and that blockade of CD244 signaling enhances production of IFN-γ and TNF-α. CD244 expression/signaling in TB correlates with high levels of a long noncoding RNA (lncRNA)-BC050410 [named as lncRNA-AS-GSTT1(1-72) or lncRNA-CD244] in the CD244(+)CD8(+) T-cell subpopulation. CD244 signaling drives lncRNA-CD244 expression via sustaining a permissive chromatin state in the lncRNA-CD244 locus. By recruiting polycomb protein enhancer of zeste homolog 2 (EZH2) to infg/tnfa promoters, lncRNA-CD244 mediates H3K27 trimethylation at infg/tnfa loci toward repressive chromatin states and inhibits IFN-γ/TNF-α expression in CD8(+) T cells. Such inhibition can be reversed by knock down of lncRNA-CD244. Interestingly, adoptive transfer of lncRNA-CD244-depressed CD8(+) T cells to Mycobacterium tuberculosis (MTB)-infected mice reduced MTB infection and TB pathology compared with lncRNA-CD244-expressed controls. Thus, this work uncovers previously unidentified mechanisms in which T cell-inhibitory signaling and lncRNAs regulate T-cell responses and host defense against TB infection.

Keywords: CD8+ T cells; lncRNA; tuberculosis.


Conflict of interest statement

The authors declare no conflict of interest.

Figures

Fig. 1.
Fig. 1.
CD244 is preferentially up-regulated on CD8+ T cells during active MTB infection, and blockade of CD244 signaling enhances production of IFN-γ and TNF-α by CD8+ T cells. (A) Representative flow cytometric dot plots show the ex vivo expression of CD244 on CD4+ and CD8+ T cells and CD3-CD56Bright NK cells from one healthy control and one patient with active TB. Data were gated on CD3+CD4+, CD3+CD8+, and CD3-CD56Bright. Percentages of CD244+ T (or NK) cells are shown in the upright quadruple in each dot plot. PBMCs were treated either with or without ex vivo restimulation with MTB lysates. (B) Pooled data show the percentages of CD244+CD4+ T cells, CD244+CD4+ T cells, or CD244+NK cells among total CD3+CD4+ T cells, CD3+CD8+ T cells, and NK cells (n = 15). Error bars represent SEM. (C) Representative CBA assays of a patient with active TB showing that treatment of anti-CD244 mAb induced significant increase of concentration of IFN-γ and TNF-α in culture supernatants of CD8+ T cells purified from PBMCs of patients with active TB. The red and green squares mark the TNF-α and IFN-γ, respectively. The dashed lines mark relative fluorescent intensity of TNF-α and IFN-γ. Treatment of anti-CD244 mAb increased the concentrations of TNF-α and IFN-γ (i.e., the fluorescent intensity of phycoerythrin (PE) increased, and squares shift toward right). (DF) Pooled data show the concentrations of IFN-γ, TNF-α, and IL-6 in the presence of indicated antibody treatment (n = 7). *P < 0.05; **P < 0.01; NS, no statistical significance. Error bars represent SEM from three independent experiments.
Fig. S1.
Fig. S1.
SAP and EAT-2 are downstream signaling molecules of CD244 in CD8+ T cells during active TB infection. PBMCs from patients with active TB were transfected with siRNA targeting CD244 (siRNA-CD244) or siRNA-Ctrl (si-Ctrl) or transfection medium for 48 h and cultured for another 3 d. Cells were then harvested and analyzed for the expression of CD244, SAP, and EAT-2 in CD8+ T cells using ICS/flow cytometry. (A and B) Representative flow cytometric dot plots shows that siRNA-CD244 but not siRNA-Ctrl or transfection medium decreased expression of CD244 (A), SAP (B), and EAT-2 (D) in CD8+ T cells. (C and E) Representative flow cytometric histogram analysis shows that siRNA-CD244 but not siRNA-Ctrl or transfection medium decreased expression of SAP (C) and EAT-2 (E) in CD8+ T cells. Pooled data show the frequency of SAP+CD8+ T cells (F) and EAT-2+CD8+ T cells (G) among total CD8+ T cells after transfection with indicated siRNA. Error bars, SEM (n = 8). Error bars represent SEM from two independent experiments.
Fig. 2.
Fig. 2.
EZH2 correlates negatively with CD244 signaling. (A) Unsupervised clustering analysis of differentially expressed genes between CD244+CD8+ T cells and CD244CD8+ T cells that were purified from PBMCs of patients with active TB. Individual squares represent the relative gene expression intensity of the given genes (rows) in each of six patients (columns), with red indicating an increase in expression and blue a decrease. (B) A table shows the fold of changes of expression of EZH2 and HDAC11 in CD244+CD8+ T cells overexpression in CD244CD8+ T cells. (C) Typical confocal microscopic images show the expression of EZH2 in CD244high CD8+ T cells in PBMCs derived from patients with active TB. (Scale Bar: 5 μm.) (D) qPCR validation of differential expression of EZH2 gene between CD244+CD8+ T cells and CD244CD8+ T cells. (E) qPCR analysis of the EZH2 gene in PBMCs from patients with active TB treated with anti-CD244 mAb or control antibody for 5 d. Data are presented as relative expression levels of ezh2 in PBMCs treated with anti-CD244 mAb or control antibody over expression levels of ezh2 in PBMCs treated with medium (n = 7). Data were normalized to GAPDH. (F) Representative flow cytometric dot plot data showing expression of EZH2 and CD244 in CD8+ T cells of PBMCs with or without ex vivo restimulation with MTB lysates. Data were gated on CD8+ T cells. (G) Pooled data show the frequency of EZH2+CD244, EZH2-CD244+, and EZH2+CD244+ subpopulations of CD8+ T cells over total CD8+ T cells (n = 6). **P < 0.01; NS, no statistical significance. Except for A, error bars represent SEM from two independent experiments.
Fig. S2.
Fig. S2.
EZH2 differential expression is not efficient enough to enhance CD8+ T-cell effector function. (A and C) Representative flow cytometric dot plots showed that, compared with transfection with siRNA-Ctrl or medium, siRNA-EZH2 did not induce significant changes of percentages of IFN-γ– or TNF-α–producing CD8+ T cells. Data were gated on CD8+ T cells. PBMCs from patients with active TB were transfected with siRNA targeting EZH2 (siRNA-EZH2) or siRNA-Ctrl or transfection medium for 48 h and cultured for another 3 d. Cells were then harvested and analyzed for the expression of EZH2 in CD8+ T cells and intracellular IFN-γ and TNF-α responses of CD8+ T cells using ICS/flow cytometry. (B and D) Pooled data show the percentages of IFN-γ– or TNF-α–producing CD8+ T cells in response to knock down of indicated siRNA or medium (n = 10). (E) Representative CBA assay of PBMC of a patient with active TB showing that, compared with transfection with siRNA-Ctrl or medium, siRNA-EZH2 did not induce significant changes of concentration of TNF-α and IFN-γ. The red and green squares mark the TNF-α and IFN-γ, respectively. (F and G) Pooled data showing the concentrations of IFN-γ and TNF-α upon transfection of indicated siRNA or medium (n = 10). (H) ChIP-qPCR analysis of H3K27Me3, EZH2, and H3Ac at the promoters of IFN-γ and TNF-α in CD8+ T cells transfected with siRNA-EZH2 and siRNA-Ctrl. NS, no statistical significance. Error bars represent SEM from two independent experiments.
Fig. 3.
Fig. 3.
lncRNA-CD244 is highly expressed in CD244+CD8+ T cells during active TB. (A) Unsupervised clustering analysis of differentially expressed lncRNAs between CD244+CD8+ T cells and CD244CD8+ T cells that were purified from PBMCs of patients with active TB. Individual squares represent the relative lncRNA expression intensity of the given lncRNAs (rows) in each of the patients (columns), with red indicating an increase in expression and blue a decrease. (B) Supervised clustering analysis using differentially expressed lncRNAs that can distinguish CD244+CD8+ T cells from CD244CD8+ T cells. (C) A table shows the folds of change and P values (Student t test) of eight lncRNAs that could distinguish CD244+CD8+ T-cell subpopulation from CD244CD8+ T-cell subpopulation of six patients with active TB. (D) qPCR validation of differential expression of lncRNA-CD244 between CD244+CD8+ T cells and CD244CD8+ T cells. (E) qPCR analysis of lncRNA-CD244 expression in CD244+CD8+ T cells purified from PBMCs of patients with active TB upon stimulation with MTB ESAT-6 (10 μg/mL) or CFP-10 (10 μg/mL) peptide pools for 5 d in vitro. (F) Schematic diagram of the lncRNA-CD244 genomic locus in human chromosome 22. The bars represent exons, dashed lines represent intron, red line represents 5′ (or 3′) UTR, and arrows indicate the direction of transcription. The length of lncRNA-CD244 is 796 bases, which overlapped 5′ UTR of GST θ1 (GSTT1) by 72 bases. No homologs of lncRNA-CD244 were found in mouse (Fig. S3 A and B). (G) Northern blot analysis show the expression of full-length lncRNA-CD244 in CD244+CD8+ T cells from patients with active TB using specific probe but not antisense control probe. No lncRNA-CD244 was detected in HEK293T cells. U6 RNA served as a control. (H) Plasmids as schematically shown at Left were transfected to HEK293T cells (Right). Immunoblotting using antibody specific to EGFP and fluorescent imaging (Fig. S5) showed that lncRNA-CD244-EGFP plasmid and lncRNA-CD244 plasmid did not express GFP. Error bars represent SEM. Data shown in D, E, G, and H are representative of at least two independent experiments.
Fig. S3.
Fig. S3.
Bioinformatics analyses of evolutional conservation and protein-coding potential of lncRNA-BC050410. (A) The conservation track of lncRNA-BC050410 analyzed by the UCSC Genome Browser (genome.ucsc.edu). No mouse or rat homolog was found. (B) Conservation analysis in the syntenic region. Identity was calculated by alignment between later (e.g., chimpanzee) and former (e.g., human) species in the cover range (e.g., 652) indicated in the table. Note that no identity between human and mouse was found. (C and D) The analysis of protein-coding potential of lncRNA-BC050410 using tools provided by the Peking University Center for Bioinformatics (cpc.cbi.pku.edu.cn/programs/run_cpc.jsp) shows lack of protein-coding capability. (E) Comparison between lncRNA-BC050410 and the variant-1 transcript of lncRNA-DC (35) for parameters to determine protein-coding potential using the same tools provided by the Peking University Center for Bioinformatics (cpc.cbi.pku.edu.cn/programs/run_cpc.jsp). The larger hit score and frame score indicate that a transcript is more likely protein-coding, and larger ORF coverage or log-odds score indicates the better ORF quality. (F) The lengths of five potential ORFs in lncRNA-BC050410. (G) dN/dS analyses between two different species of Hominoidea indicated in the table. Data were calculated by the KaKs_Calculator software (https://code.google.com/p/kaks-calculator/wiki/KaKs_Calculator) using pair-wised DNA sequences (lengths are indicated in the table) from homologous amino acid sequences aligned between two different species of Hominoidea. “MA” indicates model averaging, which assigns each candidate model a weight value and engages more than one model to estimate average parameters across models (64). A value of P > 0.05 was considered as no negative or positive selection.
Fig. S4.
Fig. S4.
Genome location analysis of human lncRNA-CR592555 using UCSC Genome Browsers showed that lncRNA-CR592555 is located between 79,946,861 bp and ∼79,947,776 bp in chromosome 5.
Fig. S5.
Fig. S5.
Representative fluorescent images of HEK293T cells transfected with vectors as indicated in Fig. 3 showed that only cells transfected with EZH2-EGFP vector and EGFP vector expressed GFP. Data shown are representative of at least two independent experiments.
Fig. 4.
Fig. 4.
Knock down of CD244 or blockade of CD244 signaling induces a more repressive chromatin state in lncRNA-CD244 locus and inhibits expression of lncRNA-CD244. Seven regions (capital letters A to G) across lncRNA-CD244 locus, as shown in A, were analyzed in ChIP-qPCR analyses for H3K27Me3 (B and D) histone modification and EZH2 (C and E) in PBMCs from patients with active TB. PBMCs were transfected with siRNA-CD244 or siRNA-Ctrl or treated with anti-CD244 mAb or IgG control as indicated in each of subfigure. Values derived from three independent experiments were normalized by background signals and input chromatin. (F and G) qPCR analysis of lncRNA-CD244 and/or the cd244 gene in PBMCs from patients with active TB transfected (or treated) with indicated siRNAs (F) or antibodies (G). Data are presented as relative expression levels of lncRNA-CD244 (or cd244) (normalized to GAPDH) in siRNA-CD244–transfected (or anti-CD244–treated) PBMCs over expression levels of lncRNA-CD244 (or cd244) in siRNA-Ctrl–transfected (or IgG-treated) PBMCs (n = 7). *P < 0.05; **P < 0.01; ***P < 0.001; NS, no statistical significance. Error bars represent SEM from three independent experiments.
Fig. 5.
Fig. 5.
lncRNA-CD244 regulates IFN-γ and TNF-α expression in active TB infection. (A and B) ChIP-qPCR analysis of H3K9Me1, H3K9Me2, H3K9Me3, H3K4me3, H3K27Me3, and control antibodies at the promoters of IFN-γ (A) and TNF-α (B) in CD8+ T cells transfected with indicated siRNAs. (C) Representative CBA assays of PBMCs from a patient with active TB showing that, compared with siRNA-Ctrl or transfection medium, siRNA-lncRNA-CD244 induced significant increases in concentrations of IFN-γ/TNF-α. (D and E) Pooled data showing the concentrations of IFN-γ/TNF-α upon transfection of indicated siRNAs or medium (n = 7). *P < 0.05; **P < 0.01; ***P < 0.001; NS, no statistical significance. Error bars represent SEM from three independent experiments.
Fig. S6.
Fig. S6.
CD8+ T cells with inhibited expression of lncRNA-CD244 show greater production of INF-γ and TNF-α. (A) Representative CBA assays of CD8+ T cells purified from PBMCs of a patient with active TB showing that, compared with transduction of LV-Ctrl or treatment with transduction medium, transduction of LV vector encoding GFP and shRNA targeting lncRNA-CD244 (LV-lncRNA-CD244) in CD8+ T cells induced a significant increase of concentration of IFN-γ and TNF-α. (BD) Pooled data showing the concentrations of IFN-γ, TNF-α, and IL-6 upon transfection of indicated LV vectors (n = 8). Error bars represent SEM. Shown is a representative of at least three independent experiments.
Fig. S7.
Fig. S7.
Effect of lncRNA-CD244 knockdown on apoptosis of CD8+ T cells and GSTT1 expression and analysis of the association between GSTT1 expression and IFN-γ/TNF-α expression by CD8+ T cells. (A) qPCR analysis of GSTT1 mRNA expression in CD8+ T cells of patients with active TB that were transfected with siRNA-lncRNA and siRNA-Ctrl. (B and C) Pooled data showing the concentrations of IFN-γ and TNF-α determined by CBA analysis upon transduction of indicated LV containing shRNAs targeting GSTT1 (LV-GSTT1), control LV (LV-Ctrl), or medium. (D and E) Representative flow cytometric analysis (D) and pooled data of five TB patients (E) of CD8+ T cells transfected with siRNA-lncRNA-CD244 or siRNA-Ctrl at day 5 and then analyzed for apoptosis based on the intracellular expression of Annexin V and propidium iodide (n = 5). NS, no statistically significant difference. Error bars represent SEM from three independent experiments.
Fig. 6.
Fig. 6.
lncRNA-CD244 interacts directly with EZH2 and recruits EZH2 to ifng and tnfa promoters. (A) Gel electrophoresis of lncRNA-CD244 extracted from nucleus and cytoplasm of CD8+ T cells purified from PBMCs of patients with active TB. As controls, more actin B expressed in cytoplasm and more U6 expressed in nucleus, respectively. (B) IB analysis of EZH2 in the IP by IgG or anti-EZH2–specific antibody from CD8+ T-cell lysates of patients with active TB. (C and D) Gel electrophoresis (C) and qPCR analysis (D) of lncRNA-CD244 retrieve in IP by IgG or anti-EZH2–specific antibody from CD8+ T-cell lysates of patients with active TB. The levels of qRT-PCR products were expressed as a percentage of input RNA. (E) Biotinylated lncRNA-CD244 or antisense RNA control was incubated with nuclear extracts of CD8+ T cells from patients with active TB and targeted with streptavidin-conjugated magnetic beads (MB), and associated proteins were assessed with Western blot using anti-EZH2–specific antibody. (F) Confocal microscopic images of RNA FISH assay of lncRNA-CD244 and immunofluorescence analysis of EZH2 show that EZH2 colocalizes with lncRNA-CD244 in nucleus of CD8+ T cells from patients with active TB. Lower images were cropped from the squares in the upper images. (Scale bars: 10 μm in Upper and 5 μm in Lower.) More than 30 cells were examined and had similar results. White arrowheads mark the EZH2/lncRNA-CD244 colocalization. (G and H) ChIP-qPCR analysis of WDR5, G9a, Prdm16, EZH2, and control antibodies at the promoters of IFN-γ and TNF-α in CD8+ T cells transfected with siRNA-lncRNA and siRNA-Ctrl (n = 7). ***P < 0.001. Error bars represent SEM from three independent experiments.
Fig. S8.
Fig. S8.
RIP analysis shows that lncRNA-CD244 interacts with EZH2 upon exogenous expression in HEK293T cells. lncRNA-CD244 vector and EZH2-EGFP vector were cotransfected into HEK293T cells. Extracts of HEK293T cells were prepared, and EZH2 protein was immunoprecipitated by either IgG control antibody or anti-EZH2–specific antibody and tested for association with lncRNA-CD244 by qRT-PCR. (A and B) Gel electrophoresis (A) and qPCR analysis (B) of lncRNA-CD244 retrieve in IP by IgG or anti-EZH2–specific antibody from lysates of HEK293T cell. The levels of qRT-PCR products were expressed as a percentage of input RNA. ***P < 0.001. Error bars represent SEM from three independent experiments.
Fig. 7.
Fig. 7.
Adoptive transfer of lncRNA-CD244–depressed CD8+ T cells to MTB-infected SCID mice reduced MTB infection and TB pathology compared with lncRNA-CD244–expressed controls. (A) Schematic diagram shows the experimental strategy of adoptive transfer of CD8+ T cells with inhibited lncRNA-CD244 expression, culture supernatants of indicated CD8+ T cells, and monocytes in MTB-infected mice. (B) Bacterial load (CFU, H37Rv) in the lungs and peripheral blood of mice indicated in A (n = 8 mice per group). (C) Representative digital camera images of lungs collected from mice receiving transfer of indicated cells with or without knock down of lncRNA-CD244. Yellow arrows mark the necrosis. (D) H&E-stained lung sections derived from two representative mice in each group of mice indicated in A. Yellow arrows mark the infiltration of red blood cells or damage of pulmonary structure. The magnification is shown at the lower right of each image. *P < 0.05. Error bars represent SEM from two independent experiments.
Fig. S9.
Fig. S9.
A proposed model of ifng and tnfa expression regulated by lncRNA-CD244 in CD8+ T cells during active TB infection. TB infection induces up-regulation of CD244 on CD8+ T cells, which drives expression of lncRNA-CD244. lncRNA-CD244 that localizes in the nucleus mediates recruitment of polycomb protein EZH2 to trimethylate H3K27 at promoter of IFN-γ and TNF-α, which therefore induces a repressive chromatin (heterochromatin) in ifng and tnfa locus, and therefore transcription of ifng and tnfa is inhibited. Knock down of lncRNA-CD244 using siRNA or LV vector encoding shRNA targeting lncRNA-CD244 results in failure of recruitment of EZH2 to promoter of IFN-γ and TNF-α, and therefore heterochromatin is changed to euchromatin and transcription of ifng and tnfa starts. It remains unclear whether lncRNA-CD244 mediates recruitment of EZH2 alone or with other histone modification enzymes. SAP and EAT-2 are associated with CD244 signaling in active TB, but it remains unknown which molecules are downstream of CD244-SAP/EAT-2 signaling cascades.

Similar articles

Cited by

References

    1. Rubin EJ. Troubles with tuberculosis prevention. N Engl J Med. 2014;370(4):375–376. - PubMed
    1. Zumla A, George A, Sharma V, Herbert N. Baroness Masham of Ilton WHO’s 2013 global report on tuberculosis: Successes, threats, and opportunities. Lancet. 2013;382(9907):1765–1767. - PubMed
    1. Bold TD, Ernst JD. CD4+ T cell-dependent IFN-γ production by CD8+ effector T cells in Mycobacterium tuberculosis infection. J Immunol. 2012;189(5):2530–2536. - PMC - PubMed
    1. Cooper AM. Cell-mediated immune responses in tuberculosis. Annu Rev Immunol. 2009;27:393–422. - PMC - PubMed
    1. Chen CY, et al. A critical role for CD8 T cells in a nonhuman primate model of tuberculosis. PLoS Pathog. 2009;5(4):e1000392. - PMC - PubMed

Publication types

MeSH terms

Substances