

Antigenic Stimulation of Kv1.3-Deficient Th Cells Gives Rise to a Population of Foxp3-Independent T Cells with Suppressive Properties
- PMID: 26150529
- PMCID: PMC4530110
- DOI: 10.4049/jimmunol.1403024
Antigenic Stimulation of Kv1.3-Deficient Th Cells Gives Rise to a Population of Foxp3-Independent T Cells with Suppressive Properties
Abstract
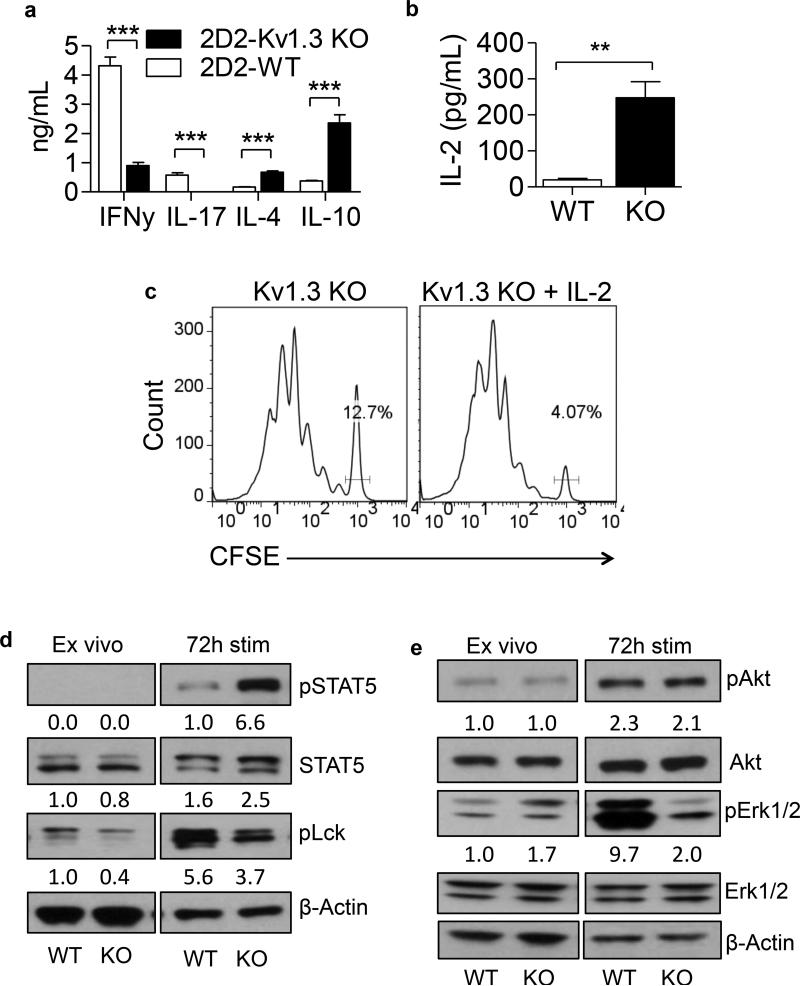
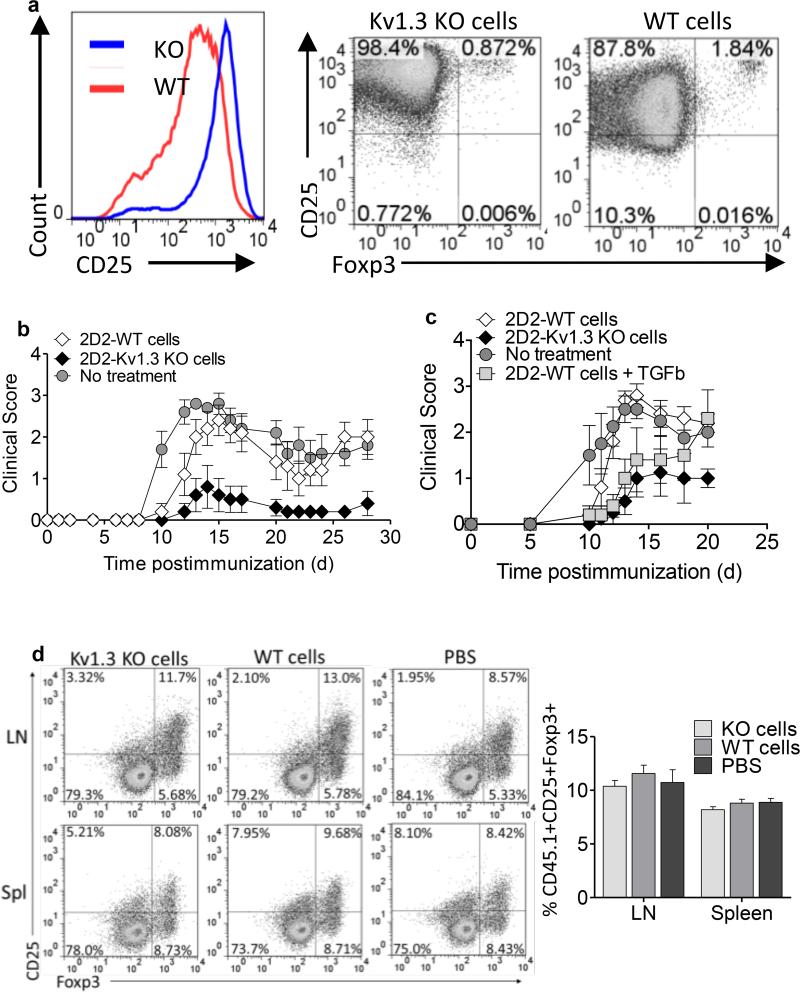
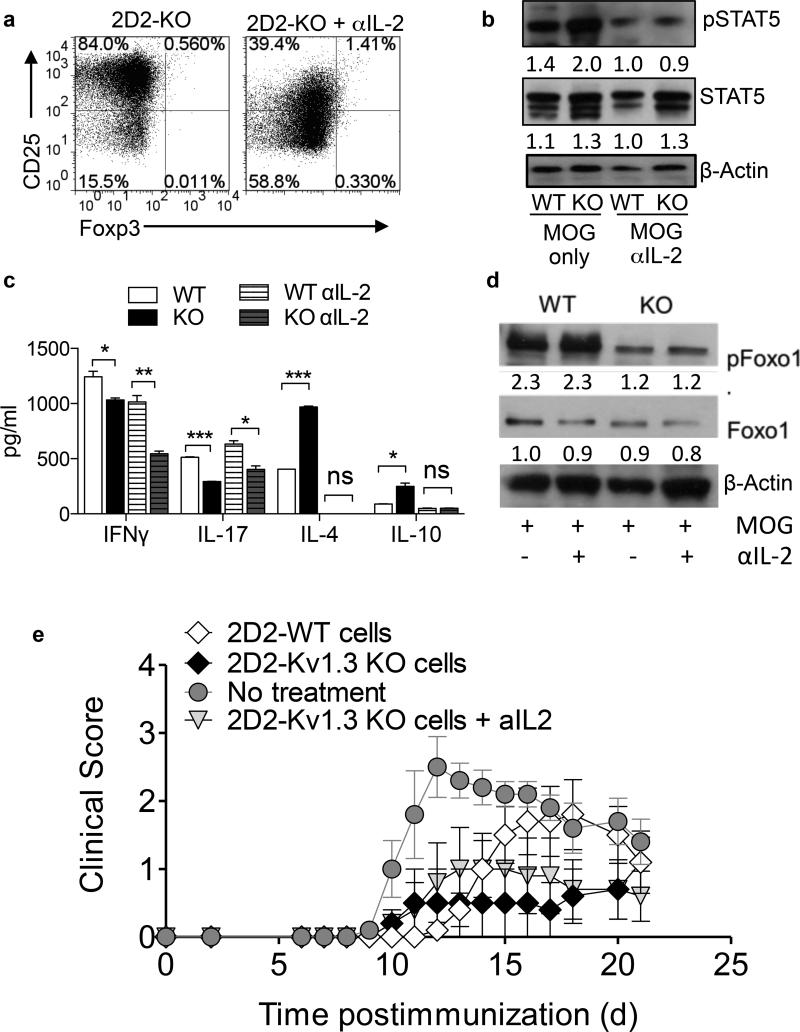
Multiple sclerosis (MS) is an immune-mediated demyelinating disease of the CNS that has been linked with defects in regulatory T cell function. Therefore, strategies to selectively target pathogenic cells via enhanced regulatory T cell activity may provide therapeutic benefit. Kv1.3 is a voltage-gated potassium channel expressed on myelin-reactive T cells from MS patients. Kv1.3-knockout (KO) mice are protected from experimental autoimmune encephalomyelitis, an animal model of MS, and Kv1.3-KO Th cells display suppressive capacity associated with increased IL-10. In this article, we demonstrate that myelin oligodendrocyte glycoprotein-specific Kv1.3-KO Th cells exhibit a unique regulatory phenotype characterized by high CD25, CTLA4, pSTAT5, FoxO1, and GATA1 expression without a corresponding increase in Foxp3. These phenotypic changes result from increased signaling through IL-2R. Moreover, myelin oligodendrocyte glycoprotein-specific Kv1.3-KO Th cells can ameliorate experimental autoimmune encephalomyelitis following transfer to wild-type recipients in a manner that is partially dependent on IL-2R and STAT5 signaling. The present study identifies a population of Foxp3(-) T cells with suppressive properties that arises in the absence of Kv1.3 and enhances the understanding of the molecular mechanism by which these cells are generated. This increased understanding could contribute to the development of novel therapies for MS patients that promote heightened immune regulation.
Copyright © 2015 by The American Association of Immunologists, Inc.
Figures


Similar articles
-
Protein kinase B/Akt signals impair Th17 differentiation and support natural regulatory T cell function and induced regulatory T cell formation.J Immunol. 2009 Nov 15;183(10):6124-34. doi: 10.4049/jimmunol.0900246. Epub 2009 Oct 19. J Immunol. 2009. PMID: 19841181
-
Kv1.3 deletion biases T cells toward an immunoregulatory phenotype and renders mice resistant to autoimmune encephalomyelitis.J Immunol. 2012 Jun 15;188(12):5877-86. doi: 10.4049/jimmunol.1103095. Epub 2012 May 11. J Immunol. 2012. PMID: 22581856 Free PMC article.
-
Depletion of CD4+ CD25+ regulatory T cells confers susceptibility to experimental autoimmune encephalomyelitis (EAE) in GM-CSF-deficient Csf2-/- mice.J Leukoc Biol. 2016 Oct;100(4):747-760. doi: 10.1189/jlb.3A0815-359R. Epub 2016 Jun 2. J Leukoc Biol. 2016. PMID: 27256565 Free PMC article.
-
Th9 cells in the pathogenesis of EAE and multiple sclerosis.Semin Immunopathol. 2017 Jan;39(1):79-87. doi: 10.1007/s00281-016-0604-y. Epub 2016 Nov 14. Semin Immunopathol. 2017. PMID: 27844107 Review.
-
Th17 Cells and autoimmune encephalomyelitis (EAE/MS).Allergol Int. 2008 Jun;57(2):115-20. doi: 10.2332/allergolint.R-07-159. Allergol Int. 2008. PMID: 18427164 Review.
Cited by
-
Molecular dissection of an immunodominant epitope in Kv1.2-exclusive autoimmunity.Front Immunol. 2024 Apr 11;15:1329013. doi: 10.3389/fimmu.2024.1329013. eCollection 2024. Front Immunol. 2024. PMID: 38665908 Free PMC article.
-
IL-17 Inhibits Oligodendrocyte Progenitor Cell Proliferation and Differentiation by Increasing K+ Channel Kv1.3.Front Cell Neurosci. 2021 Jun 22;15:679413. doi: 10.3389/fncel.2021.679413. eCollection 2021. Front Cell Neurosci. 2021. PMID: 34239419 Free PMC article.
-
β1-Integrin- and KV1.3 channel-dependent signaling stimulates glutamate release from Th17 cells.J Clin Invest. 2020 Feb 3;130(2):715-732. doi: 10.1172/JCI126381. J Clin Invest. 2020. PMID: 31661467 Free PMC article.
-
Loureirin B Exerts its Immunosuppressive Effects by Inhibiting STIM1/Orai1 and KV1.3 Channels.Front Pharmacol. 2021 Jun 25;12:685092. doi: 10.3389/fphar.2021.685092. eCollection 2021. Front Pharmacol. 2021. PMID: 34248635 Free PMC article.
-
Structure of the voltage-gated potassium channel KV1.3: Insights into the inactivated conformation and binding to therapeutic leads.Channels (Austin). 2023 Dec;17(1):2253104. doi: 10.1080/19336950.2023.2253104. Channels (Austin). 2023. PMID: 37695839 Free PMC article. Review.
References
-
- Lovett-Racke AE, Trotter JL, Lauber J, Perrin PJ, June CH, Racke MK. Decreased dependence of myelin basic protein-reactive T cells on CD28-mediated costimulation in multiple sclerosis patients. A marker of activated/memory T cells. The Journal of clinical investigation. 1998;101:725–730. - PMC - PubMed
-
- Lowther DE, Hafler DA. Regulatory T cells in the central nervous system. Immunological reviews. 2012;248:156–169. - PubMed
Publication types
MeSH terms
Substances
Grants and funding
LinkOut - more resources
Full Text Sources
Other Literature Sources
Research Materials
Miscellaneous
