

How is the effectiveness of immune surveillance impacted by the spatial distribution of spreading infections?
- PMID: 26150655
- PMCID: PMC4528487
- DOI: 10.1098/rstb.2014.0289
How is the effectiveness of immune surveillance impacted by the spatial distribution of spreading infections?
Abstract
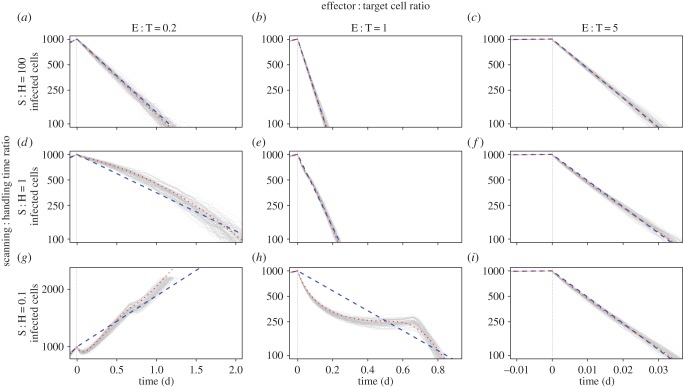
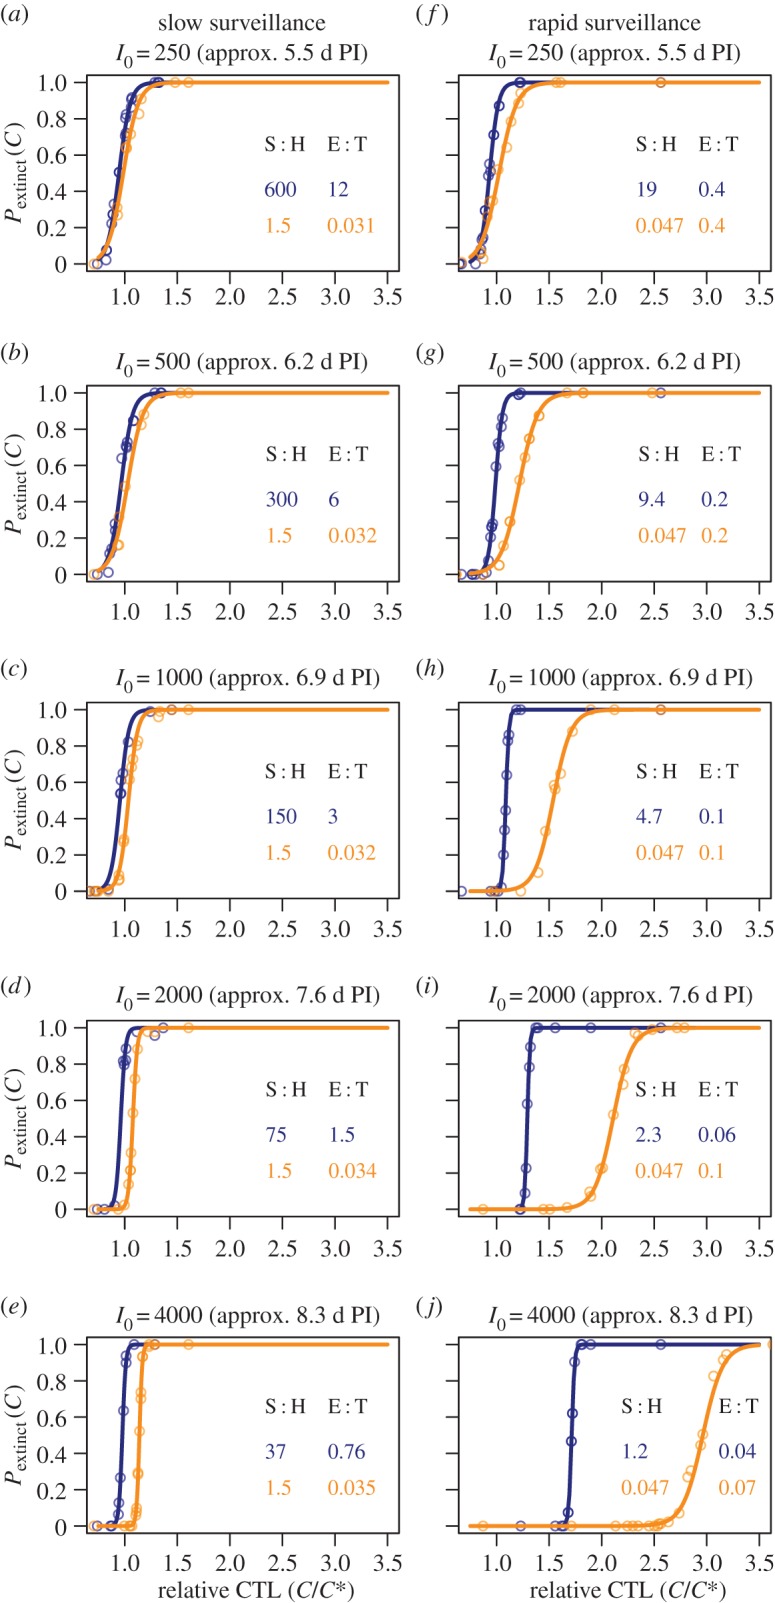
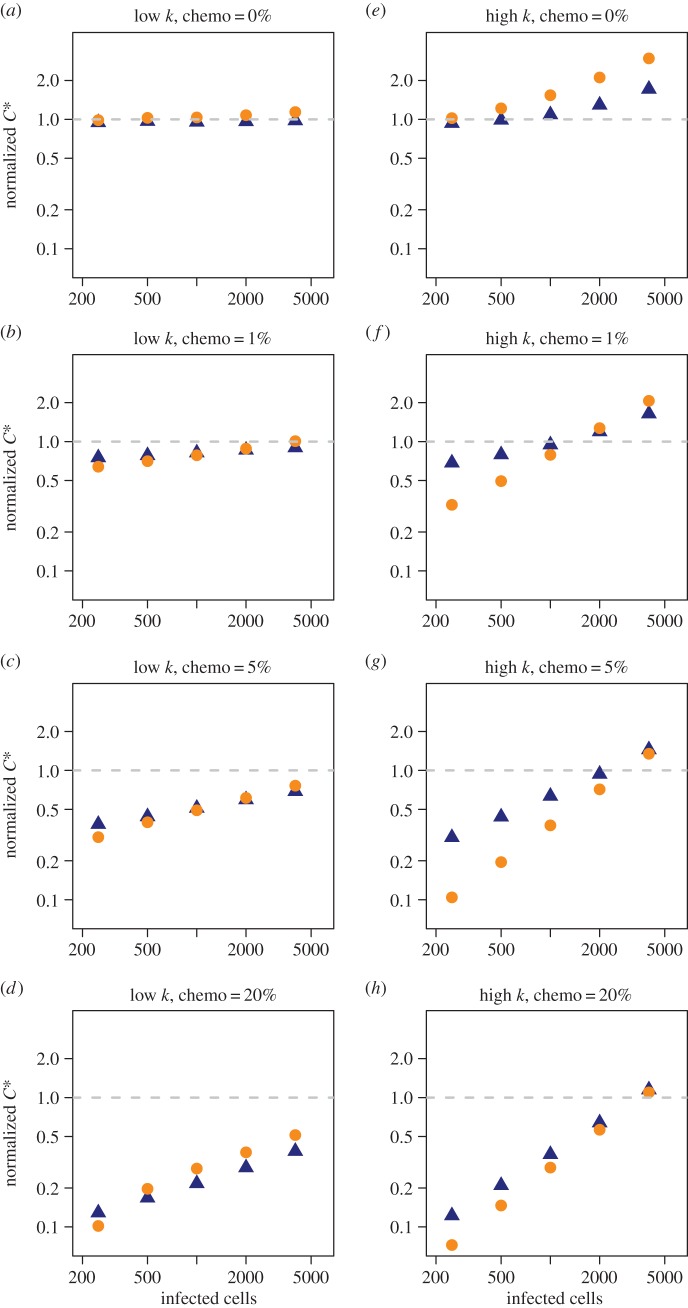
What effect does the spatial distribution of infected cells have on the efficiency of their removal by immune cells, such as cytotoxic T lymphocytes (CTL)? If infected cells spread in clusters, CTL may initially be slow to locate them but subsequently kill more rapidly than in diffuse infections. We address this question using stochastic, spatially explicit models of CTL interacting with different patterns of infection. Rather than the effector : target ratio, we show that the relevant quantity is the ratio of a CTL's expected time to locate its next target (search time) to the average time it spends conjugated with a target that it is killing (handling time). For inefficient (slow) CTL, when the search time is always limiting, the critical density of CTL (that required to control 50% of infections, C(*)) is independent of the spatial distribution and derives from simple mass-action kinetics. For more efficient CTL such that handling time becomes limiting, mass-action underestimates C(*), and the more clustered an infection the greater is C(*). If CTL migrate chemotactically towards targets the converse holds-C(*) falls, and clustered infections are controlled most efficiently. Real infections are likely to spread patchily; this combined with even weak chemotaxis means that sterilizing immunity may be achieved with substantially lower numbers of CTL than standard models predict.
Keywords: computational immunology; cytotoxic T cells; spatial modelling.
Figures
Similar articles
-
Heterogeneous, delayed-onset killing by multiple-hitting T cells: Stochastic simulations to assess methods for analysis of imaging data.PLoS Comput Biol. 2020 Jul 13;16(7):e1007972. doi: 10.1371/journal.pcbi.1007972. eCollection 2020 Jul. PLoS Comput Biol. 2020. PMID: 32658891 Free PMC article.
-
Investigating CTL mediated killing with a 3D cellular automaton.PLoS Comput Biol. 2009 Aug;5(8):e1000466. doi: 10.1371/journal.pcbi.1000466. Epub 2009 Aug 21. PLoS Comput Biol. 2009. PMID: 19696876 Free PMC article.
-
A general functional response of cytotoxic T lymphocyte-mediated killing of target cells.Biophys J. 2014 Apr 15;106(8):1780-91. doi: 10.1016/j.bpj.2014.01.048. Biophys J. 2014. PMID: 24739177 Free PMC article.
-
Mechanisms and Dynamics of T Cell-Mediated Cytotoxicity In Vivo.Trends Immunol. 2017 Jun;38(6):432-443. doi: 10.1016/j.it.2017.04.002. Epub 2017 May 9. Trends Immunol. 2017. PMID: 28499492 Review.
-
Mathematical models of cytotoxic T-lymphocyte killing.Immunol Cell Biol. 2007 Jun;85(4):274-9. doi: 10.1038/sj.icb.7100053. Epub 2007 Apr 10. Immunol Cell Biol. 2007. PMID: 17420769 Review.
Cited by
-
Within-host dynamics of infection: from ecological insights to evolutionary predictions.Philos Trans R Soc Lond B Biol Sci. 2015 Aug 19;370(1675):20140304. doi: 10.1098/rstb.2014.0304. Philos Trans R Soc Lond B Biol Sci. 2015. PMID: 26150670 Free PMC article. No abstract available.
-
The role of spatial structure in the evolution of viral innate immunity evasion: A diffusion-reaction cellular automaton model.PLoS Comput Biol. 2020 Feb 10;16(2):e1007656. doi: 10.1371/journal.pcbi.1007656. eCollection 2020 Feb. PLoS Comput Biol. 2020. PMID: 32040504 Free PMC article.
-
Spatial Lymphocyte Dynamics in Lymph Nodes Predicts the Cytotoxic T Cell Frequency Needed for HIV Infection Control.Front Immunol. 2019 Jun 11;10:1213. doi: 10.3389/fimmu.2019.01213. eCollection 2019. Front Immunol. 2019. PMID: 31244829 Free PMC article.
-
Tissue-Resident Memory T Cells in Mice and Humans: Towards a Quantitative Ecology.J Immunol. 2019 Nov 15;203(10):2561-2569. doi: 10.4049/jimmunol.1900767. J Immunol. 2019. PMID: 31685700 Free PMC article. Review.
-
Recognition of Apoptotic Cells by Viruses and Cytolytic Lymphocytes: Target Selection in the Fog of War.Viral Immunol. 2020 Apr;33(3):188-196. doi: 10.1089/vim.2019.0173. Viral Immunol. 2020. PMID: 32286181 Free PMC article.
References
Publication types
MeSH terms
Grants and funding
LinkOut - more resources
Full Text Sources
Other Literature Sources
