Review
. 2015 Aug 19;370(1675):20140291.
doi: 10.1098/rstb.2014.0291.

Estimating T-cell repertoire diversity: limitations of classical estimators and a new approach

Affiliations
Review

Estimating T-cell repertoire diversity: limitations of classical estimators and a new approach

Daniel J Laydon et al. Philos Trans R Soc Lond B Biol Sci. .

Abstract

A highly diverse T-cell receptor (TCR) repertoire is a fundamental property of an effective immune system, and is associated with efficient control of viral infections and other pathogens. However, direct measurement of total TCR diversity is impossible. The diversity is high and the frequency distribution of individual TCRs is heavily skewed; the diversity therefore cannot be captured in a blood sample. Consequently, estimators of the total number of TCR clonotypes that are present in the individual, in addition to those observed, are essential. This is analogous to the 'unseen species problem' in ecology. We review the diversity (species richness) estimators that have been applied to T-cell repertoires and the methods used to validate these estimators. We show that existing approaches have significant shortcomings, and frequently underestimate true TCR diversity. We highlight our recently developed estimator, DivE, which can accurately estimate diversity across a range of immunological and biological systems.

Keywords: T-cell receptor repertoire; diversity; species richness.


Figures

Figure 1.
Figure 1.
T-cell receptor gene rearrangement. (a) Variable (V), joining (J) and constant regions (C) constitute the TCR α-chain. (b) Variable (V), joining (J) and constant regions (C) constitute the TCR β-chain, with an additional diversity (D) region. Segments from each region are recombined, with additional nucleotide additions, to generate each rearranged TCR. These processes generate substantial T cell diversity. (c,d) Hypervariable complementarity-determining regions (CDR1-CDR3) of the α-chain (c) and β-chain (d). CDR1 and CDR2 regions are encoded on the V region, while the most variable CDR3 region straddles the V(D)J junction.
Figure 2.
Figure 2.
PCR amplification can lead to ‘false saturation’ of rarefaction curves. Example of ‘exhaustive sequencing’ of CD4+ T cell compartment in a healthy donor. Unbiased sequence data was obtained through 5′ rapid amplification of cDNA ends (RACE) [53]. The rarefaction curve approaches saturation, falsely implying that further sequencing would not yield many additional clonotypes. However, the approximate saturation value of 2.5 × 10⁴ is not a realistic estimate of total CD4+ TCR diversity. For example, Robins et al. [47] frequently observed more than 105 clonotypes before estimating the number of unseen clonotypes. PCR amplification overestimates the repeated observation of TCR clonotype in the sample, leading to false saturation and substantial underestimates of TCR diversity. (Online version in colour.)
Figure 3.
Figure 3.
Performance of species richness estimators. (a,c) The Chao1bc (blue), Chao2 (orange), ACE (grey), Bootstrap (green) and Good-Turing (black) estimators are applied to in silico random subsamples of observed data. Examples for HTLV-1 and microbial data are shown. Estimates systematically increase with sample size. Chao2 estimates are calculated by randomly dividing each subsample into four in silico replicates. We observe the same bias with sample size where subsamples were divided into two and three in silico replicates (data not shown). (b,d) DivE (red) is applied to same subsamples as the other estimators. Performance of DivE was evaluated by comparing the error of estimates (Ŝobs), to the (known) number of species Sobs in the full observed data (purple line) and by comparing estimates as a function of sample size. In all datasets, DivE accurately estimates the species richness of the full observed data from subsamples of that data and is unbiased by sample size.
Figure 4.
Figure 4.
Comparison of estimators: effect of sample size on estimated HTLV-1 diversity. Gradients measuring increase in estimated HTLV-1 clonal diversity against increase in sample size. Gradients for each estimator were calculated by linear regression. All estimators except DivE show large gradients that are significantly positive, indicating a bias with sample size. ***p < 0.0001; two-tailed binomial test (n = 14).
Figure 5.
Figure 5.
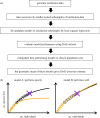
Outline of DivE species richness estimator. (a) Flow chart describing the process to calculate the DivE species richness estimate. (b) Full rarefaction curves shown in black and nested rarefaction subsample shown in orange. Data are denoted by circles, model fits by solid lines. Models are scored according to the following criteria: (i) discrepancy—mean percentage error between data points and model prediction; (ii) accuracy—error between full sample species richness (purple cross) and estimated species richness from subsample; (iii) similarity—area between subsample fit (orange) and full data fit (black) and (iv) plausibility—we require that S′(x) ≥ 0 and S″(x) ≤ 0. Model A performs poorly as criteria (ii) and (iii) are not satisfied. Model B performs well as all criteria are satisfied.

References

    1. Nikolich-Zugich J, Slifka MK, Messaoudi I. 2004. The many important facets of T-cell repertoire diversity. Nat. Rev. Immunol. 4, 123–132. (10.1038/nri1292) - DOI - PubMed
    1. Miles JJ, Douek DC, Price DA. 2011. Bias in the [α][β] T-cell repertoire: implications for disease pathogenesis and vaccination. Immunol. Cell Biol. 89, 375–387. (10.1038/icb.2010.139) - DOI - PubMed
    1. Bianconi E, et al. 2013. An estimation of the number of cells in the human body. Ann. Hum. Biol. 40, 463–471. (10.3109/03014460.2013.807878) - DOI - PubMed
    1. Girardi M. 2006. Immunosurveillance and immunoregulation by [γ][δ] T cells. J. Invest. Dermatol. 126, 25–31. (10.1038/sj.jid.5700003) - DOI - PubMed
    1. Freeman JD, Warren RL, Webb JR, Nelson BH, Holt RA. 2009. Profiling the T-cell receptor beta-chain repertoire by massively parallel sequencing. Genome Res. 19, 1817–1824. (10.1101/gr.092924.109) - DOI - PMC - PubMed

Publication types

Substances