. 2015 Jul 7:6:7495.
doi: 10.1038/ncomms8495.

Identifying active vascular microcalcification by (18)F-sodium fluoride positron emission tomography

Affiliations

Identifying active vascular microcalcification by (18)F-sodium fluoride positron emission tomography

Agnese Irkle et al. Nat Commun. .

Abstract

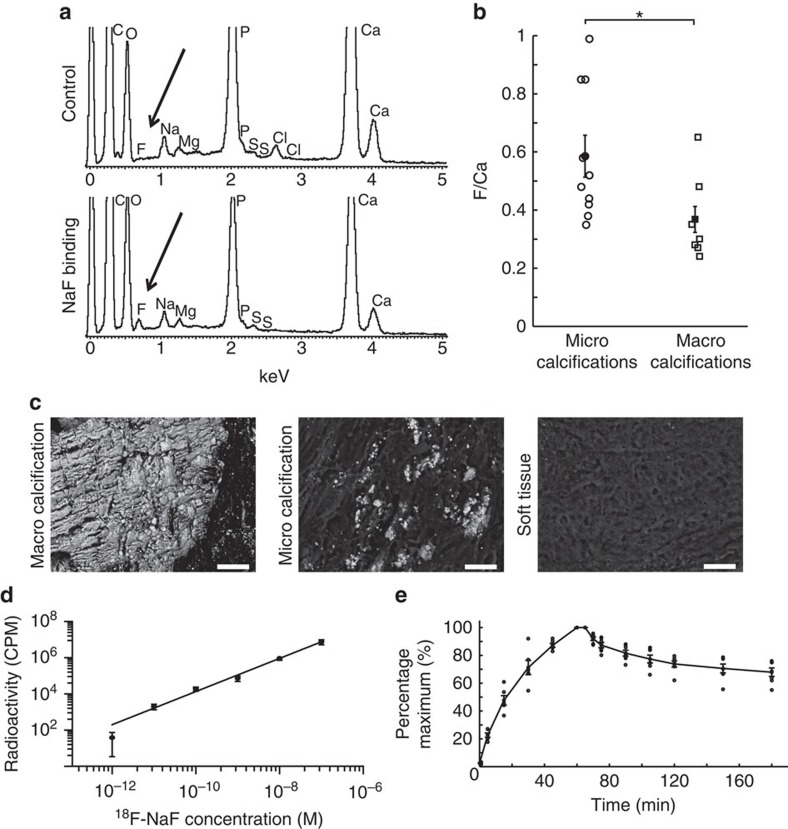
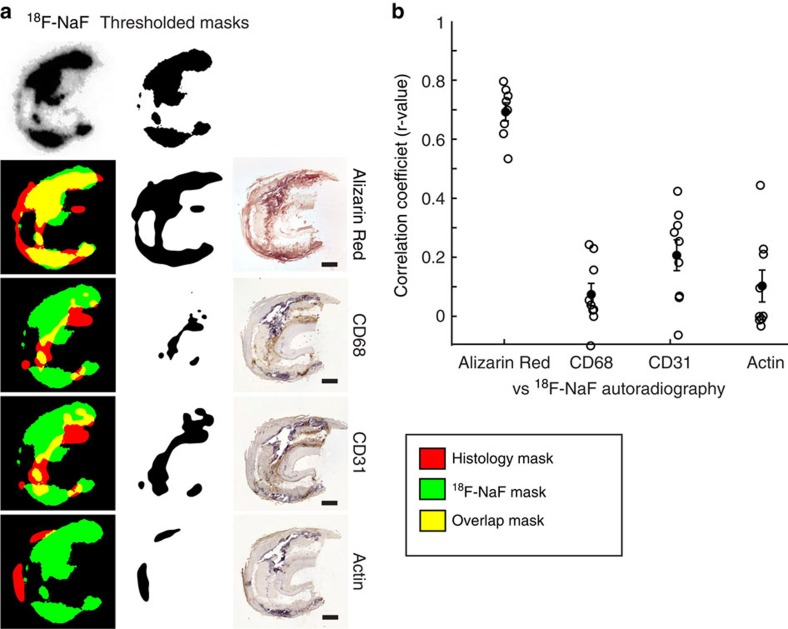
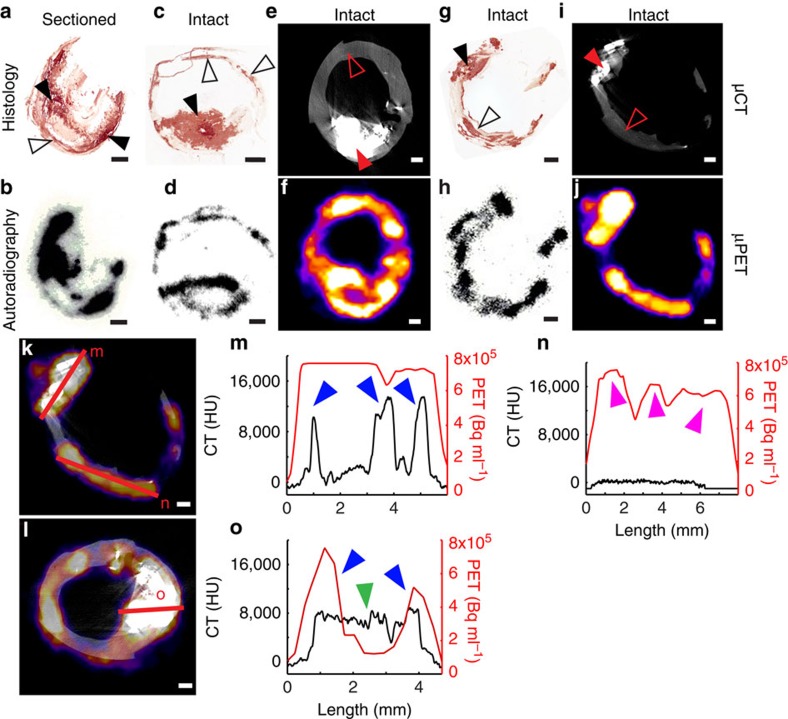
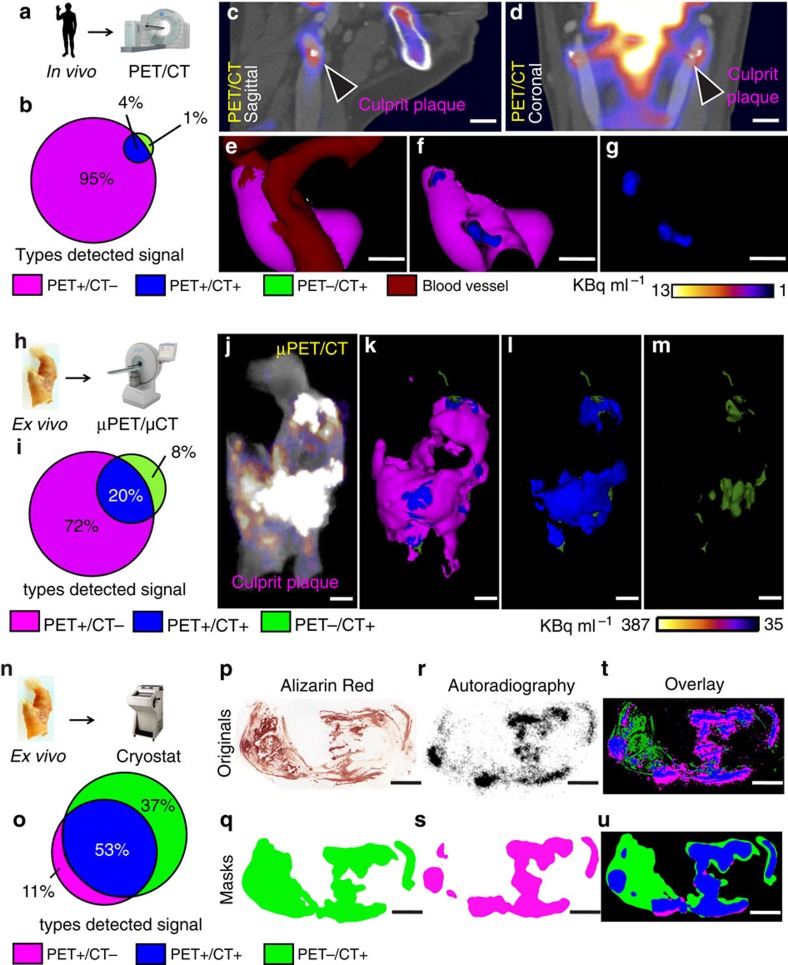
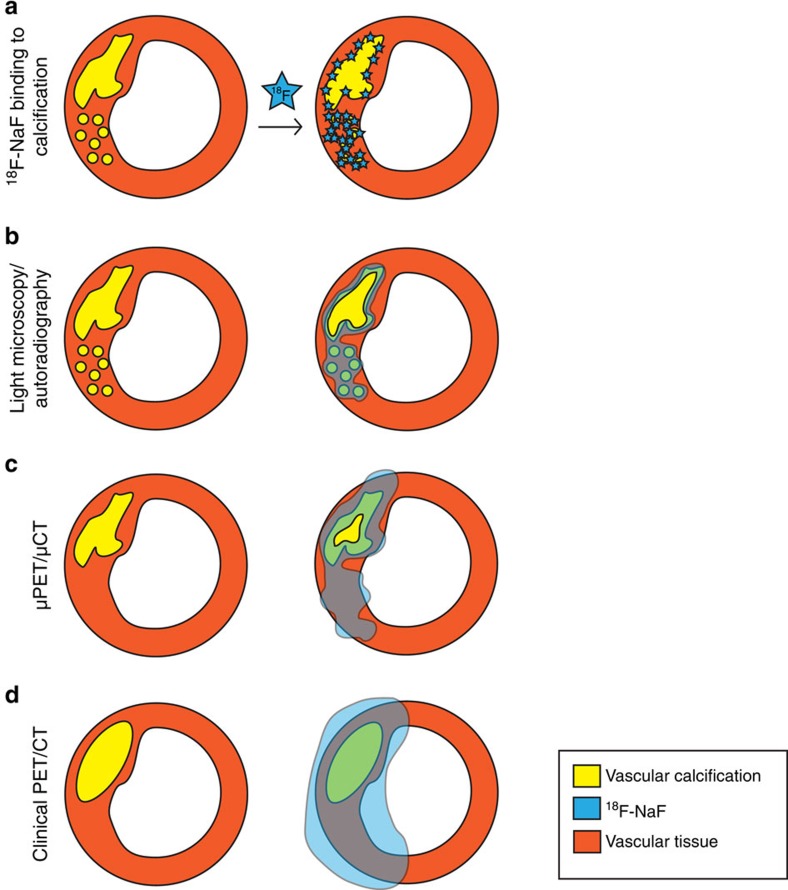
Vascular calcification is a complex biological process that is a hallmark of atherosclerosis. While macrocalcification confers plaque stability, microcalcification is a key feature of high-risk atheroma and is associated with increased morbidity and mortality. Positron emission tomography and X-ray computed tomography (PET/CT) imaging of atherosclerosis using (18)F-sodium fluoride ((18)F-NaF) has the potential to identify pathologically high-risk nascent microcalcification. However, the precise molecular mechanism of (18)F-NaF vascular uptake is still unknown. Here we use electron microscopy, autoradiography, histology and preclinical and clinical PET/CT to analyse (18)F-NaF binding. We show that (18)F-NaF adsorbs to calcified deposits within plaque with high affinity and is selective and specific. (18)F-NaF PET/CT imaging can distinguish between areas of macro- and microcalcification. This is the only currently available clinical imaging platform that can non-invasively detect microcalcification in active unstable atherosclerosis. The use of (18)F-NaF may foster new approaches to developing treatments for vascular calcification.


Figures

Figure 1
Figure 1. F directly co-localizes with Ca in a concentration-dependent manner.
(a) Fluoride peak is detected only in the calcified regions of those carotids that have been exposed to NaF. (b) The amount of fluoride adsorbed to microcalcifications (identified visually based on the size of nodules of <50 and manual measurements made) is significantly higher than macrocalcifications (≥50 μm to several mm; F/Ca in microcalcifications 0.59±0.23, n=10 (circles); in macrocalcifications 0.37±0.15, n=7 (squares)); P<0.02 using an ANOVA and Tukey Kramer post hoc test. (c) Representative images of macro- and microcalcifications and the soft tissue. F presence was detected only in the calcified regions. Scale bar, 50 μm. (d) 18F-NaF binding to cryostat sections is linear over the clinically relevant concentration range from 1.0 × 10⁻¹² to 1.0 × 10⁻⁷ (y=10(0.92*log(x)+13), n=5). (e) There is a fast exponential association and slow exponential dissociation of 18F-NaF to the whole carotids over time. In all figures filled shapes show mean, error bars denote s.e.m.
Figure 2
Figure 2. 18F-NaF uptake correlates with calcification but none of the histological inflammatory markers.
(a) Representative images of 18F-NaF autoradiography signal overlap with IHC-stained sequential sections. Green: 18F-NaF signal, red: histology signal, yellow: overlap. Scale bar, 1 mm. (b) High correlation is observed between 18F-NaF and Alizarin Red calcification staining, while low correlation is seen between 18F-NaF autoradiography and inflammatory marker IHC signals.
Figure 3
Figure 3. 18F-NaF signal detection depends on the sensitivity of the detection modality.
(a,b) If the carotid is sectioned first and incubated in 18F-NaF second, binding occurs to all macro- (closed arrowheads) and microcalcification (open arrowheads) surfaces. (c,d) However, if the carotid is incubated in 18F-NaF first and then sectioned, 18F-NaF is able to bind only to the surface level of macrocalcifications (closed arrowheads), while binding occurs to all microcalcifications (open arrowheads). (e,f) 18F-NaF binding solely to the surface level of macrocalcifications can also be observed in a μPET/μCT scan, if the macrocalcification size is larger than μPET resolution. (g,i) Microcalcifications that are detected with Alizarin Red histology cannot be seen in a μCT scan, due to insufficient sensitivity. (h,j) Yet, 18F-NaF μPET scan closely matches autoradiography signal and can detect microcalcifications. (k,l) μPET/μCT signal quantification by measuring the intensity of the 18F-NaF μPET signal and the μCT density measure along the same transects. (m) 18F-NaF binding can be observed throughout the three macrocalcification peaks due to macrocalcification size being smaller than μPET resolution (PET+/CT+, blue arrowheads); (n) Microcalcifications detected with 18F-NaF μPET and autoradiography (see h) as well as Alizarin Red histology (see g) but not μCT (PET+/CT−, magenta arrowheads); (o) If macrocalcifications are larger than μPET resolution, 18F-NaF binding solely around the surface level of macrocalcifications can be observed, similarly as in autoradiography (center green arrowhead PET−/CT+, blue arrowheads PET+/CT+). Scale bar, 1 mm.
Figure 4
Figure 4. High-resolution imaging reveals specificity of 18F-NaF binding to vascular calcification.
(a) Four symptomatic patients underwent clinical PET/CT imaging after injection of 18F-NaF and before carotid endarterectomy. (b) Comparison of PET and CT signals. Although clinical PET spatial resolution is much less than CT, PET detects larger area than CT, demonstrating higher sensitivity. PET+/CT−: magenta, 95%, PET+/CT+: blue, 4%, PET−/CT+: green, 1%. (c,d) Clinical PET/CT scan with the culprit atheroma (arrowheads). Scale bar, 11 mm (c) Sagittal view; (d) Coronal view. (eg) Analysis of the carotid in vivo, where PET signal (magenta) was detected using observer-independent Otsu histogram-based thresholding. PET signal is co-localized with CT vascular calcification (blue). CT-detected soft tissue is dark red. Scale bar, 7 mm. (h) After endarterectomy, carotids were recovered, incubated in 18F-NaF and scanned in a μPET/μCT scanner. (i) Ratio of PET+/CT− area and CT+ signals is smaller than in b, due to the higher μPET resolution, which results in more precise signal detection. PET+/CT−: magenta, 72%, PET+/CT+: blue, 20%, PET−/CT+: green, 8%. (jm) Ex vivo images of the carotid from the same patient as in cg. (j) μPET/μCT image without thresholding; (km) 3D thresholded μPET/μCT images. μPET signal (magenta), PET+/CT+ (blue), PET−/CT+ (green). (n) After μPET/μCT scan, carotids were incubated in 18F-NaF and sectioned on cryostat. (o) Ratio between PET+/CT− and CT+ regions indicates an even higher PET+/CT− resolution. PET+/CT−: magenta, 11%, PET+/CT+: blue, 53%, PET−/CT+: green, 37%. (p) Carotid from the same patient as in cg, jm. Alizarin Red detects both macro- and microcalcifications with the highest precision of all methods described here. (q) Alizarin Red image after Gaussian filter and Li thresholding, to match resolution to autoradiography image. (r) Autoradiography shows highly specific binding to all microcalcifications, but is not able to penetrate the deeper levels of macrocalcifications. (s) Autoradiography image after Gaussian filter and Li thresholding, to match resolution to the filtered Alizarin Red image. (t) Overlay of unfiltered histology and autoradiography images showing a high PET+/CT− signal, due to mismatch in resolution. (u) Overlay of filtered histology and autoradiography images shows matching signal resolution. Scale bar=3 mm. 3D movies in Supplementary Data.
Figure 5
Figure 5. Our model of 18F-NaF binding to the vascular calcifications.
(a) 18F-NaF highly specifically binds to both micro- and macrocalcifications and the signal strength depends on the available surface area of these calcifications. (b) Schematic of histology/autoradiography vascular calcification detection. Alizarin Red histology results in the most definitive delineation of calcification, with the detection limit into the nanometre range. Phosphor screen autoradiography also has a much higher resolution compared with PET and μPET, resulting in accurate detection of calcifications. (c) Schematic of preclinical μPET/μCT vascular calcification detection. μCT detects macrocalcifications and their finer architecture. Proportionally less signal is detected on μCT than using histology, yet more than the clinical CT. μPET very precisely detects both macro and microcalcifications. In addition, if the macrocalcifications exceed μPET resolution, it is possible to observe 18F-NaF binding to the outer surface of macrocalcifications. There are less PET−/CT+ regions observed than using autoradiography but more than clinical PET/CT. (d) Schematic of clinical PET/CT vascular calcification detection. Here CT is able to detect gross macrocalcifications and PET detects both CT+ and CT− calcifications. However, the signal is diffuse, resulting in much larger and therefore less precise PET+ detections, as compared with the ex vivo imaging modalities described here.

References

    1. Doherty T. M. et al.. Calcification in atherosclerosis: Bone biology and chronic inflammation at the arterial crossroads. Proc. Natl Acad. Sci. USA 100, 11201–11206 (2003). - PMC - PubMed
    1. Demer L. L. & Tintut Y. Mineral exploration: search for the mechanism of vascular calcification and beyond: the 2003 Jeffrey M. Hoeg Award lecture. Arterioscler. Thromb. Vasc. Biol. 23, 1739–1743 (2003). - PubMed
    1. Johnson R. C., Leopold J. A. & Loscalzo J. Vascular calcification—Pathobiological mechanisms and clinical implications. Circ. Res. 99, 1044–1059 (2006). - PubMed
    1. Wu M., Rementer C. & Giachelli C. M. Vascular calcification: an update on mechanisms and challenges in treatment. Calcif. Tissue Int. 93, 365–373 (2013). - PMC - PubMed
    1. Budoff M. J. et al.. Long-term prognosis associated with coronary calcification: observations from a registry of 25,253 patients. J. Am. Coll. Cardiol. 49, 1860–1870 (2007). - PubMed

Publication types