

GntR Family of Bacterial Transcription Factors and Their DNA Binding Motifs: Structure, Positioning and Co-Evolution
- PMID: 26151451
- PMCID: PMC4494728
- DOI: 10.1371/journal.pone.0132618
GntR Family of Bacterial Transcription Factors and Their DNA Binding Motifs: Structure, Positioning and Co-Evolution
Abstract
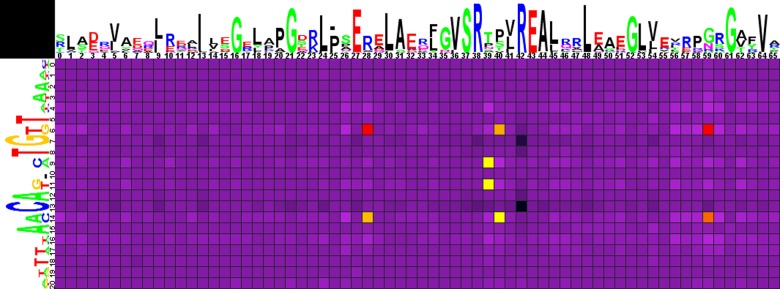
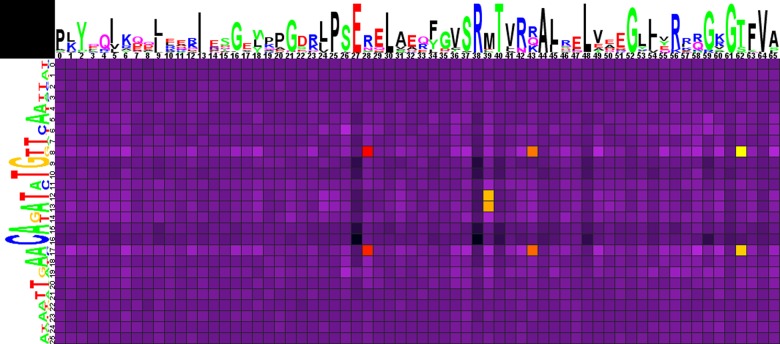
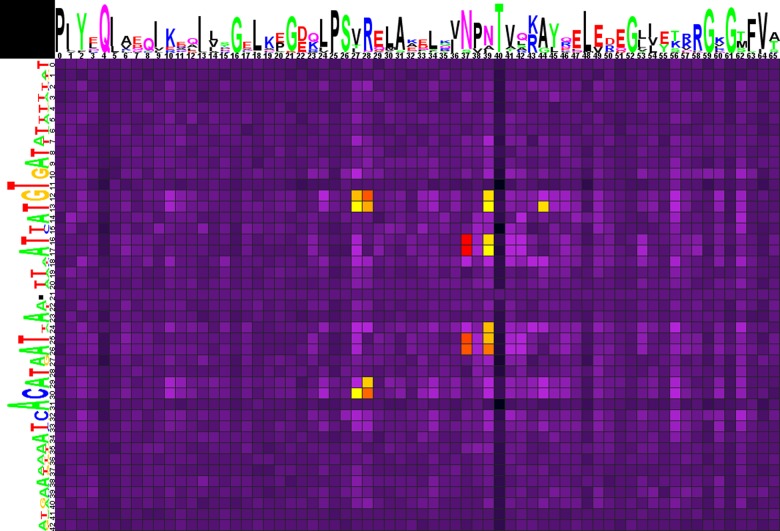
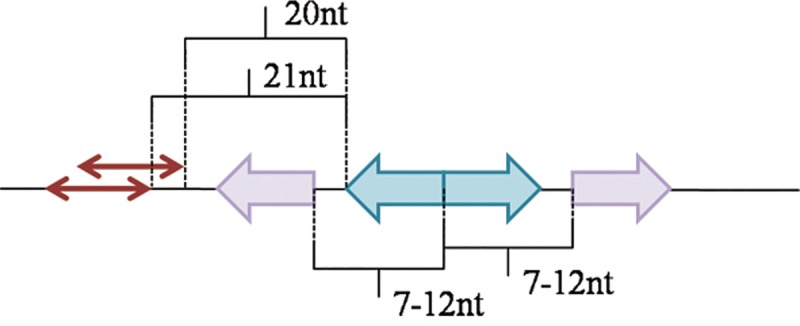
The GNTR family of transcription factors (TFs) is a large group of proteins present in diverse bacteria and regulating various biological processes. Here we use the comparative genomics approach to reconstruct regulons and identify binding motifs of regulators from three subfamilies of the GNTR family, FADR, HUTC, and YTRA. Using these data, we attempt to predict DNA-protein contacts by analyzing correlations between binding motifs in DNA and amino acid sequences of TFs. We identify pairs of positions with high correlation between amino acids and nucleotides for FADR, HUTC, and YTRA subfamilies and show that the most predicted DNA-protein interactions are quite similar in all subfamilies and conform well to the experimentally identified contacts formed by FadR from E. coli and AraR from B. subtilis. The most frequent predicted contacts in the analyzed subfamilies are Arg-G, Asn-A, Asp-C. We also analyze the divergon structure and preferred site positions relative to regulated genes in the FADR and HUTC subfamilies. A single site in a divergon usually regulates both operons and is approximately in the middle of the intergenic area. Double sites are either involved in the co-operative regulation of both operons and then are in the center of the intergenic area, or each site in the pair independently regulates its own operon and tends to be near it. We also identify additional candidate TF-binding boxes near palindromic binding sites of TFs from the FADR, HUTC, and YTRA subfamilies, which may play role in the binding of additional TF-subunits.
Conflict of interest statement
Figures
Similar articles
-
Subdivision of the helix-turn-helix GntR family of bacterial regulators in the FadR, HutC, MocR, and YtrA subfamilies.J Biol Chem. 2002 Apr 12;277(15):12507-15. doi: 10.1074/jbc.M110968200. Epub 2001 Dec 27. J Biol Chem. 2002. PMID: 11756427
-
GntR family of regulators in Mycobacterium smegmatis: a sequence and structure based characterization.BMC Genomics. 2007 Aug 23;8:289. doi: 10.1186/1471-2164-8-289. BMC Genomics. 2007. PMID: 17714599 Free PMC article.
-
Deciphering the regulon of a GntR family regulator via transcriptome and ChIP-exo analyses and its contribution to virulence in Xanthomonas citri.Mol Plant Pathol. 2017 Feb;18(2):249-262. doi: 10.1111/mpp.12397. Epub 2016 Jul 22. Mol Plant Pathol. 2017. PMID: 26972728 Free PMC article.
-
Molecular biology of the LysR family of transcriptional regulators.Annu Rev Microbiol. 1993;47:597-626. doi: 10.1146/annurev.mi.47.100193.003121. Annu Rev Microbiol. 1993. PMID: 8257110 Review.
-
Regulation of bacterial responses to oxidative stress.Curr Top Cell Regul. 1997;35:163-77. doi: 10.1016/s0070-2137(97)80007-6. Curr Top Cell Regul. 1997. PMID: 9192180 Review. No abstract available.
Cited by
-
A Bioinformatics Analysis Reveals a Group of MocR Bacterial Transcriptional Regulators Linked to a Family of Genes Coding for Membrane Proteins.Biochem Res Int. 2016;2016:4360285. doi: 10.1155/2016/4360285. Epub 2016 Jun 30. Biochem Res Int. 2016. PMID: 27446613 Free PMC article.
-
In vivo and in vitro expression of five genes involved in Corynebacterium pseudotuberculosis virulence.AMB Express. 2018 May 30;8(1):89. doi: 10.1186/s13568-018-0598-z. AMB Express. 2018. PMID: 29846821 Free PMC article.
-
High-performance genetically-encoded green and red fluorescent biosensors for pyruvate.bioRxiv [Preprint]. 2025 Jul 9:2025.04.17.649293. doi: 10.1101/2025.04.17.649293. bioRxiv. 2025. PMID: 40631294 Free PMC article. Preprint.
-
MouR controls the expression of the Listeria monocytogenes Agr system and mediates virulence.Nucleic Acids Res. 2018 Oct 12;46(18):9338-9352. doi: 10.1093/nar/gky624. Nucleic Acids Res. 2018. PMID: 30011022 Free PMC article.
-
Transcriptional regulation of a gonococcal gene encoding a virulence factor (L-lactate permease).PLoS Pathog. 2019 Dec 20;15(12):e1008233. doi: 10.1371/journal.ppat.1008233. eCollection 2019 Dec. PLoS Pathog. 2019. PMID: 31860664 Free PMC article.
References
-
- Ofran Y, Mysore V, Rost B. Prediction of DNA-binding residues from sequence. Bioinformatics. 2007. July 1; 23(13):i347–53. - PubMed
Publication types
MeSH terms
Substances
LinkOut - more resources
Full Text Sources
Other Literature Sources
Molecular Biology Databases
Miscellaneous
