. 2015 Jul 7:6:7531.
doi: 10.1038/ncomms8531.

Kindlin-2 controls TGF-β signalling and Sox9 expression to regulate chondrogenesis

Affiliations

Kindlin-2 controls TGF-β signalling and Sox9 expression to regulate chondrogenesis

Chuanyue Wu et al. Nat Commun. .

Abstract

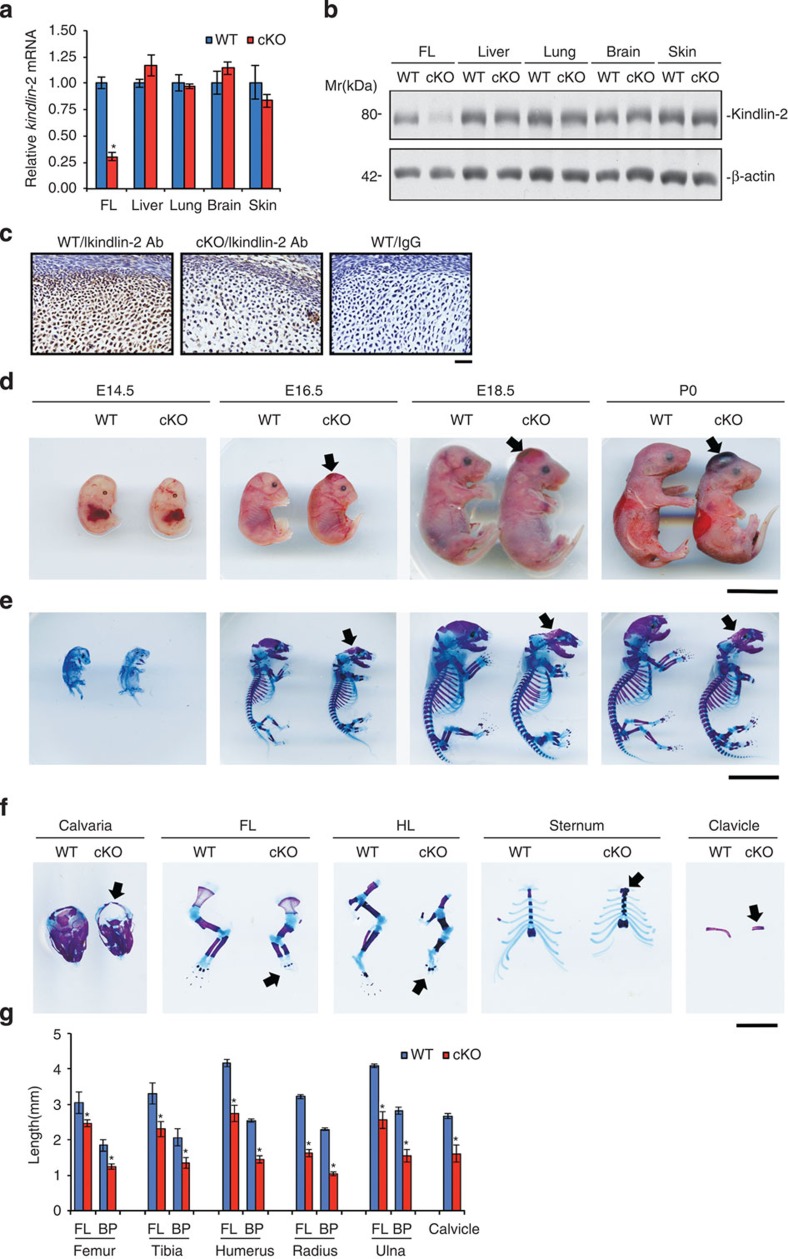
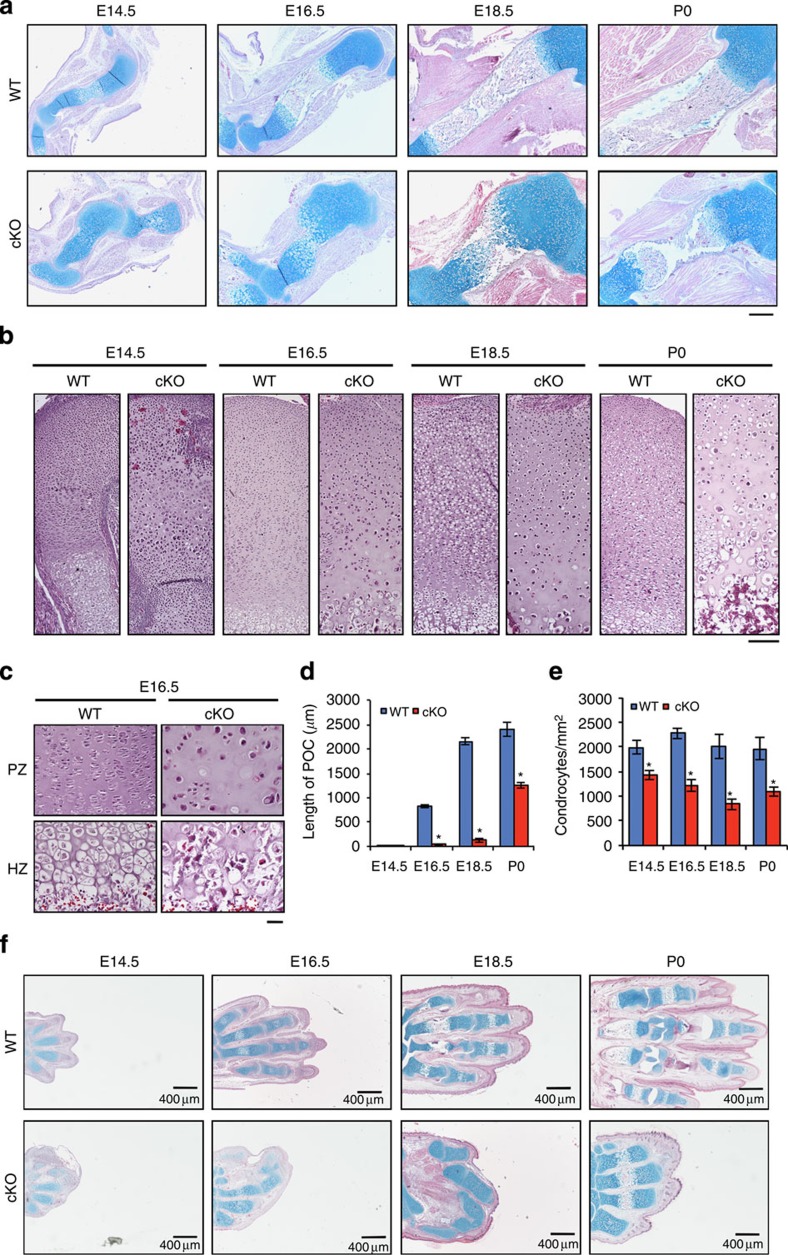
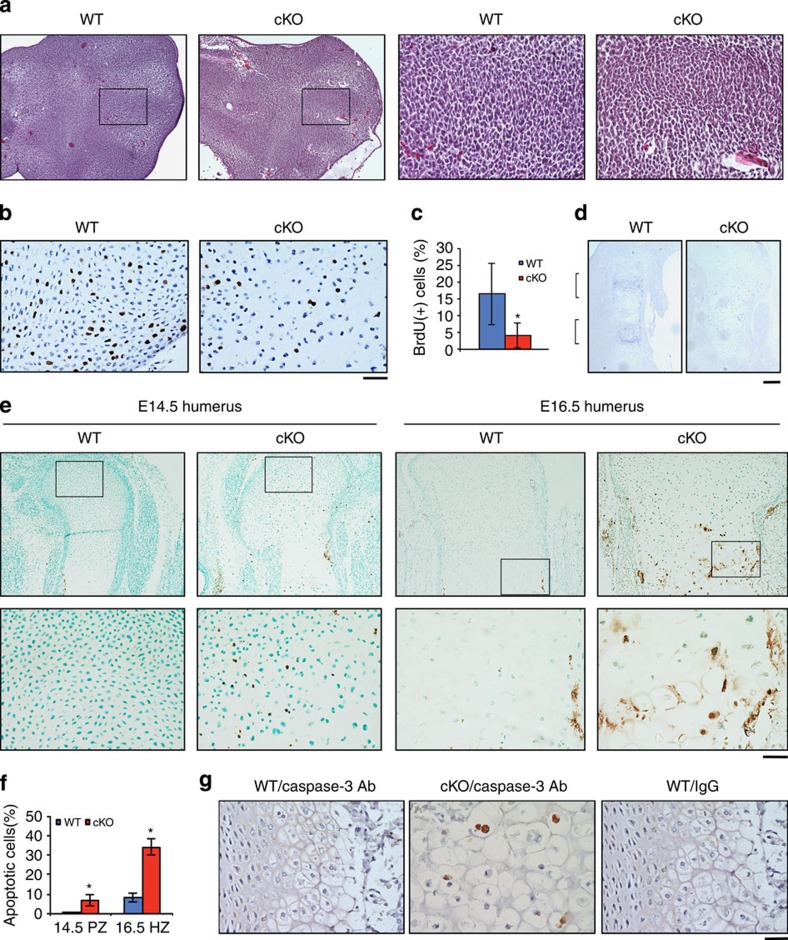
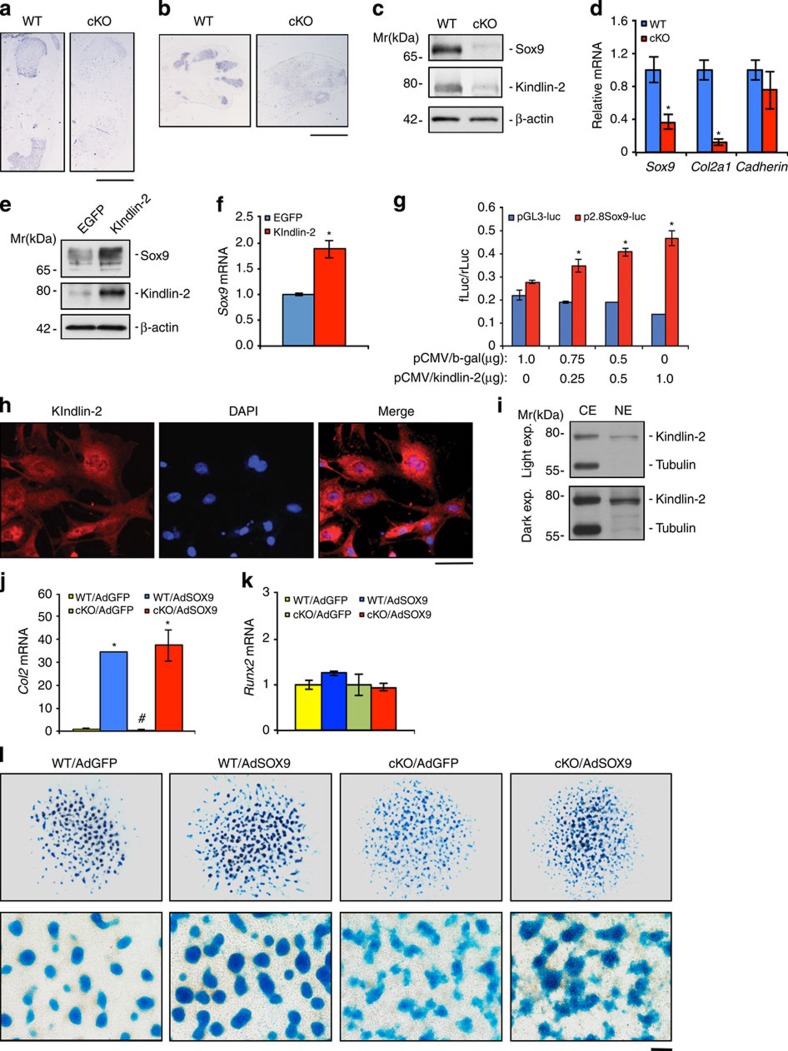
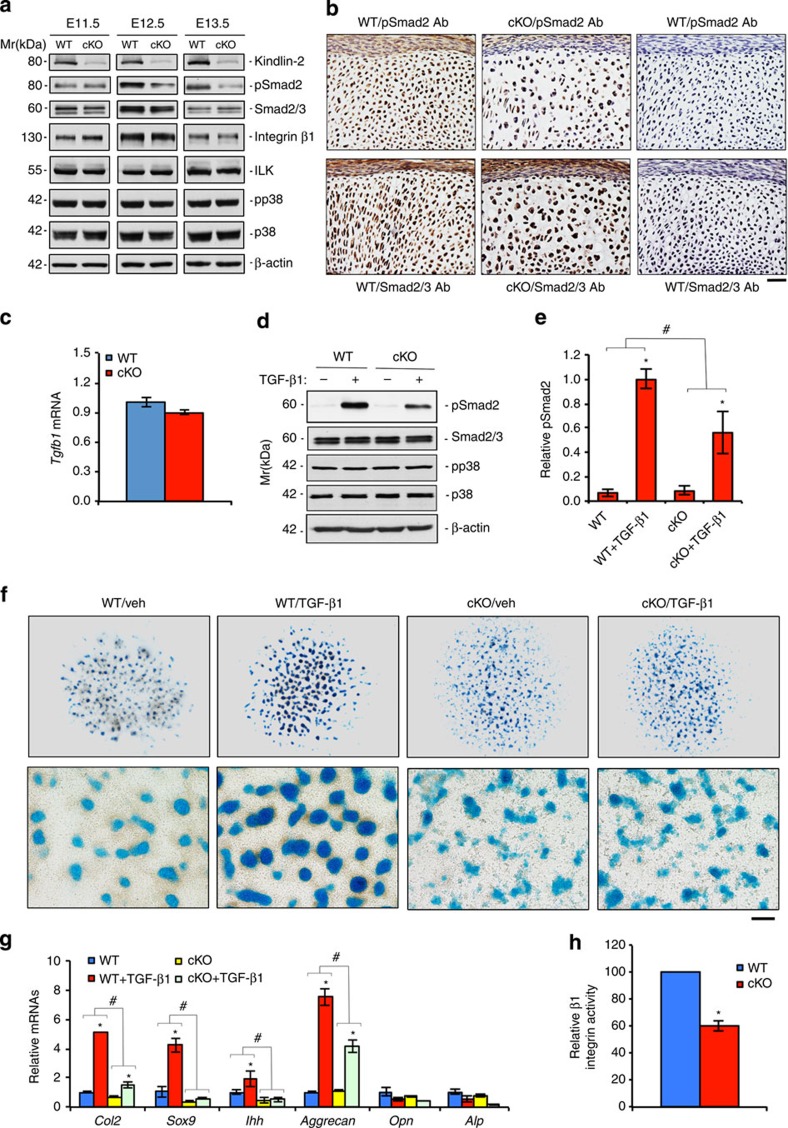
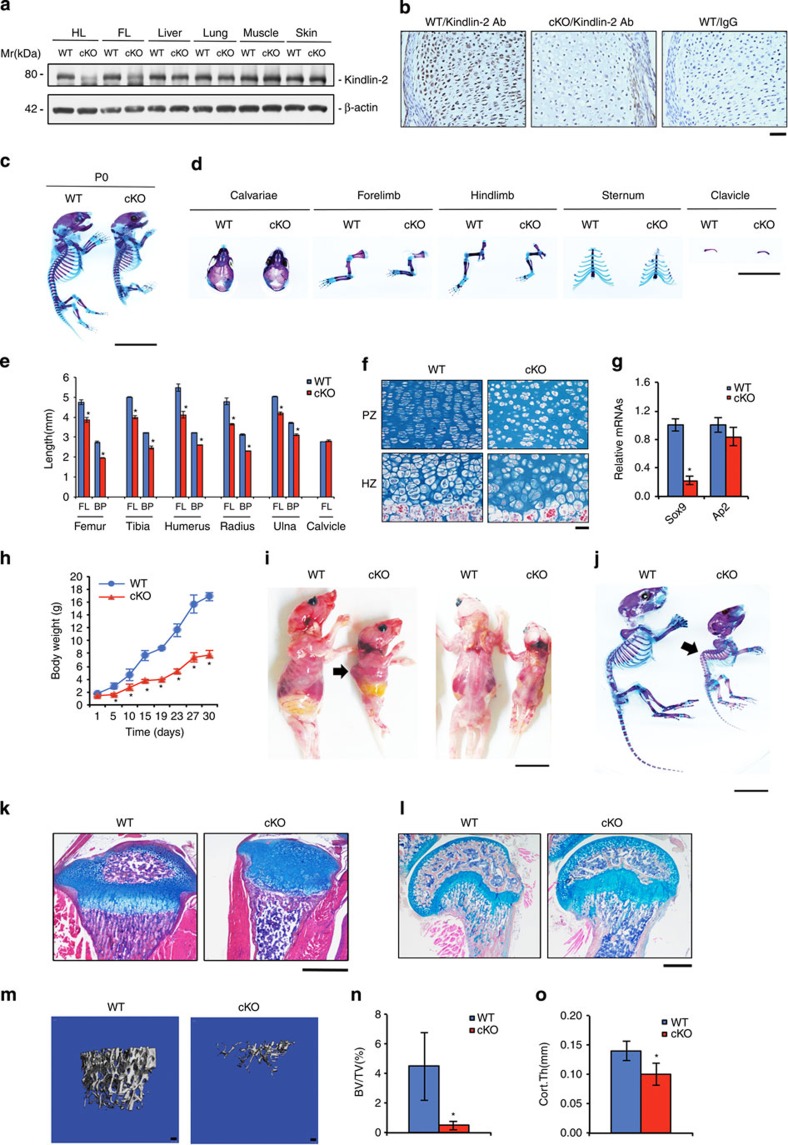
The signals that control skeletogenesis are incompletely understood. Here we show that deleting Kindlin-2 in Prx1-expressing mesenchymal progenitors in mice causes neonatal lethality, chondrodysplasia and loss of the skull vault. Kindlin-2 ablation reduces chondrocyte density by decreasing cell proliferation and increasing apoptosis, and disrupts column formation, thus impairing the formation of the primary ossification center and causing severe limb shortening. Remarkably, Kindlin-2 localizes to not only focal adhesions, but also to the nuclei of chondrocytes. Loss of Kindlin-2 reduces, while the overexpression of Kindlin-2 increases, Sox9 expression. Furthermore, the overexpression of Sox9 restores the defects in chondrogenic differentiation induced by Kindlin-2 deletion in vitro. In addition, Kindlin-2 ablation inhibits TGF-β1-induced Smad2 phosphorylation and chondrocyte differentiation. Finally, deleting Kindlin-2 in chondrocytes directly impairs chondrocyte functions, resulting in progressive dwarfism and kyphosis in mice. These studies uncover a previously unrecognized function for Kindlin-2 and a mechanism for regulation of the chondrocyte differentiation programme and chondrogenesis.


Figures

Figure 1
Figure 1. Kindlin-2Prx1 cKO mice display multiple striking skeletal abnormalities.
(a,b) Quantitative qPCR and western blot analyses. Total RNA or protein extracts isolated from the indicated tissues of E14.5 Kindlin-2Prx1 cKO (cKO) or Cre-negative Kindlin-2fl/fl (WT) littermates were subjected to qPCR (a) or western blot analyses (b) for Kindlin-2 expression. FL, forelimb. Kindlin-2 mRNA was normalized to Gapdh mRNA. β-Actin was used as a loading control. Experiments were repeated three times. *P<0.05, versus WT, Student's t-test. Results were expressed as mean±s.d. (c) Immunohistochemistry. Sections of E14.5 WT and Kindlin-2Prx1 cKO humeri were stained with anti-Kindlin-2 antibody or normal IgG. Note: Kindlin-2 protein is strongly detected in the nuclei of WT chondrocytes, but is dramatically reduced in mutant cells. Scale bar, 40 μm. (d) Gross appearance of E14.5–P0 Kindlin-2Prx1 cKO and WT embryos showing a haematoma on the top of the head of mutants (arrowhead). Scale bar, 0.5 cm. (e) Alizarin red and alcian blue double stain of E14.5–P0 skeletons. Scale bar, 0.5 cm. (f) Calvaria, FL, hindlimb (HL), sternum and clavicle from E18.5 embryos. Complete loss of the skull vault, shortened and broadened scapula, long bone and sternum, hypoplastic clavicle, and blocked (FL) or delayed (HL) elongation of distal phalanges are seen in mutants. Scale bar, 0.5 cm. (g) Quantitative data from F. N=4, *P<0.05, versus WT, Student's t-test. Results were expressed as mean±s.d.
Figure 2
Figure 2. Reduced cellularity and disrupted column formation in Kindlin-2Prx1 cKO.
(a) Alcian blue stain of humeral sections from Cre-negative Kindlin-2fl/fl (WT) and Kindlin-2Prx1 cKO (cKO) mice shows severe delay in POC formation in mutants. Original magnification: × 40. Scale bar, 400 μm. (b) Haematoxylin staining of WT and Kindlin-2Prx1 cKO humeri. Original magnification: × 100. Scale bar, 160 μm. (c) Representative images of the proliferative zone (PZ) and the hypertrophic zone (HZ) of E16.5 WT and Kindlin-2Prx1 cKO humeri shows failure of column formation in mutants. Original magnification: × 400. Scale bar, 40 μm. (d) Quantitation of lengths of humeral POCs from a, N=4, *P<0.05, versus WT, Student's t-test. Results were expressed as mean±s.d. (e) Quantitation of chondrocyte density of humeral growth plates in b. N=4, *P<0.05, versus WT, Student's t-test. Results were expressed as mean±s.d. (f) Alcian blue stain of WT and Kindlin-2Prx1 cKO forelimb digits shows blocked elongation of digits and delayed formation of ossification centres in the phalange bones. Scale bar, 400 μm.
Figure 3
Figure 3. Kindlin-2 is critical for chondrocyte proliferation and survival.
(a) Haematoxylin stain of E12.5 Cre-negative Kindlin-2fl/fl (WT) and Kindlin-2Prx1 cKO (cKO) forelimb bud sections shows normal mesenchymal condensation and cell density in mutants. Original magnification: × 100 (two left lanes), × 400 (two right lanes). Scale bar, 160 μm (right), 40 μm (left). (b) BrdU staining of E14.5 WT and Kindlin-2Prx1 cKO humeral sections. Original magnification: × 400. Scale bar, 40 μm. (c) Quantitation of BrdU-positive cells from b. N=4, *P<0.05, versus WT, Student's t-test. (d) In situ hybridization. E14.5 WT and Kindlin-2Prx1 cKO humeral sections were hybridized with an antisense riboprobe for Ihh. Scale bar, 160 μm. (e) TUNEL stain of E14.5 (left) and E16.5 (right) WT and Kindlin-2Prx1 cKO humeral sections. Representative lower magnification images ( × 100, top) and higher magnification images of the boxed areas ( × 400, bottom) are shown. Scale bar, 160 μm (top), 40 μm (bottom). (f) Quantitation of apoptotic cells of the proliferative zones (PZ) and hypertrophic zones (HZ). N=4, *P<0.05, versus WT, Student's t-test. Results were expressed as mean±s.d. (g) Immunohistochemical staining of E14.5 WT and Kindlin-2Prx1 cKO humeral sections for cleaved (active) caspase-3 in chondrocytes. Scale bar, 40 μm.
Figure 4
Figure 4. Kindlin-2 regulates Sox9 expression in chondrocytes.
(a,b) In situ hybridization. E16.5 Cre-negative Kindlin-2fl/fl (WT) and Kindlin-2Prx1 cKO (cKO) humeral (a) and forelimb digit (b) sections hybridized with antisense riboprobes for Sox9. Original magnification: × 40. Scale bar, 400 μm. (c) Protein extracts from E16.5 WT and Kindlin-2Prx1 cKO forelimbs used for western blotting for Sox9 expression. (d) Primary mesenchymal progenitors isolated from E13.5 Kindlin-2Prx1 cKO and WT limbs were differentiated for 4 days and analysed by qPCR for Sox9, Col2a1 and cadherin expression, normalized to Gapdh mRNA. Experiments were repeated three times. *P<0.05, versus WT, Student's t-test. Results were expressed as mean±s.d. (e,f) ATDC5 chondrocytes were infected with equal amounts of adenoviral vectors for enhanced green fluorescent protein (Ad/EGFP) or Ad/Kindlin-2, followed by western blotting (e) or qPCR analyses (f) for Sox9 expression. Experiments were repeated three times. *P<0.05, versus WT, Student's t-test. Results were expressed as mean±s.d. (g) COS-7 cells were co-transfected with p2.8Sox9-luc, pRL-SV40 (for normalization), and the indicated amounts of pCMV/Kindlin-2 or pCMV/β-gal, followed by dual-luciferase assays. The amount of plasmid DNA was balanced as necessary with pCMV/β-gal such that the total DNA was constant for each group. Experiments were repeated three times. *P<0.05 versus 0 μg expression vectors, Student's t-test. (h) Primary chondrocytes from E13.5 WT ribcages stained with an anti-Kindlin-2 antibody or 4′,6-diamidino-2-phenylindole, followed by fluorescence (IF) microscopy for localization of Kindlin-2. Scale bar, 50 μm. (i) Cytoplasmic (CE) and nuclear extracts (NE) from ATDC5 cells subjected to western blotting for Kindlin-2 and tubulin (a cytoplasmic protein). (jl) Primary mesenchymal progenitor cells isolated from E13.5 Kindlin-2Prx1 cKO and WT limbs were infected with Ad/Sox9 or an equal amount of Ad/GFP. Four days later, the cells were cultured in the presence of 2 ng ml−1 TGF-β1 for another 6 days, followed by qPCR analyses for Col2a1 (J) and Runx2 (K), or alcian blue staining (L). mRNA levels were normalized to Gapdh mRNA. *P<0.05 (versus WT/AdGFP or cKO/AdGFP, Student's t-test). #P<0.05 (versus WT/AdGFP, Student's t-test). Experiments were repeated in triplicates. Scale bar, 800 μm (top), 160 μm (bottom). Results were expressed as mean±s.d.
Figure 5
Figure 5. Kindlin-2 modulates TGF-β1 signalling during chondrocyte differentiation.
(a) Protein extracts from E11.5–13.5 Cre-negative Kindlin-2fl/fl (WT) and Kindlin-2Prx1 cKO (cKO) forelimbs were used for western blotting for the indicated proteins. (b) Immunohistochemistry. Sections of E12.5 WT and Kindlin-2Prx1 cKO forelimbs stained with antibodies against pSmad2 antibody (top) or total Smad2/3 (bottom). Scale bar, 40 μm. (c) Total RNA from E15.5 WT and Kindlin-2Prx1 cKO forelimbs were subjected to qPCR analysis for Tgf1 mRNA, which was normalized to Gapdh mRNA. Results were expressed as mean±s.d. N=4. (d) Primary cells isolated from E12.5 WT and Kindlin-2Prx1 cKO forelimbs were treated with or without 2 ng ml−1 TGF-β1 for 30 min, followed by western blotting for the indicated proteins. (e) Quantitative data of pSmad2 from four independent experiments. *P<0.05 (versus no TGF-β1); #P<0.05 (TGF-β1-induced fold increases of pSmad2 levels in cKO versus those in WT), Student's t-test. Results were expressed as mean±s.d. Experiments were repeated three times. (f,g) Primary mesenchymal progenitor cells isolated from E12.5 WT and Kindlin-2Prx1 cKO limbs were treated with 2 ng ml−1 TGF-β1 for 7 days, followed by alcian blue staining for chondrogenic nodules (F) or qPCR analysis (G). *P<0.05 (versus no TGF-β1); #P<0.05 (TGF-β1-induced fold increases of mRNA levels in cKO versus those in WT), Student's t-test. Experiments were repeated three times in triplicate. Scale bar, 800 μm (top), 160 μm (bottom). Results were expressed as mean±s.d. (h) β1 integrin activation. Primary mesenchymal progenitors isolated from E12.5 WT and Kindlin-2Prx1 cKO limbs were subjected to measurement of β1 integrin activation as described in Methods. Experiments were repeated three times independently. *P<0.05 (versus WT), Student's t-test. Results were expressed as mean±s.d.
Figure 6
Figure 6. Deleting Kindlin-2 in chondrocytes causes multiple severe skeletal defects.
(a) Protein extracts were isolated from the indicated tissues of P0 Cre-negative Kindlin-2fl/fl (WT) and Kindlin-2Col2a1 cKO (cKO) mice, followed by western blot analysis for Kindlin-2 expression. β-Actin was used as a loading control. FL, forelimb; HL, hindlimb. (b) Immunohistochemistry. Sections of P0 WT and Kindlin-2Col2a1 cKO humeri stained with anti-Kindlin-2 antibody or normal IgG. Scale bar, 40 μm. (c) Alizarin red and alcian blue double stain of P0 WT and Kindlin-2Col2a1 cKO skeletons. Scale bar, 1 cm. (d) Calvaria, limb, sternum and clavicle from P0 WT and Kindlin-2Col2a1 cKO embryos. (e) Quantitation of P0 bone length. N=4, *P<0.05, versus WT, Student's t-test. Scale bar, 1 cm. (f) Alcian blue stain of P0 humeral sections. Representative images of proliferative (PZ) and hypertrophic zone (HZ) chondrocytes show disrupted column formation in mutants. Original magnification, × 400. Scale bar, 40 μm. (g) Primary chondrocytes isolated from P3 ribcages of Kindlin-2Col2a1 cKO and WT were differentiated with 2 ng ml−1 TGF-β1 for 7 days, followed by qPCR analysis for Sox9 and Ap2 expression normalized to Gapdh mRNA. (h) Animal growth curves. N=4, *P<0.05, versus WT, Student's t-test. Results were expressed as mean±s.d. (i) Gross appearance of P20 Kindlin-2Col2a1cKO and WT mice shows severe dwarfism and kyphosis. Scale bar, 1 cm. (j) Alizarin red and alcian blue double staining of P20 skeletons reveals reduced skeleton size and severe kyphosis in mutants. Scale bar, 1 cm. (k,l) Alcian blue stain of P17 (K) and P30 (L) tibial sections show delayed formation of the secondary ossification center and reduced subchondral bone in mutants. Scale bar, 400 μm. (m) Three-dimensional reconstruction from microcomputerized tomography (μCT) scans of femurs from 1-month-old female mice of the two genotypes. Scale bar, 100 μm. (n,o) Quantitative analyses of bone volume/tissue volume (BV/TV) and cortical bone thickness (Cort.Th) from L. *P<0.05 (versus WT), Student's t-test, N=4. Results were expressed as mean±s.d.

Similar articles

Cited by

References

    1. Long F. Building strong bones: molecular regulation of the osteoblast lineage. Nat. Rev. Mol. Cell Biol. 13, 27–38 (2012). - PubMed
    1. Mackie E. J., Ahmed Y. A., Tatarczuch L., Chen K. S. & Mirams M. Endochondral ossification: how cartilage is converted into bone in the developing skeleton. Int. J. Biochem. Cell Biol. 40, 46–62 (2008). - PubMed
    1. Akiyama H., Chaboissier M. C., Martin J. F., Schedl A. & de Crombrugghe B. The transcription factor Sox9 has essential roles in successive steps of the chondrocyte differentiation pathway and is required for expression of Sox5 and Sox6. Genes Dev. 16, 2813–2828 (2002). - PMC - PubMed
    1. Leung V. Y. et al.. SOX9 governs differentiation stage-specific gene expression in growth plate chondrocytes via direct concomitant transactivation and repression. PLoS Genet. 7, e1002356 (2011). - PMC - PubMed
    1. de Crombrugghe B. et al.. Transcriptional mechanisms of chondrocyte differentiation. Matrix Biol. 19, 389–394 (2000). - PubMed

Publication types

MeSH terms