The Immune Interplay between Thyroid Papillary Carcinoma and Hepatic Fibrosis
- PMID: 26151749
- PMCID: PMC4494806
- DOI: 10.1371/journal.pone.0132463
The Immune Interplay between Thyroid Papillary Carcinoma and Hepatic Fibrosis
Abstract
Background: A high prevalence of thyroid papillary cancer was reported in hepatitis-C-virus (HCV) positive patients. However, the mechanistic role of hepatic-fibrosis in thyroid malignancy progressions is still unclear.
Aim: We aimed to study the immune-modulatory interactions between thyroid papillary carcinoma and hepatic-fibrosis.
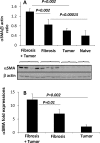
Methods: Hepatic-fibrosis was induced in nude-nu-male mice by intra-peritoneal administration of carbon-tetrachloride. To induce thyroid-tumor, a thyroid papillary carcinoma cell line (NPA) was injected subcutaneously in the backs. Fibrotic profile was estimated by α-smooth-muscle-actin (αSMA) expression in liver tissue extracts using western-blots and RT-PCR. Intra-hepatic NK cells were isolated and stained for NK activity (CD107a) by flow cytometry. Liver histopathology (H&E staining), thyroid tumor mass and serum alanine aminotransferase (ALT), serum vascular endothelial growth factor (VEGF) and free-T4 levels were also assessed.
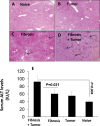
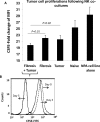
Results: Ex-vivo: NPA cells were co-cultured with intra-hepatic NK cells isolated from fibrotic mice with/without the tumor were analyzed for CFSE-proliferations. Both tumor groups (with/without hepatic-fibrosis) excreted higher serum free T4 levels. Hepatic-fibrosis increased tumor weight and size and serum free-T4 levels. In addition, tumor induction increased liver injury (both hepatic-fibrosis, necro-inflammation and serum ALT levels). In addition, tumor-bearing animals with hepatic-fibrosis had increased NK activity. NPA tumor-bearing animals increased fibrosis in spite of increased NK activity; probably due to a direct effect through increased serum free-T4 excretions. Serum VEGF levels were significantly increased in the fibrotic- bearing tumor groups compared to the non-fibrotic groups. In-vitro, NK cells from fibrotic tumor-bearing animals reduced proliferation of NPA cells. This decrease is attributed to increase NK cells activity in the fibrotic animals with the NPA tumors.
Conclusions: Our results propose that NK cells although were stimulated in advanced fibrosis with tumor, they lost their anti-tumor and anti-fibrotic activity probably due to secretions of T4 and VEFG and may explain increased risk of thyroid tumors in chronic HCV patients.
Conflict of interest statement
Figures


Similar articles
-
The pro-fibrotic effects of pregnancy in a carbon-tetrachloride-induced liver injury in mouse model.Liver Int. 2014 Sep;34(8):1232-40. doi: 10.1111/liv.12371. Epub 2013 Dec 10. Liver Int. 2014. PMID: 24325428
-
Amelioration of hepatic fibrosis by NK cell activation.Gut. 2011 Jan;60(1):90-8. doi: 10.1136/gut.2010.211136. Epub 2010 Jul 26. Gut. 2011. PMID: 20660699
-
Cultured Mycelium Cordyceps sinensis allevi¬ates CCl4-induced liver inflammation and fibrosis in mice by activating hepatic natural killer cells.Acta Pharmacol Sin. 2016 Feb;37(2):204-16. doi: 10.1038/aps.2015.129. Epub 2015 Nov 23. Acta Pharmacol Sin. 2016. PMID: 26592510 Free PMC article.
-
Impaired CD4⁺ T cell stimulation of NK cell anti-fibrotic activity may contribute to accelerated liver fibrosis progression in HIV/HCV patients.J Hepatol. 2013 Sep;59(3):427-33. doi: 10.1016/j.jhep.2013.04.029. Epub 2013 May 9. J Hepatol. 2013. PMID: 23665286
Cited by
-
The Potential Role of Virus Infection in the Progression of Thyroid Cancer.World J Oncol. 2024 Jun;15(3):382-393. doi: 10.14740/wjon1830. Epub 2024 Apr 15. World J Oncol. 2024. PMID: 38751704 Free PMC article. Review.
References
-
- Sarlis NJ. Expression patterns of cellular growth-controlling genes in non-medullary thyroid cancer: basic aspects. Reviews in Endocrine Metabolic Disorders. 2000; 1: 183–196. - PubMed
-
- Segev DL, Umbricht C, Zeiger MA. Molecular pathogenesis of thyroid cancer. Surgical Oncology. 2003; 12: 69–90. - PubMed
MeSH terms
Substances
LinkOut - more resources
Full Text Sources
Other Literature Sources
Medical
Molecular Biology Databases
Research Materials

