. 2015 Jul 3;16(7):15031-56.
doi: 10.3390/ijms160715031.

Differences between Mice and Humans in Regulation and the Molecular Network of Collagen, Type III, Alpha-1 at the Gene Expression Level: Obstacles that Translational Research Must Overcome

Affiliations

Differences between Mice and Humans in Regulation and the Molecular Network of Collagen, Type III, Alpha-1 at the Gene Expression Level: Obstacles that Translational Research Must Overcome

Lishi Wang et al. Int J Mol Sci. .

Abstract

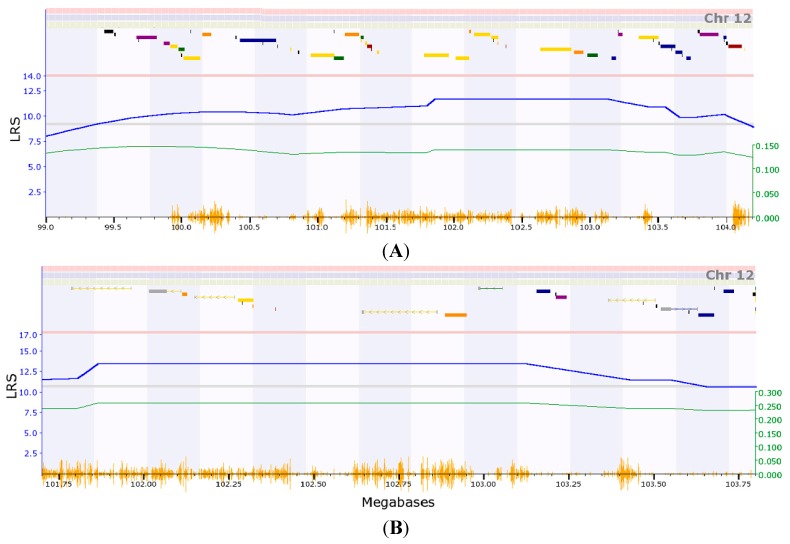
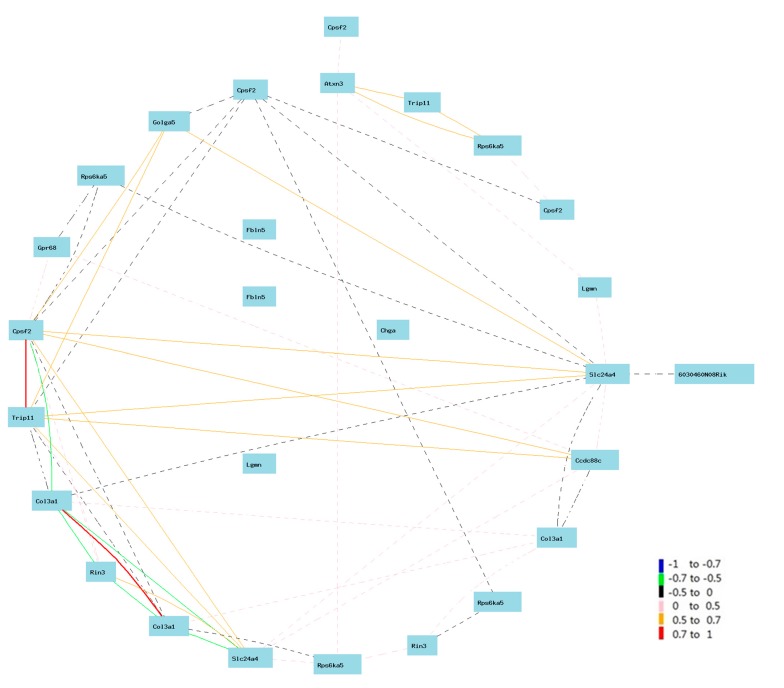
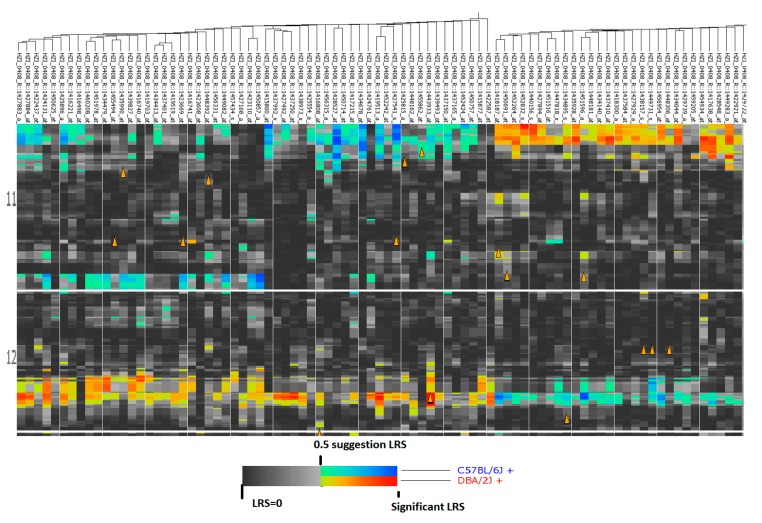
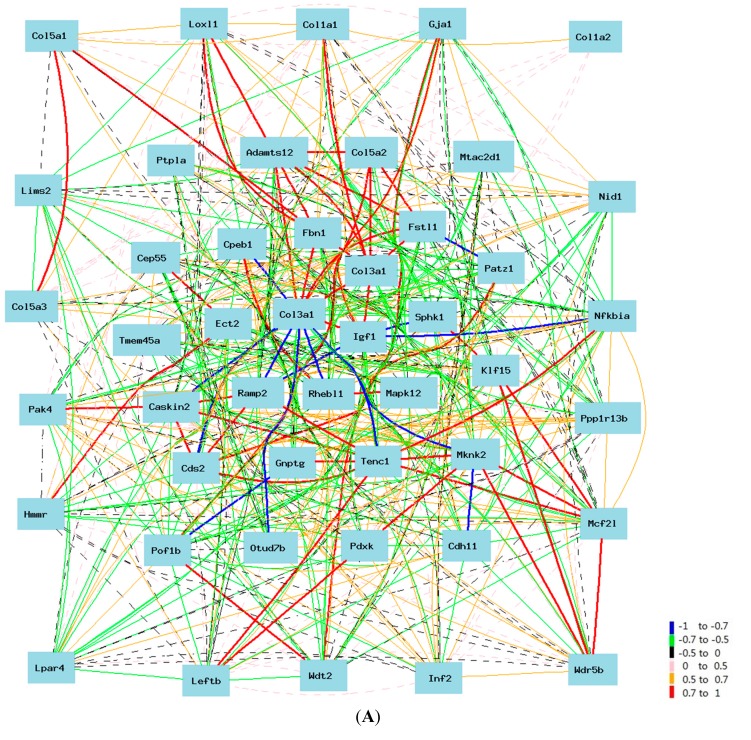
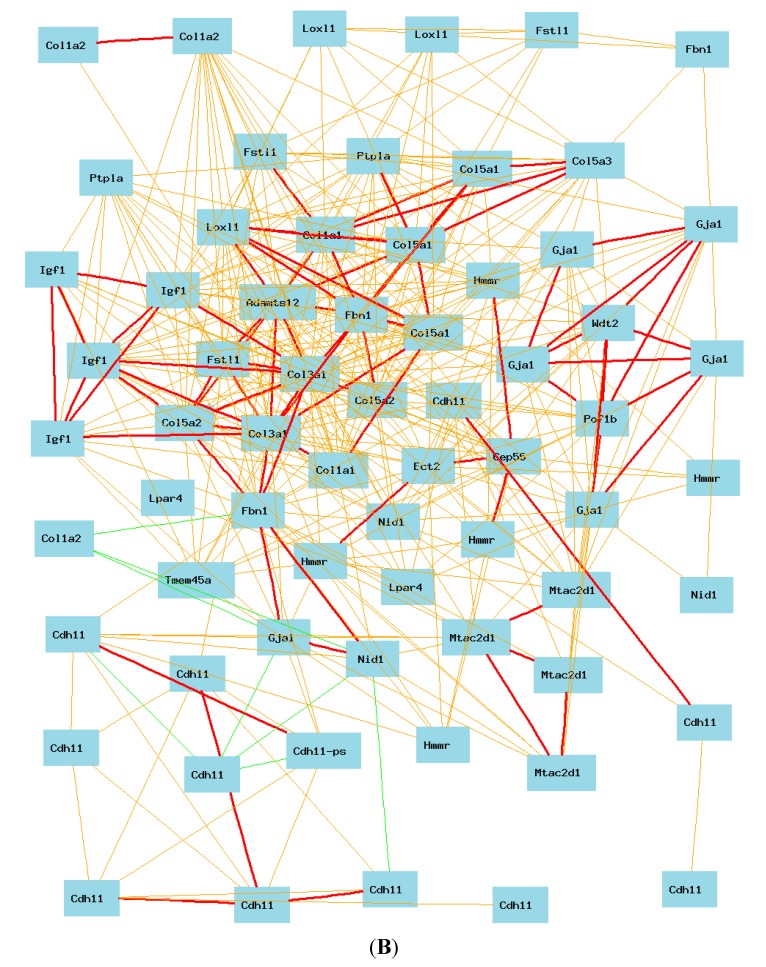
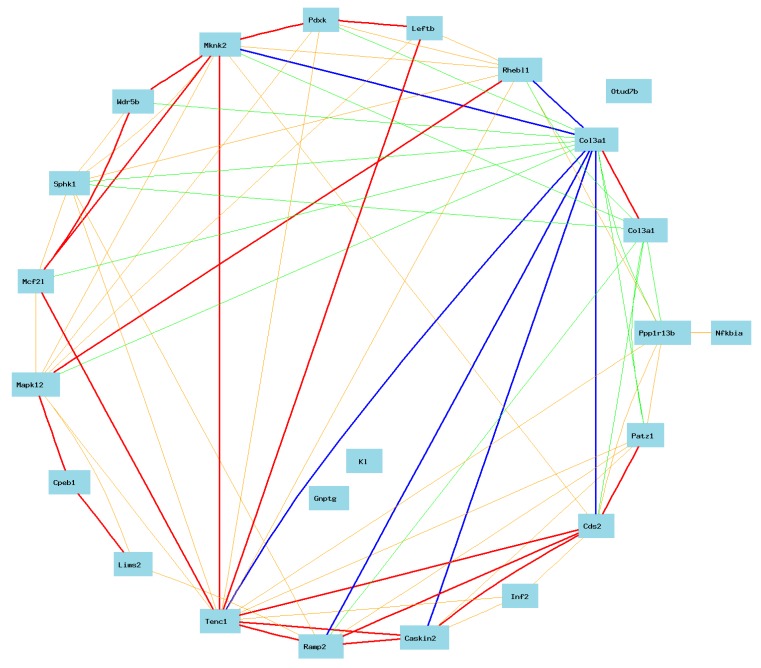
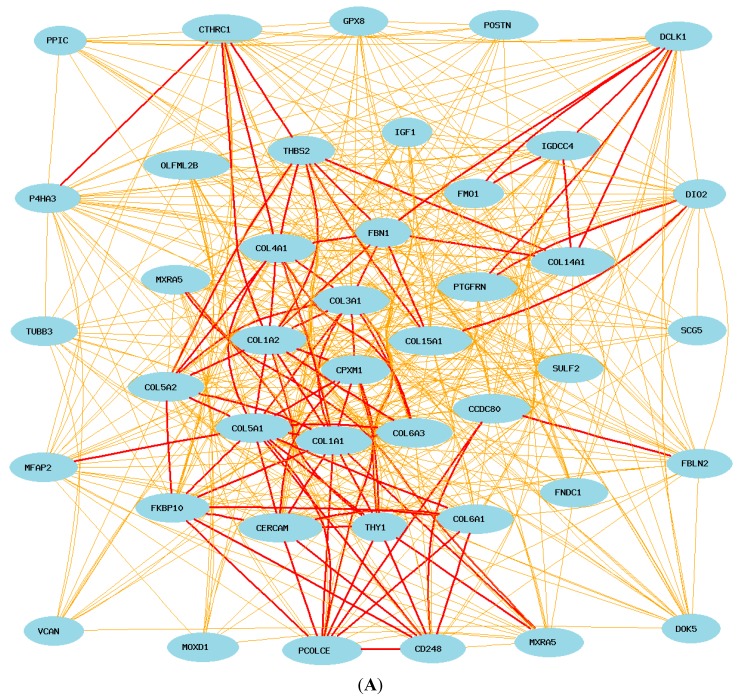
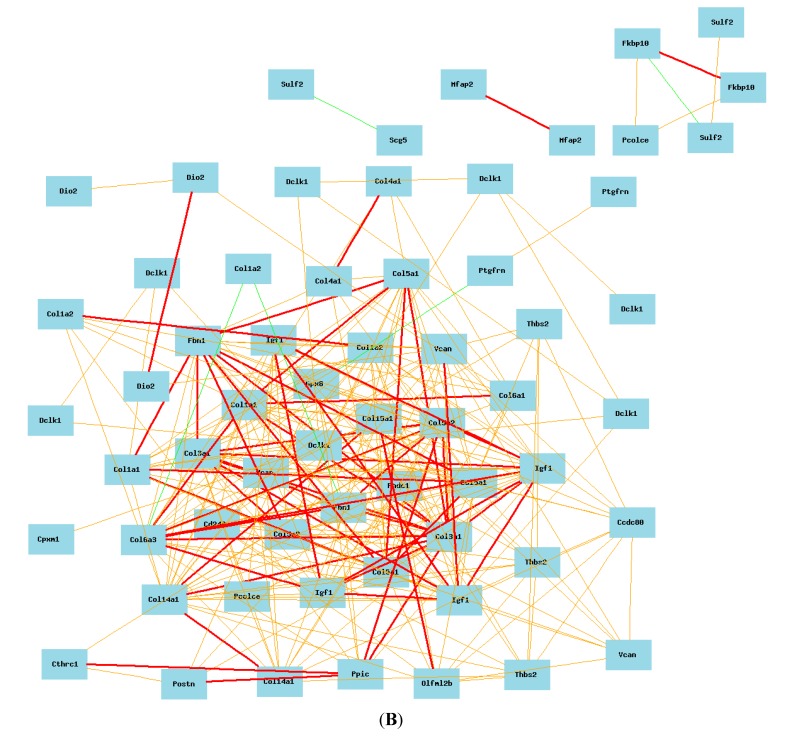
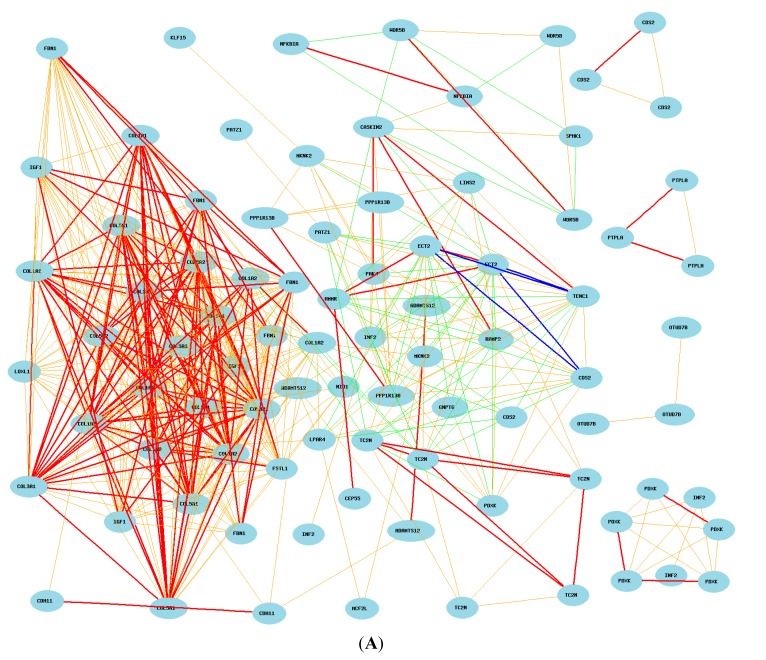
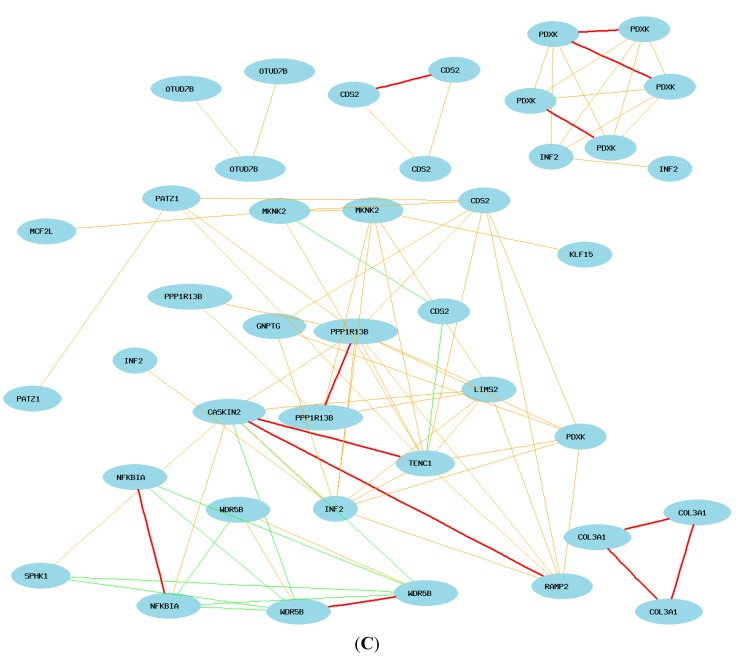
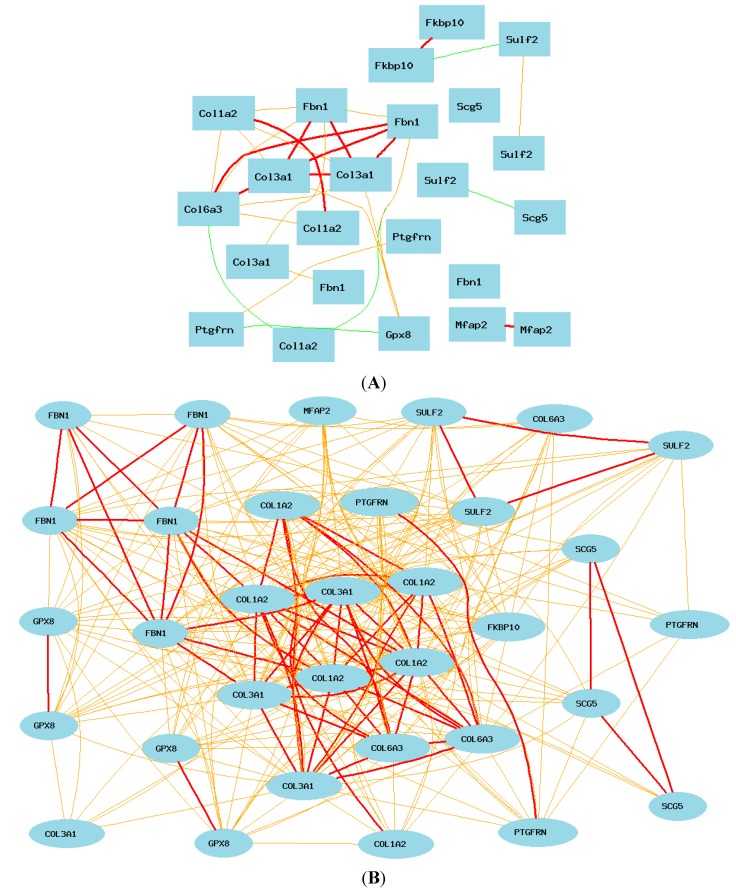
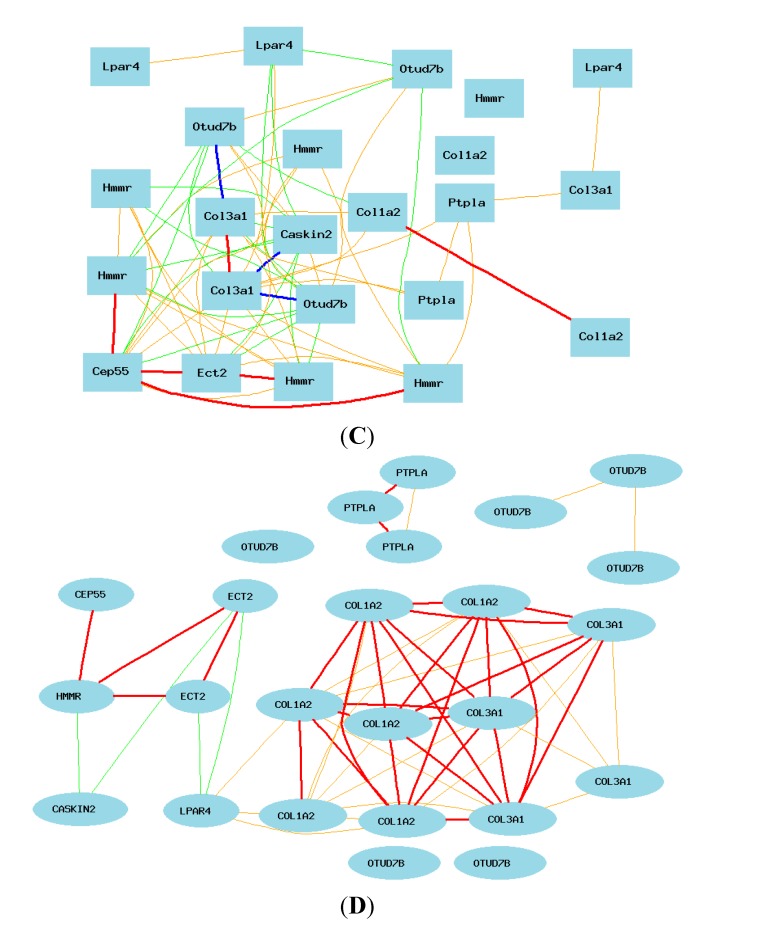
Collagen, type III, alpha-1 (COL3A1) is essential for normal collagen I fibrillogenesis in many organs. There are differences in phenotypes of mutations in the COL3A1 gene in humans and mutations in mice. In order to investigate whether the regulation and gene network of COL3A1 is the same in healthy populations of mice and humans, we compared the quantitative trait loci (QTL) that regulate the expression level of COL3A1 and the gene network of COL3A1 pathways between humans and mice using whole genome expression profiles. Our results showed that, for the regulation of expression of Col3a1 in mice, an eQTL on chromosome (Chr) 12 regulates the expression of Col3a1. However, expression of genes in the syntenic region on human Chr 7 has no association with the expression level of COL3A1. For the gene network comparison, we identified 44 top genes whose expression levels are strongly associated with that of Col3a1 in mice. We next identified 41 genes strongly associated with the expression level of COL3A1 in humans. There are a few but significant differences in the COL3A1 gene network between humans and mice. Several genes showed opposite association with expression of COL3A1. These genes are known to play important roles in development and function of the extracellular matrix of the lung. Difference in the molecular pathway of key genes in the COL3A1 gene network in humans and mice suggest caution should be used in extrapolating results from models of human lung diseases in mice to clinical lung diseases in humans. These differences may influence the efficacy of drugs in humans whose development employed mouse models.

Keywords: COL3A1; gene network; human; lung fibrosis; mouse.


Figures

Figure 1
Figure 1
The expression quantitative trait loci (eQTL) that regulates the expression level of Collagen, type III, alpha-1 (Col3a1). (A) eQTL on chromosome (Chr) 12 located between 99 MB (million bases) and 104 detected with probe 1724883; (B) eQTL located on Chr 12 region between 101.7 and 103.8 MB.
Figure 2
Figure 2
Gene network between Col3a1 and candidate genes on Chr 12. The 27 nodes in the graph below show the selected traits. All nodes are displayed. The 55 edges between the nodes, filtered from the 351 total edges and drawn as curves, show Pearson correlation coefficients greater than 0.35 or less than −0.35. The graph’s canvas is 40.0 by 40.0 cm, and the node labels are drawn with a 18.0 point font, and the edge labels are drawn with a 16.0 point font.
Figure 3
Figure 3
Heatmap showing regulation of genes on Chr 11 and 12 that are closely correlated to Col3a1. The influence of these two Chrs. On Chr 11 expression of first part of genes are affected by C57BL/6J (B6) and the last part of the genes are affected by DBA/2J (D2), while on Chr 12, the effect is opposite to that on Chr 11. Orange triangles are genetic elements (probes) that are correlated to the expression level of Col3a1.
Figure 4
Figure 4
(A) Gene network of 44 common genes from two probes. The 46 nodes in the graph below show the selected probes. Only nodes with edges are displayed. The 866 edges between the nodes, filtered from the 1035 total edges and drawn as curves, show Pearson correlation coefficients greater than 0.35 or less than −0.35. The graph’s canvas is 40.0 by 40.0 cm, and the node labels are drawn with a 14.0 point font, and the edge labels are drawn with a 14.0 point font; (B) Two probes of Col3a1 show their positive correlation with 22 genes in mice. The 74 nodes in the graph below show the selected genes. Only nodes with edges are displayed. The 431 edges between the nodes, filtered from the 2701 total edges and drawn as lines, show Pearson correlation coefficients greater than 0.5 or less than −0.5. The graph’s canvas is 40.0 by 40.0 cm, and the node labels are drawn with a 14.0 point font, and the edge labels are drawn with a 14.0 point font.
Figure 4
Figure 4
(A) Gene network of 44 common genes from two probes. The 46 nodes in the graph below show the selected probes. Only nodes with edges are displayed. The 866 edges between the nodes, filtered from the 1035 total edges and drawn as curves, show Pearson correlation coefficients greater than 0.35 or less than −0.35. The graph’s canvas is 40.0 by 40.0 cm, and the node labels are drawn with a 14.0 point font, and the edge labels are drawn with a 14.0 point font; (B) Two probes of Col3a1 show their positive correlation with 22 genes in mice. The 74 nodes in the graph below show the selected genes. Only nodes with edges are displayed. The 431 edges between the nodes, filtered from the 2701 total edges and drawn as lines, show Pearson correlation coefficients greater than 0.5 or less than −0.5. The graph’s canvas is 40.0 by 40.0 cm, and the node labels are drawn with a 14.0 point font, and the edge labels are drawn with a 14.0 point font.
Figure 5
Figure 5
Two probes of Col3a1 show their negative correlation with 21 genes in mice. The 23 nodes in the graph below show the selected traits. All nodes are displayed. The 69 edges between the nodes, filtered from the 253 total edges and drawn as curves, show Pearson correlation coefficients greater than 0.6 or less than −0.6. The graph’s canvas is 40.0 by 40.0 cm, and the node labels are drawn with a 16.0 point font, and the edge labels are drawn with a 16.0 point font.
Figure 6
Figure 6
Gene networks of common genes in mice and humans. Each subfigure shows Pearson correlation coefficients greater than 0.5 or less than −0.5. The graph’s canvas is 40.0 by 40.0 cm, and the node labels are drawn with a 14.0 point font, and the edge labels are drawn with a 14.0 point font. (A) Gene network of 41 common genes and COL3A1 in human lung with probe 100149328. The 42 nodes in the graph below show the selected traits. All nodes are displayed. The 566 edges between the nodes, filtered from the 861 total edges and drawn as curves; (B) Correlations between the 41 common top human genes with Col3a1 in mouse lung. The 89 nodes in the graph below show the selected traits. Only nodes with edges are displayed. The 289 edges between the nodes were filtered from the 3916 total edges and drawn as lines.
Figure 6
Figure 6
Gene networks of common genes in mice and humans. Each subfigure shows Pearson correlation coefficients greater than 0.5 or less than −0.5. The graph’s canvas is 40.0 by 40.0 cm, and the node labels are drawn with a 14.0 point font, and the edge labels are drawn with a 14.0 point font. (A) Gene network of 41 common genes and COL3A1 in human lung with probe 100149328. The 42 nodes in the graph below show the selected traits. All nodes are displayed. The 566 edges between the nodes, filtered from the 861 total edges and drawn as curves; (B) Correlations between the 41 common top human genes with Col3a1 in mouse lung. The 89 nodes in the graph below show the selected traits. Only nodes with edges are displayed. The 289 edges between the nodes were filtered from the 3916 total edges and drawn as lines.
Figure 7
Figure 7
Gene network of top collated genes in mice and humans. Each figure shows Pearson correlation coefficients greater than 0.5 or less than −0.5. The graph’s canvas is 40.0 by 40.0 cm, and the node labels are drawn with a 14.0 point font, and the edge labels are drawn with a 14.0 point font. (A) Correlation between COL3A1 and 104 probes of top 44 genes in mice in human lung. The 107 nodes in the graph below show the selected traits. Only nodes with edges are displayed. The 517 edges between the nodes were filtered from the 5671 total edges and drawn as lines; (B) Gene network between COL3A1 and 22 unregulated genes selected from mice in human lung tissues. The 59 nodes in the graph below show the selected traits. Only nodes with edges are displayed. The 386 edges between the nodes were filtered from the 1711 total edges and drawn as lines; (C) The gene network between COL3A1 and 21 down-regulated genes selected from mice in human lung tissues. The 51 nodes in the graph below show the selected traits. Only nodes with edges are displayed. The 83 edges between the nodes were filtered from the 1275 total edges and drawn as lines.
Figure 7
Figure 7
Gene network of top collated genes in mice and humans. Each figure shows Pearson correlation coefficients greater than 0.5 or less than −0.5. The graph’s canvas is 40.0 by 40.0 cm, and the node labels are drawn with a 14.0 point font, and the edge labels are drawn with a 14.0 point font. (A) Correlation between COL3A1 and 104 probes of top 44 genes in mice in human lung. The 107 nodes in the graph below show the selected traits. Only nodes with edges are displayed. The 517 edges between the nodes were filtered from the 5671 total edges and drawn as lines; (B) Gene network between COL3A1 and 22 unregulated genes selected from mice in human lung tissues. The 59 nodes in the graph below show the selected traits. Only nodes with edges are displayed. The 386 edges between the nodes were filtered from the 1711 total edges and drawn as lines; (C) The gene network between COL3A1 and 21 down-regulated genes selected from mice in human lung tissues. The 51 nodes in the graph below show the selected traits. Only nodes with edges are displayed. The 83 edges between the nodes were filtered from the 1275 total edges and drawn as lines.
Figure 8
Figure 8
Summary of the gene networks of humans and mice. Each picture shows Pearson correlation coefficients greater than 0.5 or less than −0.5. The graph’s canvas is 40.0 by 40.0 cm, and the node labels are drawn with a 16.0 point font, and the edge labels are drawn with a 16.0 point font. Solid lines represent strong correlation (absolute value: thick line = 0.7–1; thin line = 0.5–0.7), while dashed lines present weak correlation (absolute value: 0–0.5). (A) Summary of the network of human-positive genes in mice. The 23 nodes in the graph below show the selected genes. The 30 edges between the nodes were filtered from the 253 total edges and drawn as curves; (B) Summary of the network of positive genes in human microarray data. The 33 nodes in the graph below show the selected genes. All nodes are displayed. The 288 edges between the nodes were filtered from the 528 total edges and drawn as curves. The graph’s canvas is 40.0 by 40.0 cm; (C) Summary of network of mouse genes: the 23 nodes in the graph below show the selected genes. The 66 edges between the nodes were filtered from the 253 total edges and drawn as curves; (D) Summary of gene network genes from mice in human microarray data. The 25 nodes in the graph below show the selected genes. The 55 edges between the nodes were filtered from the 300 total edges and drawn as curves.
Figure 8
Figure 8
Summary of the gene networks of humans and mice. Each picture shows Pearson correlation coefficients greater than 0.5 or less than −0.5. The graph’s canvas is 40.0 by 40.0 cm, and the node labels are drawn with a 16.0 point font, and the edge labels are drawn with a 16.0 point font. Solid lines represent strong correlation (absolute value: thick line = 0.7–1; thin line = 0.5–0.7), while dashed lines present weak correlation (absolute value: 0–0.5). (A) Summary of the network of human-positive genes in mice. The 23 nodes in the graph below show the selected genes. The 30 edges between the nodes were filtered from the 253 total edges and drawn as curves; (B) Summary of the network of positive genes in human microarray data. The 33 nodes in the graph below show the selected genes. All nodes are displayed. The 288 edges between the nodes were filtered from the 528 total edges and drawn as curves. The graph’s canvas is 40.0 by 40.0 cm; (C) Summary of network of mouse genes: the 23 nodes in the graph below show the selected genes. The 66 edges between the nodes were filtered from the 253 total edges and drawn as curves; (D) Summary of gene network genes from mice in human microarray data. The 25 nodes in the graph below show the selected genes. The 55 edges between the nodes were filtered from the 300 total edges and drawn as curves.

References

    1. Cole W.G., Chiodo A.A., Lamande S.R., Janeczko R., Ramirez F., Dahl H.-H.M., Chan D., Bateman J.F. A base substitution at a splice site in the COL3A1 gene causes exon skipping and generates abnormal type III procollagen in a patient with Ehlers-Danlos syndrome type IV. J. Biol. Chem. 1990;265:17070–17077. - PubMed
    1. Schwarze U., Schievink W.I., Petty E., Jaff M.R., Babovic-Vuksanovic D., Cherry K.J., Pepin M., Byers P.H. Haploinsufficiency for one COL3A1 allele of type III procollagen results in a phenotype similar to the vascular form of Ehlers-Danlos syndrome, Ehlers-Danlos syndrome type IV. Am. J. Hum. Genet. 2001;69:989–1001. doi: 10.1086/324123. - DOI - PMC - PubMed
    1. Liu X., Wu H., Byrne M., Krane S., Aenisch R. Type III collagen is crucial for collagen I fibrillogenesis and for normal cardiovascular development. Proc. Natl. Acad. Sci. USA. 1997;94:1852–1856. doi: 10.1073/pnas.94.5.1852. - DOI - PMC - PubMed
    1. Cooper T.K., Zhong Q., Krawczyk M., Tae H.J., Müller G.A., Schubert R., Myers L.A., Dietz H.C., Talan M.I., Briest W. The haploinsufficient Col3a1 mouse as a model for vascular Ehlers-Danlos syndrome. Vet. Pathol. 2010;47:1028–1039. doi: 10.1177/0300985810374842. - DOI - PMC - PubMed
    1. Christner P.J., Yufit T., Peters J., McGrath R., Jiménez S.A. Transcriptional activation of alpha 1(III) procollagen gene in Tsk2/+ dermal fibroblasts. Biochem. Biophys. Res. Commun. 2003;303:406–412. doi: 10.1016/S0006-291X(03)00315-2. - DOI - PubMed

Publication types

Substances