. 2015 Jul 8:5:11759.
doi: 10.1038/srep11759.

RalB regulates contractility-driven cancer dissemination upon TGFβ stimulation via the RhoGEF GEF-H1

Affiliations

RalB regulates contractility-driven cancer dissemination upon TGFβ stimulation via the RhoGEF GEF-H1

Marco Biondini et al. Sci Rep. .

Abstract

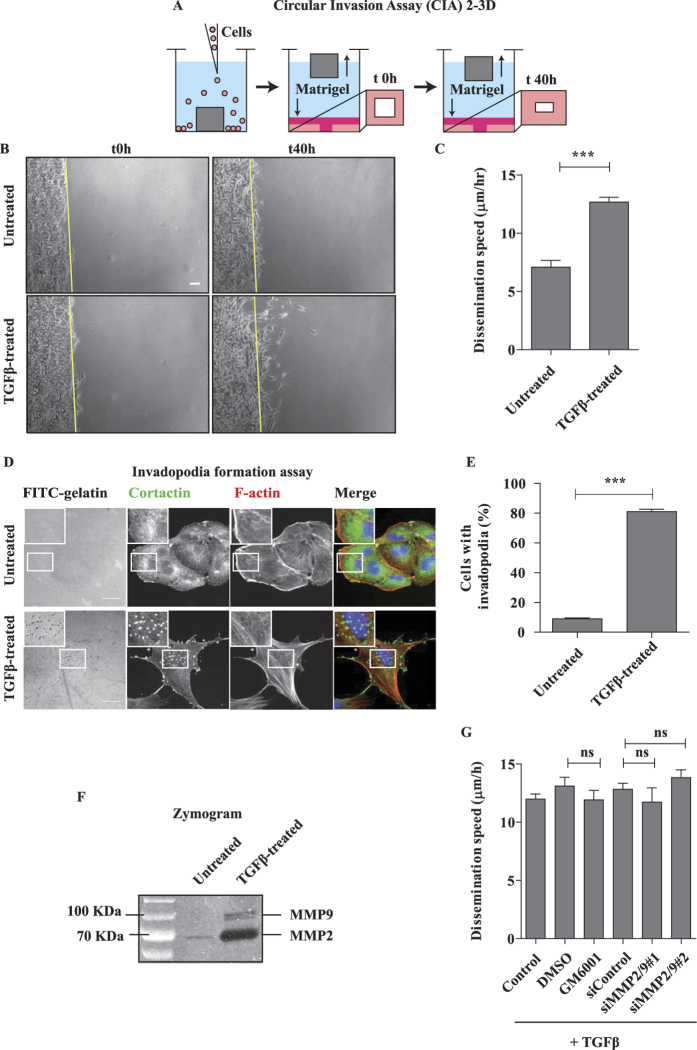
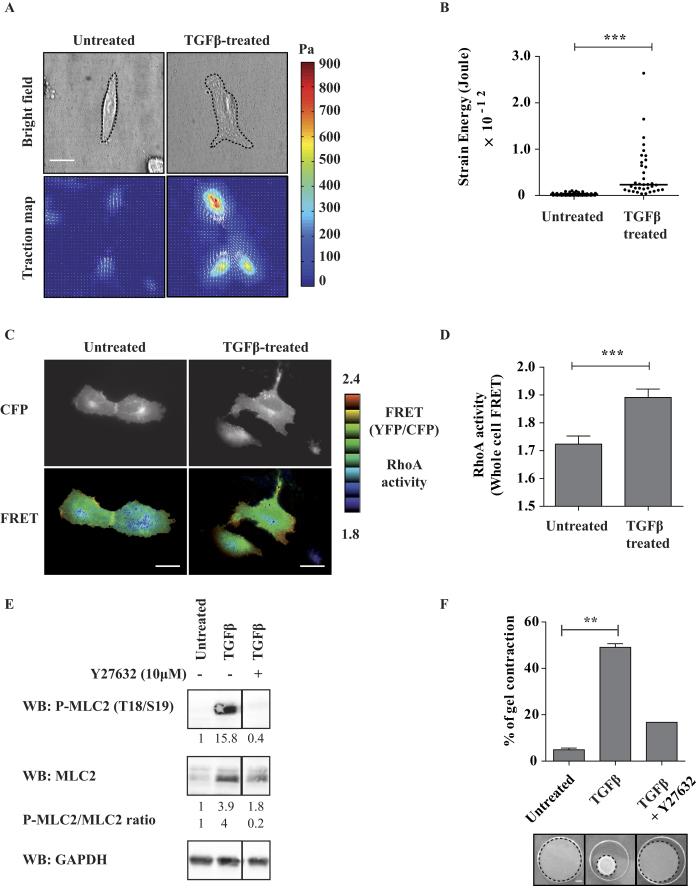
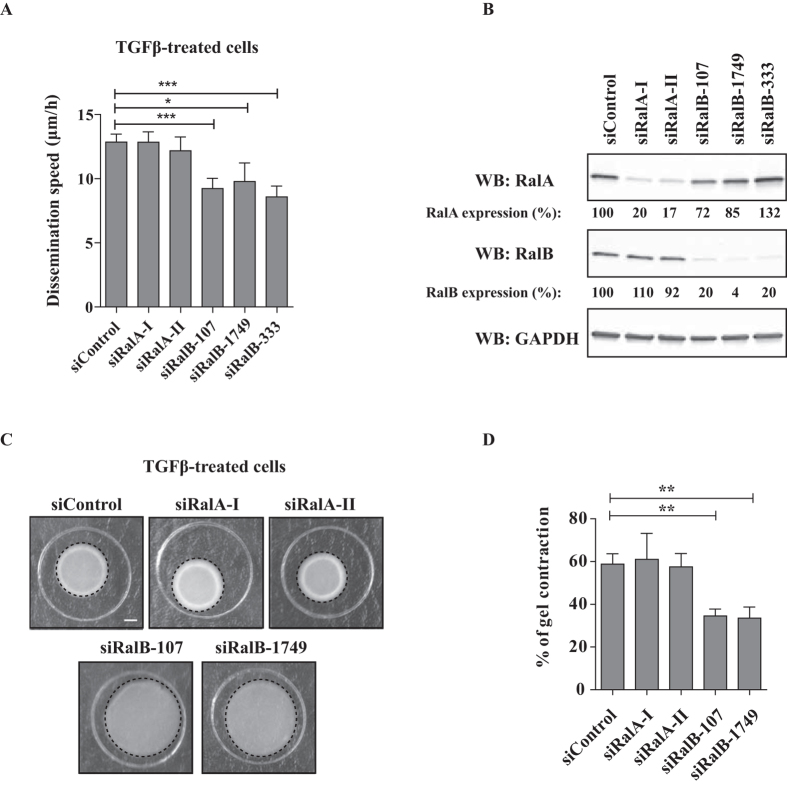
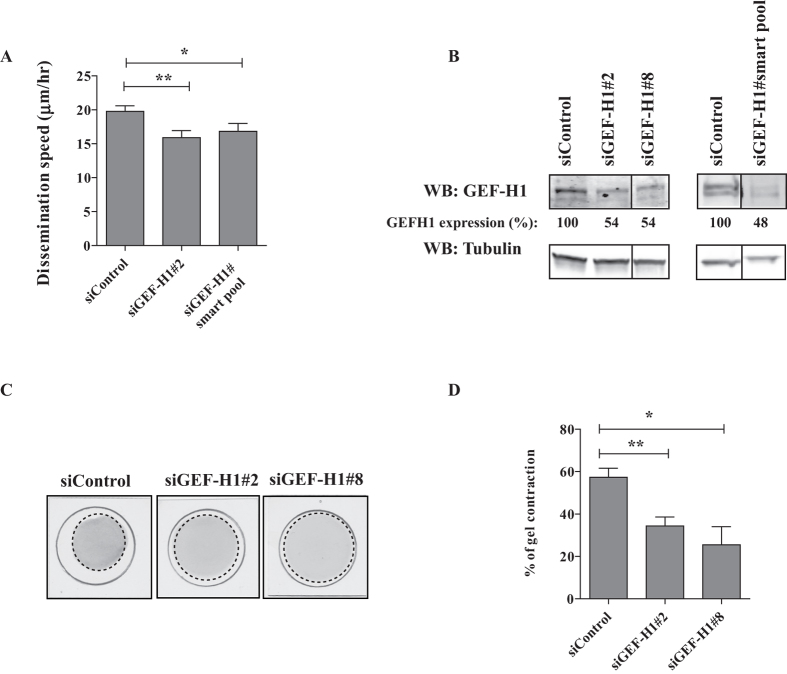
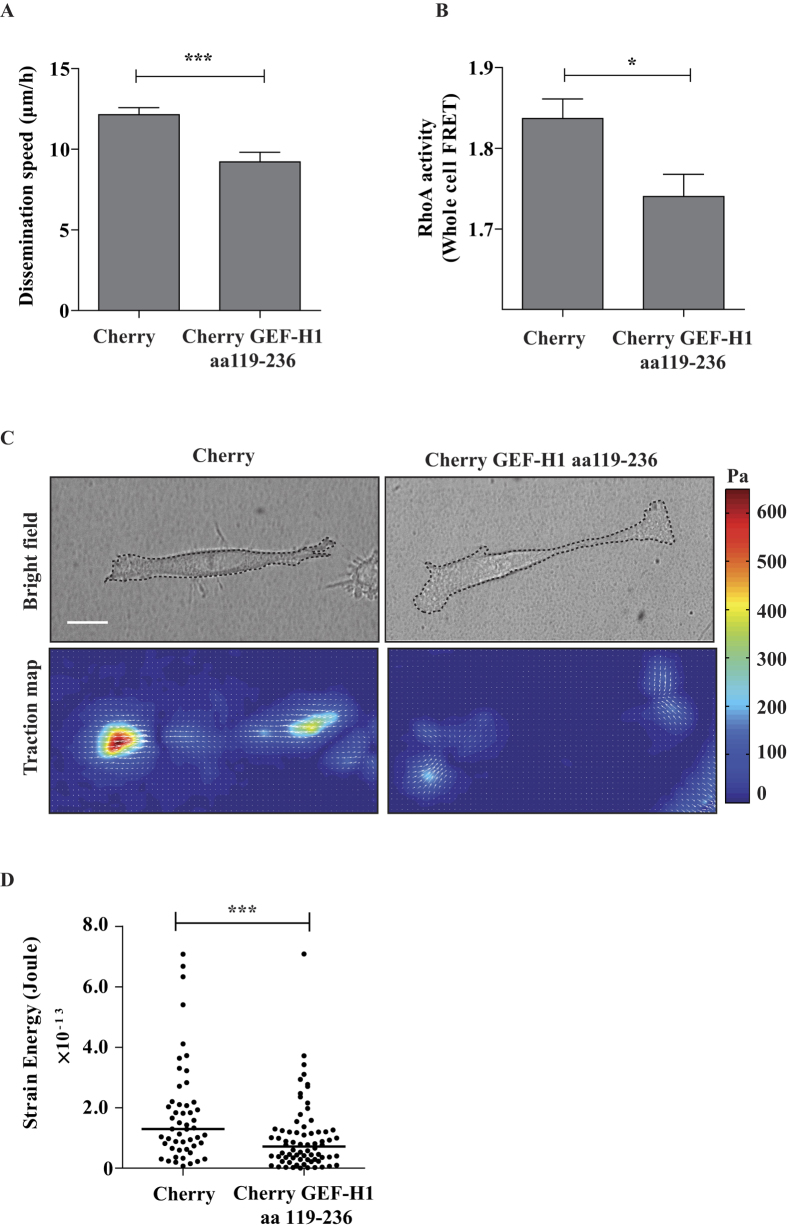
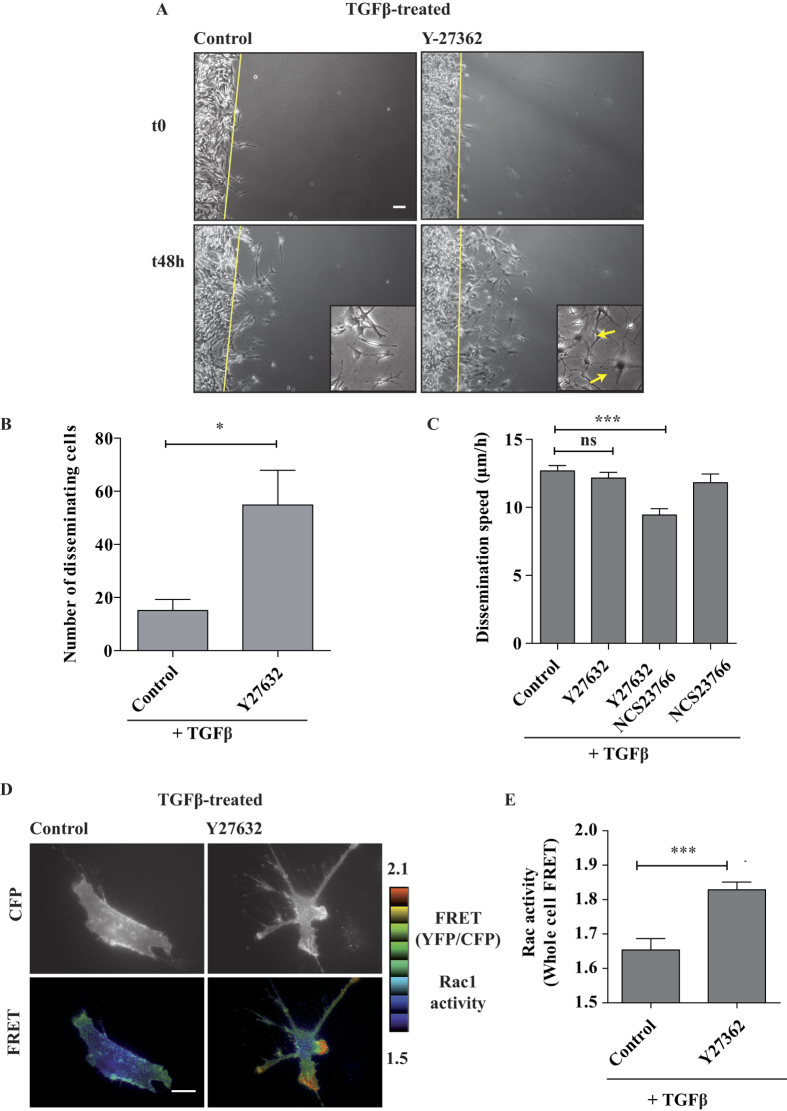
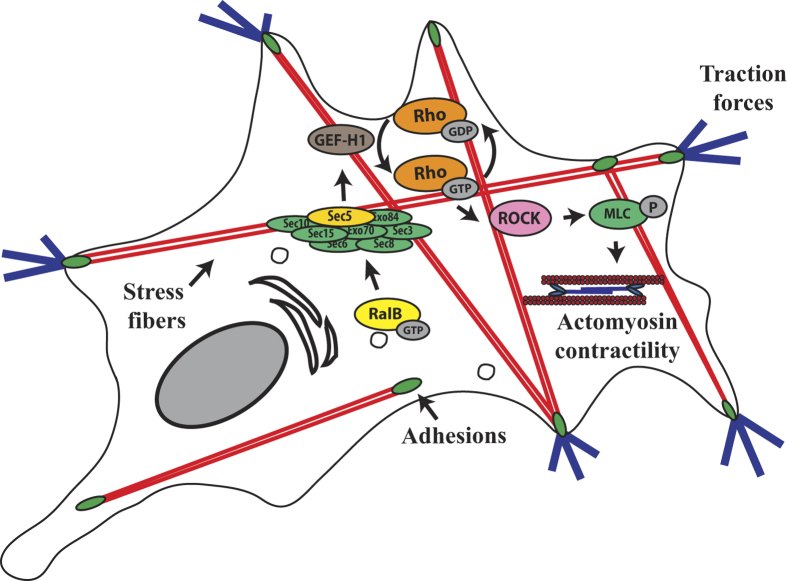
RalA and RalB proteins are key mediators of oncogenic Ras signaling in human oncogenesis. Herein we investigated the mechanistic contribution of Ral proteins to invasion of lung cancer A549 cells after induction of epithelial-mesenchymal transition (EMT) with TGFβ. We show that TGFβ-induced EMT promotes dissemination of A549 cells in a 2/3D assay, independently of proteolysis, by activating the Rho/ROCK pathway which generates actomyosin-dependent contractility forces that actively remodel the extracellular matrix, as assessed by Traction Force microscopy. RalB, but not RalA, is required for matrix deformation and cell dissemination acting via the RhoGEF GEF-H1, which associates with the Exocyst complex, a major Ral effector. Indeed, uncoupling of the Exocyst subunit Sec5 from GEF-H1 impairs RhoA activation, generation of traction forces and cell dissemination. These results provide a novel molecular mechanism underlying the control of cell invasion by RalB via a cross-talk with the Rho pathway.


Figures

Figure 1
Figure 1. Dissemination of TGFβ-treated A549 cells in 2/3D is proteolysis independent.
(A) Depiction of the 2/3D Circular Invasion Assay (CIA). Note that we kept the original name of the assay, but that the actual shape of the stopper we used is not circular but square. (B) EMT promotes cell dissemination. A549 cells were treated with 2 ng/mL TGFβ for 7 days, submitted to CIA and compared to untreated cells. Selected time points from a representative experiment are shown. See Supplementary Movie S1 for entire video sequence. Scale bar, 100 μm. (C) Quantification of cell dissemination. Individual cells were tracked using the ImageJ software. Number of cells n = 40 for untreated and n = 163 for TGFβ-treated conditions from at least four experiments per condition. (D) TGFβ greatly stimulates invadopodia formation. Cells were stimulated with TGFβ for 7 days and invadopodia were visualized as dots positive for matrix degradation (black), for cortactin staining (green) and for F-actin staining (red). Scale bar, 20 μm.(E) Quantification of cells positive for at least one invadopodia. Counting was performed on three independent experiments (n≥100 cells/condition per experiment). (F) TGFβ induces strong secretion of MMP2 and MMP9 metalloproteinases. Conditioned media from untreated and TGFβ-treated cells were collected and processed for gelatin zymogram assay. A representative zymogram image is shown. (G) MMP-dependent proteolysis is dispensable for TGFβ-induced dissemination in 2/3D. TGFβ-treated cells were incubated with 25 μM GM6001 MMPs inhibitor (2 hrs before CIA and during CIA) or depleted of MMP2 and MMP9, and submitted to CIA. Number of cells n>30 per condition from three experiments with GM6001 and one experiment with siRNAs. Error bars represent SEM. p values come from two-tailed Student’s t test. *p < 0.05, **p < 0.01, ***p < 0.001. ns, not significant.
Figure 2
Figure 2. TGFβ1-induced EMT enhances actomyosin contractility and matrix remodelling.
(A) EMT promotes traction forces on the substratum. Representative phase contrast images and corresponding traction force maps of untreated and TGFβ-treated A549 cells as revealed by Traction Force Microscopy (TFM). Color scale bar denotes traction stress (Pa). Scale bar, 50 μm. (B) Quantification of the strain energy. TGFβ-treated cells generate significantly higher strain energies compared to untreated cells. Number of untreated cells n = 51, TGFβ-treated cells n = 35, from two experiments. (C) EMT stimulates Rho activity. Visualization of RhoA activity in representative untreated and TGFβ-treated cells. Cells were transfected with a plasmid expressing Raichu-RhoA (KRasCter) biosensor and observed by FRET microscopy the day after. Note the higher level of RhoA at cell periphery. Scale bars, 20 μm. (D) Quantification of whole-cell RhoA activity. YFP and CFP images were acquired for each cell and mean intensities were measured for the entire cell surface. The YFP/CFP ratio is a measure of whole-cell FRET, i.e. of whole-cell RhoA activity. Number of untreated cells n = 54, TGFβ-treated cells n = 41, from two experiments. (E) EMT induces MLC2 phosphorylation. The levels of total and phosphorylated MLC2 were analyzed by western-blot. The quantification of band intensities (with respect to untreated condition) and the calculated P-MLC/MLC ratio are indicated. The vertical lanes indicate positions were gel images were cut in order to juxtapose non-adjacent lanes coming from the same gel. (F) EMT stimulates ROCK-dependent actomyosin contractility. A549 cells were grown with or without TGF-β1 for 7 days and embedded in collagen I gels for 4 days. Gel contraction was monitored. Where indicated, cells were pre-treated for 2 hrs with 10 μM Y27632 ROCK inhibitor and submitted to collagen contraction assay in presence of the inhibitor. Number of untreated gels n = 2, TGFβ-treated gels n = 2, TGFβ/Y27632-treated gels n = 1, from two experiments. Error bars represent SEM. p values come from two-tailed Student’s t test. *p < 0.05, **p < 0.01, ***p < 0.001.Scale bar is 100 μm.
Figure 3
Figure 3. RalB regulates dissemination of TGFβ-treated cells.
(A) RalB silencing impairs TGFβ-induced dissemination in CIA. TGFβ-treated cells were depleted of RalA or RalB, submitted to CIA and the speed of dissemination was evaluated by manual tracking. Number of cells from at least three experiments: siControl n = 76, siRalA-I n = 66, siRalA-II n = 44, siRalB-107 n = 30, siRalB-1749 n = 13, siRalB-333 n = 28. (B) Validation of Ral proteins depletion. Efficiency of RalA and RalB depletion was verified by western blotting.(C) Effect of Ral depletion on TGFβ-induced contractility. Representative images showing gel contraction by TGFβ-treated cells depleted of RalA or RalB. (D) Quantification of gel contraction upon Ral depletion. Mean percentage values from four to five experiments were plotted on graphic. Error bars represent SEM. p values come from two-tailed Student’s t test. *p < 0.05, **p < 0.01, ***p < 0.001.
Figure 4
Figure 4. GEF-H1 controls both dissemination and contractility of TGFβ-treated cells.
(A) GEF-H1 depletion impairs TGFβ-induced dissemination in CIA. TGFβ-treated cells were depleted of GEF-H1 and subsequently submitted to CIA. Impact of GEF-H1 silencing on dissemination speed was quantified by manual tracking. Number of cells from at least three experiments: siControl n = 81, siGEF-H1#2 n = 47, siGEF-H1#smart pool n = 32, (B) Validation of GEF-H1 protein depletion. Efficiency of GEF-H1 depletion was verified by western blotting. The vertical lanes indicate positions were gel images were cut in order to juxtapose non-adjacent lanes coming from the same gel. (C) Effect of GEF-H1 depletion on TGFβ-induced contractility. Representative images showing gel contraction by TGFβ-treated cells depleted of GEF-H1. (D) Quantification of gel contraction upon GEF-H1 depletion. Mean percentage values from two to six experiments were plotted on graphic.
Figure 5
Figure 5. Exocyst/GEF-H1 interaction is required for dissemination, RhoA activity and generation of traction forces of TGFβ-treated cells.
(A) Exocyst/GEF-H1 uncoupling impairs TGFβ-induced dissemination in CIA. TGFβ-treated cells stably expressing Cherry (control) or Cherry-GEF-H1aa119–236 (the peptide aa119–236 competes for the binding of endogenous GEF-H1 to Sec5) were submitted to CIA. Dissemination speeds were measured by manual tracking: Cherry n = 60, Cherry-GEF-H1aa119–236 n = 45, from two experiments. (B) Exocyst/GEF-H1 uncoupling perturbs RhoA activity. TGFβ-treated cells stably expressing Cherry or Cherry-GEF-H1aa119–236 were transfected with a FRET biosensor to visualize RhoA activity. Graphic shows mean whole-cell FRET values: Cherry n = 54, Cherry-GEF-H1aa119–236 n = 39, from two experiments. (C) Exocyst/GEF-H1 uncoupling impairs generation of traction forces. The ability of Cherry or Cherry-GEF-H1aa119–236 stably expressing cells to generate forces was investigated by Traction Force Microscopy (TFM). Phase contrast images and corresponding traction force maps are shown. Color scale bar denotes traction stress (Pa). Scale bar, 50 μm. (D) Quantification of the strain energy. Cherry-GEF-H1aa119–236 cells generate significantly less strain energies compared to Cherry. Number of Cherry cells n = 72, Cherry-GEF-H1aa119–236 cells n = 51, from two experiments. Error bars represent SEM. p values come from two-tailed Student’s t test. *p < 0.05, **p < 0.01, ***p < 0.001.
Figure 6
Figure 6. Contractility inhibition leads to Rac activation and Rac-dependent dissemination.
(A) Inhibition of ROCK does not impair TGFβ-induced dissemination. TGFβ-treated cells were pre-treated for 2 hrs with 10 μM Y27632 ROCK inhibitor and then submitted to CIA in the presence of the inhibitor. Selected time points from a representative experiment are shown. See Supplementary Movie S3 for entire video sequence. Yellow arrows indicate broad lamellipodia-like protrusions frequently observed in TGFβ-treated cells in presence of Y27632. Scale bar, 100 μm. (B) Quantification of disseminating cells. The number of TGFβ-treated cells per field that in 2 days reached a distance >130 μm from the starting monolayer were counted, in absence or in presence of 10 μM Y27632, from three experiments (3 to 8 fields counted per experiment). (C) Rac1 activity is necessary for TGFβ-induced dissemination upon ROCK inhibition. 10 μM Y27632 ROCK inhibitor and 50 μM NCS237666 Rac1 inhibitor were added to TGFβ-treated cells as indicated. Number of cells TGFβ-treated n = 163, TGFβ/Y27632 treated n = 134, TGFβ/Y27632/NCS237666 treated n = 47, TGFβ/NCS237666 treated n = 42 from at least two experiments. (D) ROCK inhibition increases Rac1 activity at cellular protrusions. TGFβ-treated cells were transfected with a plasmid expressing Raichu-Rac1 (KRasCter) biosensor, treated with or without 10 μM Y27632 and visualized live by FRET microscopy the day after. Representative cells are shown. Scale bar 20 μm. (E) Quantification of whole-cell Rac1 activity. Number of untreated cells n = 54, Y27632 treated cells n = 33, from two experiments. Error bars represent SEM. p values come from two-tailed Student’s t test. *p < 0.05, **p < 0.01, ***p < 0.001.
Figure 7
Figure 7. Model outlining the role of RalB/Exocyst pathway in the dissemination of TGFβ-treated A549 cells.
TGFβ-treated cells generate traction forces which are required to remodel the extracellular matrix and to disseminate in 2/3D environment. This requires the activation of the Rho/ROCK pathway and actomyosin function. The Ral pathway controls the dissemination of TGFβ-treated cells by modulating RhoA-dependent actomyosin contractility via the interaction between the Sec5 subunit of Exocyst and the RhoGEF GEF-H1.

References

    1. Bodemann B. O. & White M. A. Ral GTPases and cancer: linchpin support of the tumorigenic platform. Nat. Rev. Cancer 8, 133–140 (2008). - PubMed
    1. Gentry L. R., Martin T. D., Reiner D. J. & Der C. J. Ral small GTPase signaling and oncogenesis: More than just 15 minutes of fame. Biochim. Biophys. Acta BBA - Mol. Cell Res. 1843, 2976–2988 (2014). - PMC - PubMed
    1. Hamad N. M. et al. Distinct requirements for Ras oncogenesis in human versus mouse cells. Genes Dev. 16, 2045–2057 (2002). - PMC - PubMed
    1. Chien Y. & White M. A. RAL GTPases are linchpin modulators of human tumour-cell proliferation and survival. EMBO Rep. 4, 800–806 (2003). - PMC - PubMed
    1. Oxford G. et al. RalA and RalB: antagonistic relatives in cancer cell migration. Cancer Res. 65, 7111–7120 (2005). - PubMed

Publication types

MeSH terms