. 2015 Jul;27(7):1955-67.
doi: 10.1105/tpc.15.00176. Epub 2015 Jul 7.

Cell-Type-Specific Cytokinin Distribution within the Arabidopsis Primary Root Apex

Affiliations

Cell-Type-Specific Cytokinin Distribution within the Arabidopsis Primary Root Apex

Ioanna Antoniadi et al. Plant Cell. 2015 Jul.

Abstract

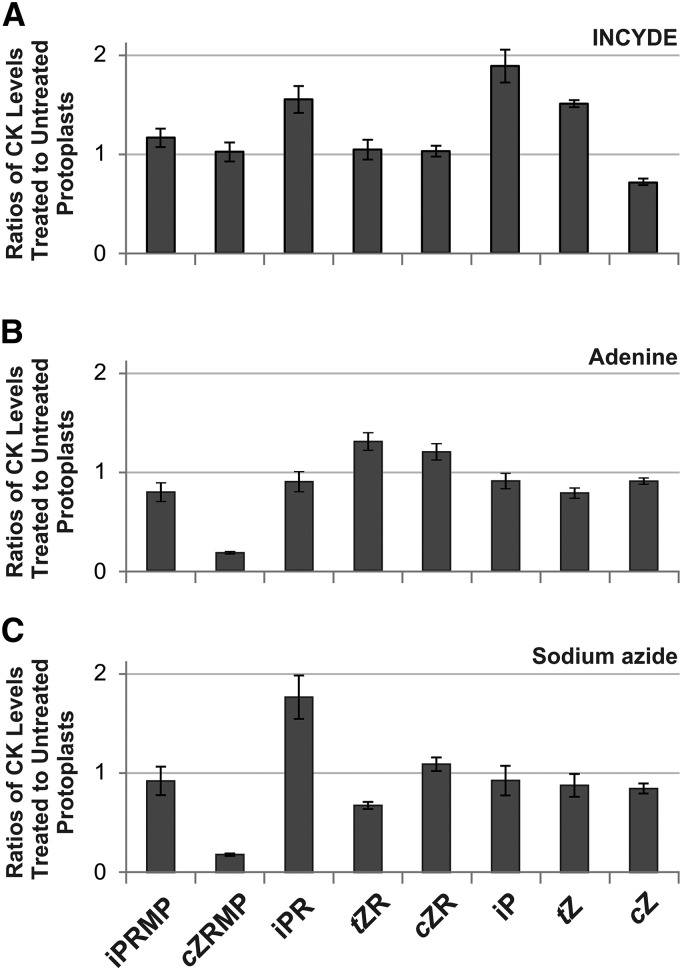
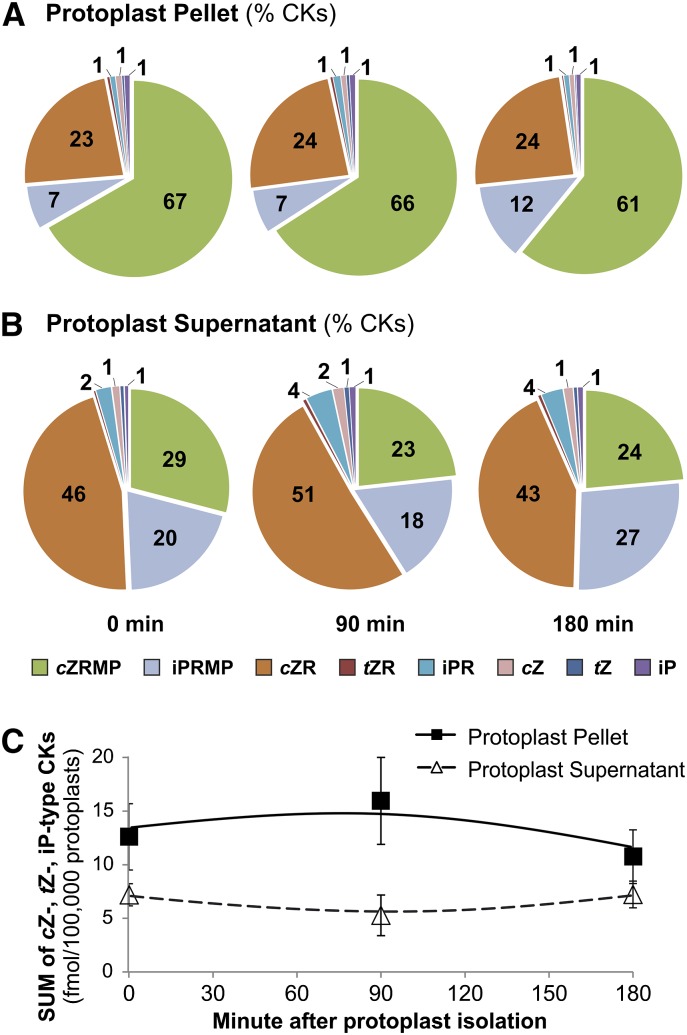
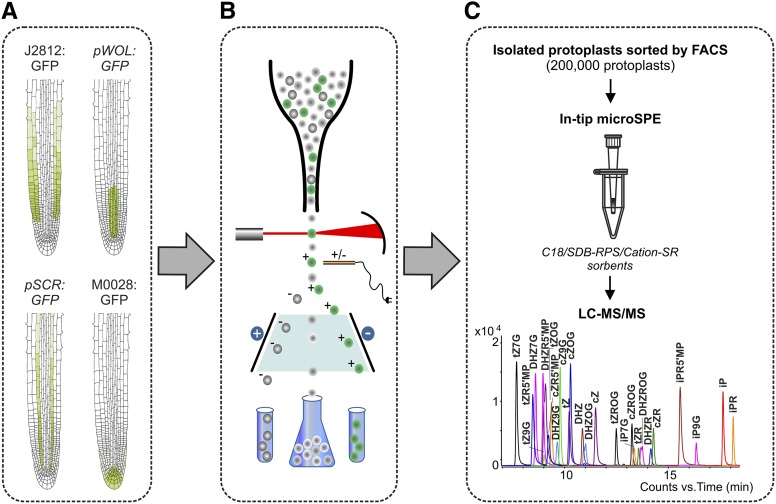
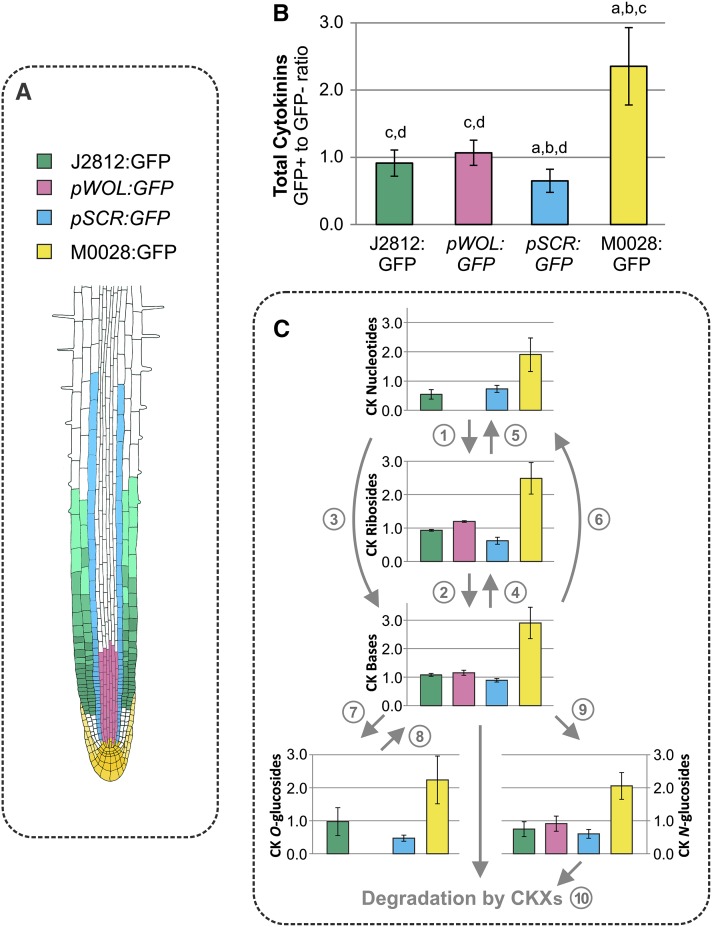
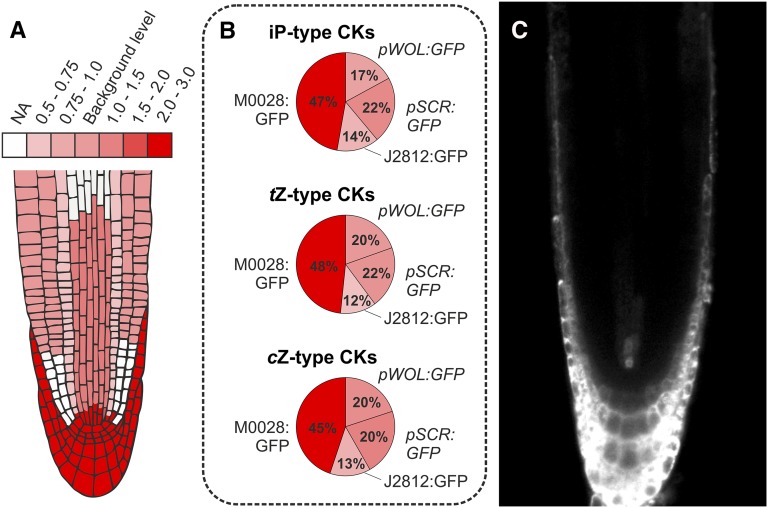
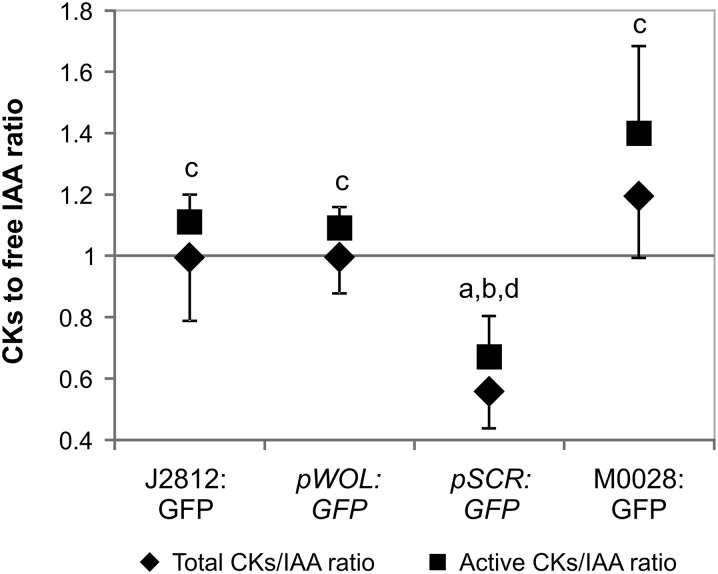
Cytokinins (CKs) play a crucial role in many physiological and developmental processes at the levels of individual plant components (cells, tissues, and organs) and by coordinating activities across these parts. High-resolution measurements of intracellular CKs in different plant tissues can therefore provide insights into their metabolism and mode of action. Here, we applied fluorescence-activated cell sorting of green fluorescent protein (GFP)-marked cell types, combined with solid-phase microextraction and an ultra-high-sensitivity mass spectrometry (MS) method for analysis of CK biosynthesis and homeostasis at cellular resolution. This method was validated by series of control experiments, establishing that protoplast isolation and cell sorting procedures did not greatly alter endogenous CK levels. The MS-based method facilitated the quantification of all the well known CK isoprenoid metabolites in four different transgenic Arabidopsis thaliana lines expressing GFP in specific cell populations within the primary root apex. Our results revealed the presence of a CK gradient within the Arabidopsis root tip, with a concentration maximum in the lateral root cap, columella, columella initials, and quiescent center cells. This distribution, when compared with previously published auxin gradients, implies that the well known antagonistic interactions between the two hormone groups are cell type specific.


Figures

Figure 1.
Figure 1.
Cytokinin Concentration in Isolated Protoplasts. Roots from seedlings 8 d after germination were treated with or without 10 μM INCYDE (a cytokinin dehydrogenase inhibitor; [A]), 100 μM adenine (a cytokinin transport antagonist; [B]), or 3 mM sodium azide (an inhibitor of ATP-dependent metabolic and membrane transport processes; [C]) during protoplast isolation (2 h). The CK concentration was calculated as fmol/100,000 protoplasts, and the respective ratios (treated to untreated) were then determined. Three biological replicates were analyzed for each treatment, and for each replicate at least 1500 roots of wild-type Arabidopsis plants (Col-0) were pooled. Error bars indicate se.
Figure 2.
Figure 2.
Cytokinin Metabolite Profiles in Protoplast Pellet and Supernatant. Isolated protoplasts were suspended in sorting buffer and left on ice during simulated sorting for up to 180 min. Samples were collected every 90 min, centrifuged, and processed for separate analysis of the CK content in the protoplast pellet and supernatant. Nucleotides, ribosides, and bases of iP and cis- and trans-zeatin were quantified as fmol/100,000 protoplasts. Their percentage proportional distributions ([A] and [B]) and their sum (C) were calculated. For each time point, three biological replicates were assessed, and every replicate was derived from a pool of at least 1500 roots of wild-type Arabidopsis plants (Col-0). Error bars indicate se.
Figure 3.
Figure 3.
High-Resolution Cell-Specific Analysis of Cytokinin Distribution in the Arabidopsis Root Apex. The methodology combined fluorescence-activated cell sorting of GFP-marked specific root tip cells with ultrasensitive mass spectrometry for the determination of 26 CK metabolites. Protoplasts were isolated from the roots of Arabidopsis seedlings (8 d after germination) expressing GFP in specific cell types (A) and then sorted using FACS (B). The samples containing collected GFP-expressing (+, green) and non-GFP-expressing (–, gray) cell populations were purified by microSPE and analyzed by LC-MS/MS (C).
Figure 4.
Figure 4.
Cytokinin Levels in Four Different Cell Types Isolated from the Arabidopsis Root Apex. (A) The localization of GFP expression in the root apex indicated in different colors for each Arabidopsis line expressing GFP in specific cell types. (B) Total CK levels calculated as mean of the GFP+-to-GFP ratio of all CK metabolites quantified. Letters above the bars are as follows: a, significantly different from J2812:GFP; b, significantly different from pWOL:GFP; c, significantly different from pSCR:GFP; d, significantly different from M0028:GFP (Student’s t test, P < 0.05). (C) Scheme of metabolism for different cytokinin metabolite groups. The metabolic pathways are based on Spíchal (2012). Enzymes involved in CK biosynthesis, interconversions, and degradation are indicated by circled numbers: (1) 5′-ribonucleotide phosphohydrolase, (2) adenosine nucleosidase, (3) CK phosphoribohydrolase ‘Lonely Guy’, (4) purine nucleoside phosphorylase, (5) adenosine kinase, (6) adenine phosphoribosyltransferase, (7) zeatin-O-glucosyltransferase, (8) β-glucosidase, (9) N-glucosyl transferase, and (10) CKX. The CK metabolites were quantified in fmol/100,000 isolated protoplasts, and the GFP+-to-GFP ratios were computed for each sorted transgenic line: J2812:GFP, pWOL:GFP, pSCR:GFP, and M0028:GFP. In the pWOL:GFP line, CK O-glucosides and nucleotides were detected in neither the GFP+ nor the GFP cell populations. Data represent six biological replicates, and for each, two technical replicates were performed. Error bars indicate se.
Figure 5.
Figure 5.
Cytokinin Distribution within the Arabidopsis Root Tip. (A) CK gradient map showing a concentration maximum in the lateral root cap, columella, columella initials, and QC cells. (B) CK distribution of three isoprenoid groups (tZ, cZ, and iP types) detected in isolated protoplasts. (C) TCSn:GFP expression pattern in 5-d-old Arabidopsis root tip. The data presented in the map were derived from four GFP lines (J2812:GFP, pWOL:GFP, pSCR:GFP, and M0028:GFP) covering almost all of the different cell types of the root apex. Cell-type-specific CK concentrations were calculated in fmol/100,000 isolated GFP+ protoplasts and then normalized to the GFP reference population for each GFP cell line. The red color scale indicates the CK content relative to this reference population; NA represents cell populations that were not analyzed. A value of 1 represents CK level in GFP+ cells equivalent to that in reference GFP cells.
Figure 6.
Figure 6.
Ratio of Cytokinins to Free IAA in Four Different GFP-Expressing Cell Populations. Ratio between the relative content of CKs and free IAA (diamonds, total CKs/IAA; squares, active CKs/IAA) in four Arabidopsis lines (M0028:GFP, pWOL:GFP, pSCR:GFP, and J2812:GFP) expressing GFP protein. Active CK forms represent sum of CK bases and ribosides; total CKs represent sum of all CK metabolites detected. The concentrations of free IAA were analyzed in same sorted cell populations using LC-MS/MS (published in Pěnčík et al., 2013). Prior to the final CK/IAA ratio computing, the data for both hormones had been normalized against the concentration of their respective internal reference population, consisting of the non-GFP-expressing cells from the same samples. Error bars indicate se (n = 6). Both ratios of CKs to free IAA showed similar statistical patterns; letters above the bars are as follows: a, significantly different from J2812:GFP; b, significantly different from pWOL:GFP; c, significantly different from pSCR:GFP; d, significantly different from M0028:GFP (Student’s t test, P < 0.05).

Comment in

References

    1. Aloni R., Aloni E., Langhans M., Ullrich C.I. (2006). Role of cytokinin and auxin in shaping root architecture: regulating vascular differentiation, lateral root initiation, root apical dominance and root gravitropism. Ann. Bot. (Lond.) 97: 883–893. - PMC - PubMed
    1. Aremu A.O., Bairu M.W., Novák O., Plačková L., Zatloukal M., Doležal K., Finnie J.F., Strnad M., Van Staden J. (2012). Physiological responses and endogenous cytokinin profiles of tissue-cultured ‘Williams’ bananas in relation to roscovitine and an inhibitor of cytokinin oxidase/dehydrogenase (INCYDE) treatments. Planta 236: 1775–1790. - PubMed
    1. Bielach A., Podlesáková K., Marhavy P., Duclercq J., Cuesta C., Müller B., Grunewald W., Tarkowski P., Benková E. (2012). Spatiotemporal regulation of lateral root organogenesis in Arabidopsis by cytokinin. Plant Cell 24: 3967–3981. - PMC - PubMed
    1. Birnbaum K., Jung J.W., Wang J.Y., Lambert G.M., Hirst J.A., Galbraith D.W., Benfey P.N. (2005). Cell type-specific expression profiling in plants via cell sorting of protoplasts from fluorescent reporter lines. Nat. Methods 2: 615–619. - PubMed
    1. Birnbaum K., Shasha D.E., Wang J.Y., Jung J.W., Lambert G.M., Galbraith D.W., Benfey P.N. (2003). A gene expression map of the Arabidopsis root. Science 302: 1956–1960. - PubMed

Publication types