. 2015 Jul 7;109(1):95-105.
doi: 10.1016/j.bpj.2015.05.030.

Hydrophobic surfactant proteins strongly induce negative curvature

Affiliations

Hydrophobic surfactant proteins strongly induce negative curvature

Mariya Chavarha et al. Biophys J. .

Abstract

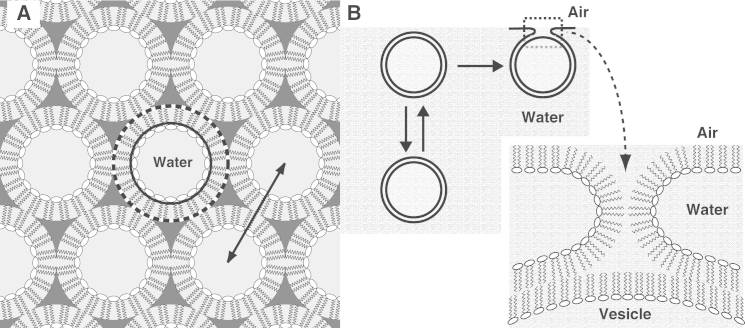
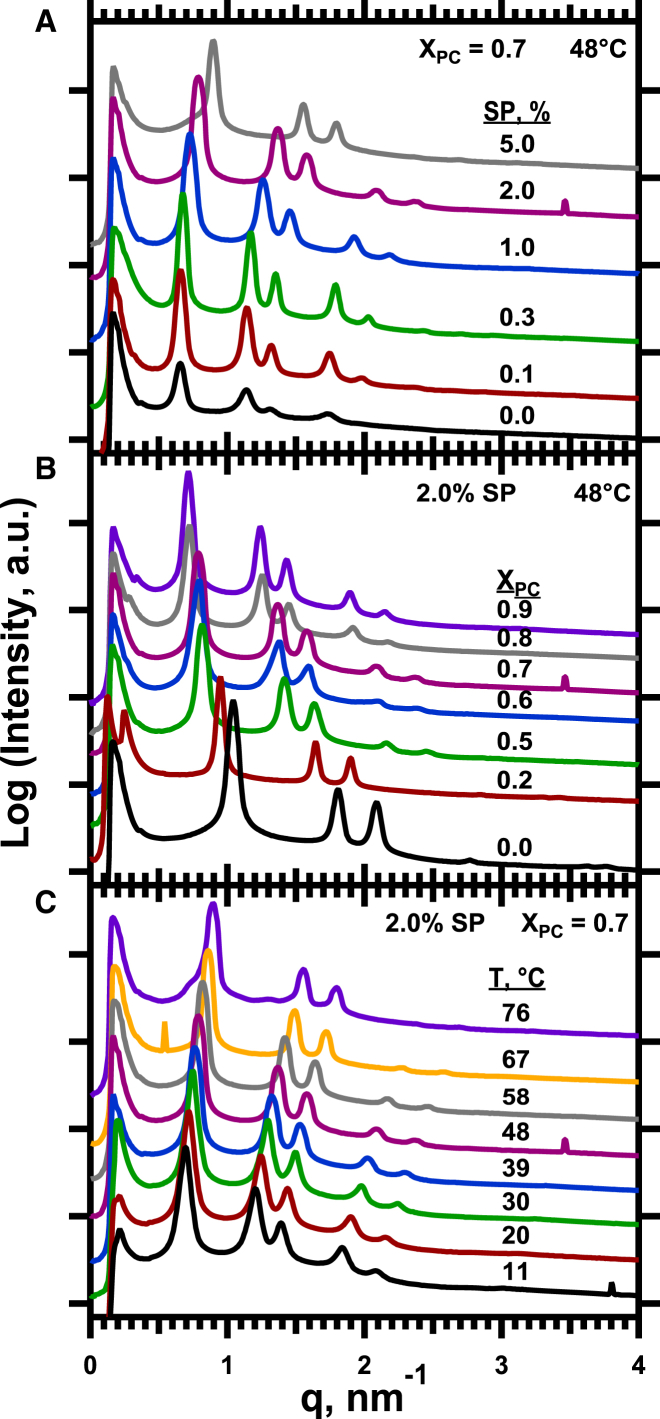
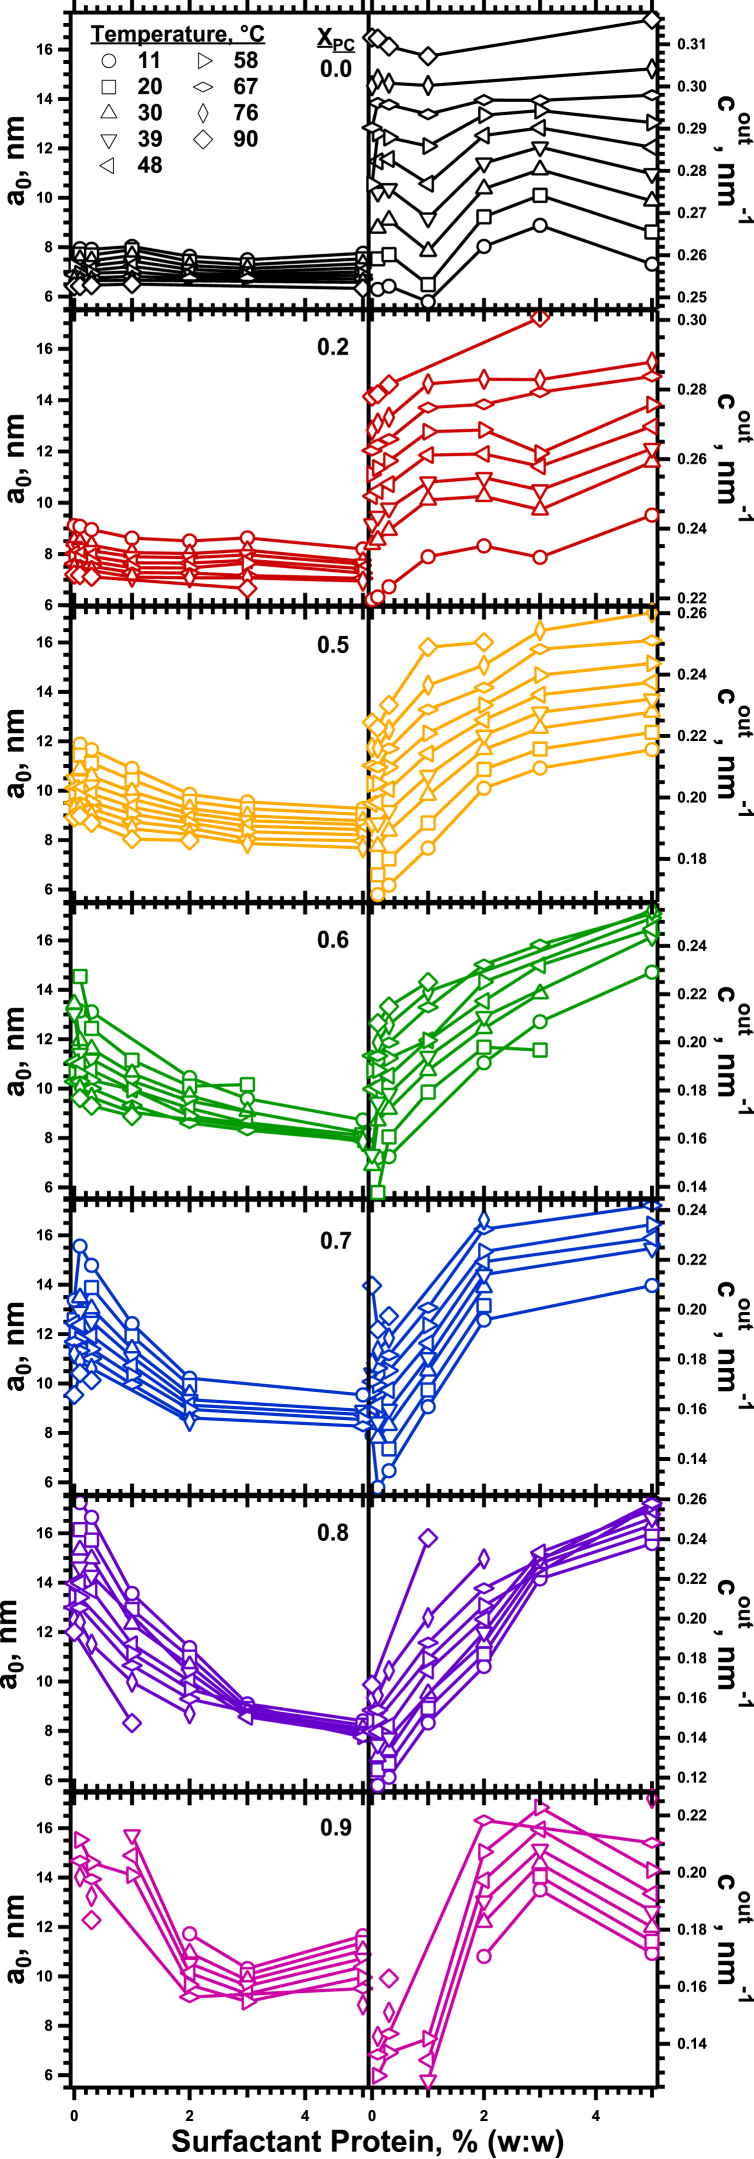
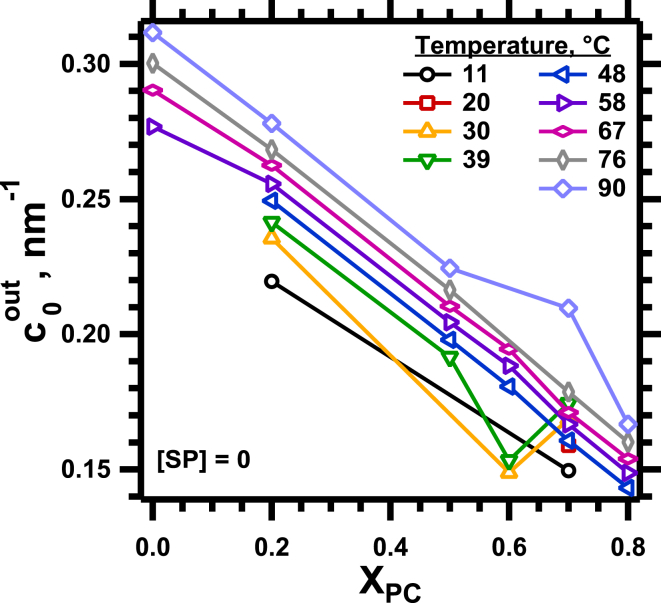
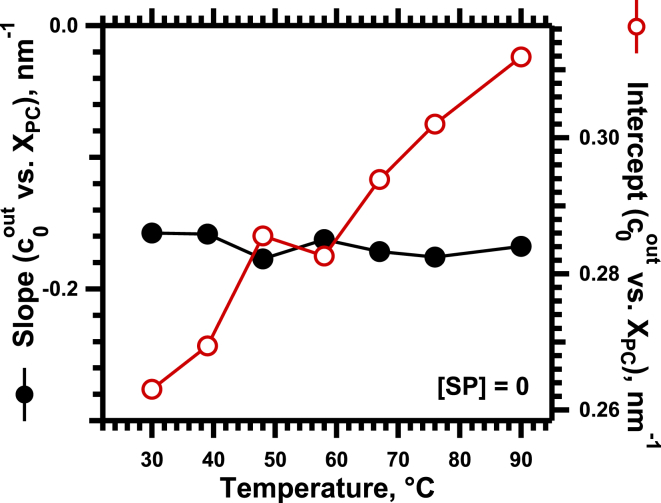
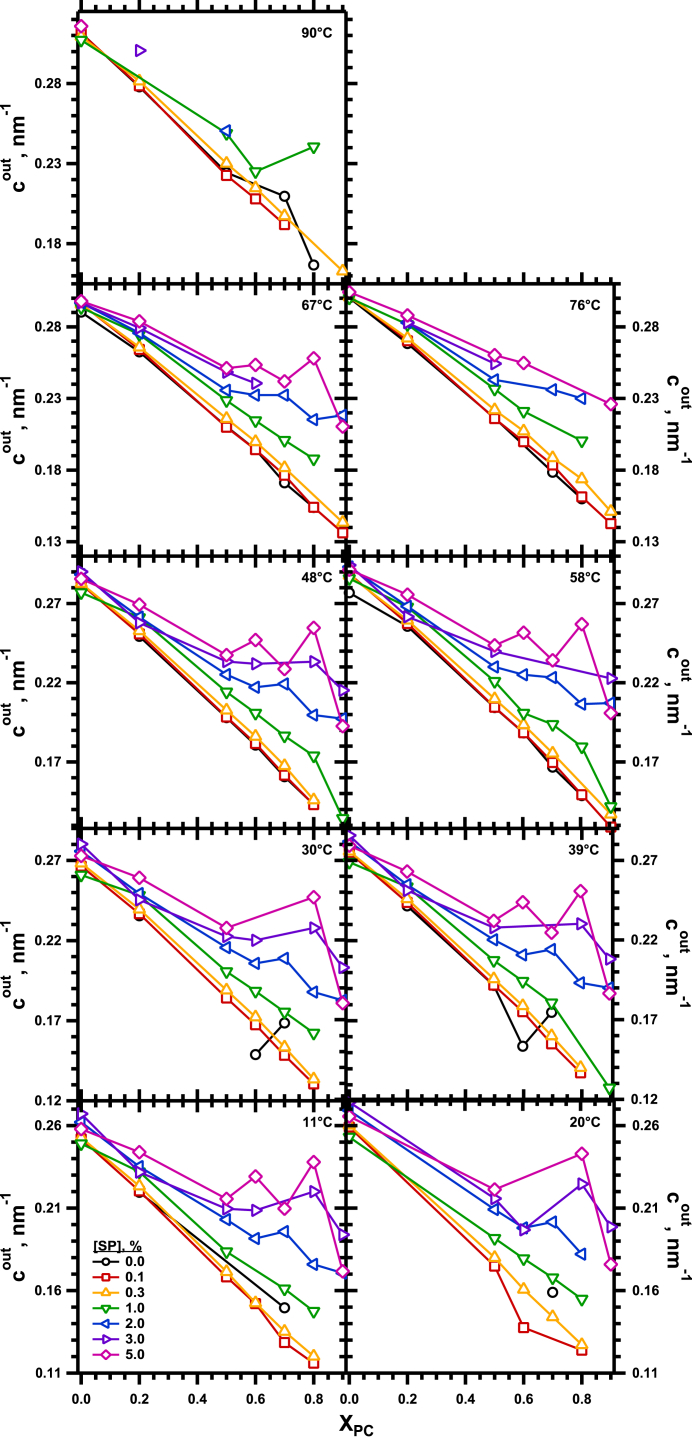
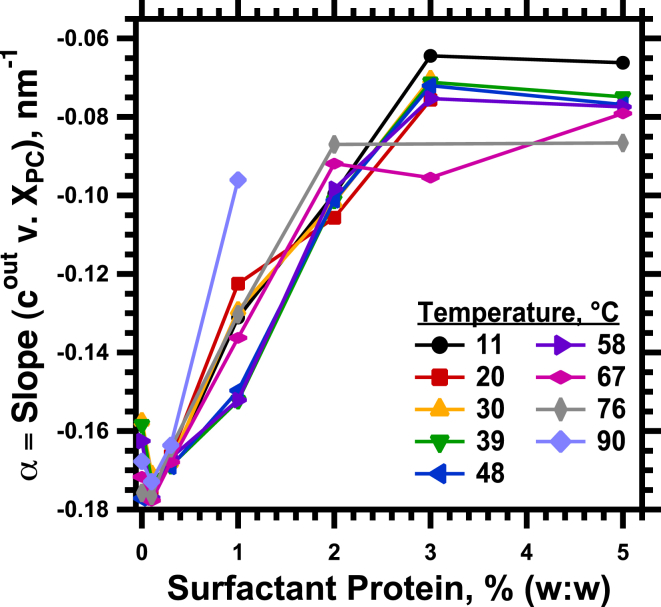
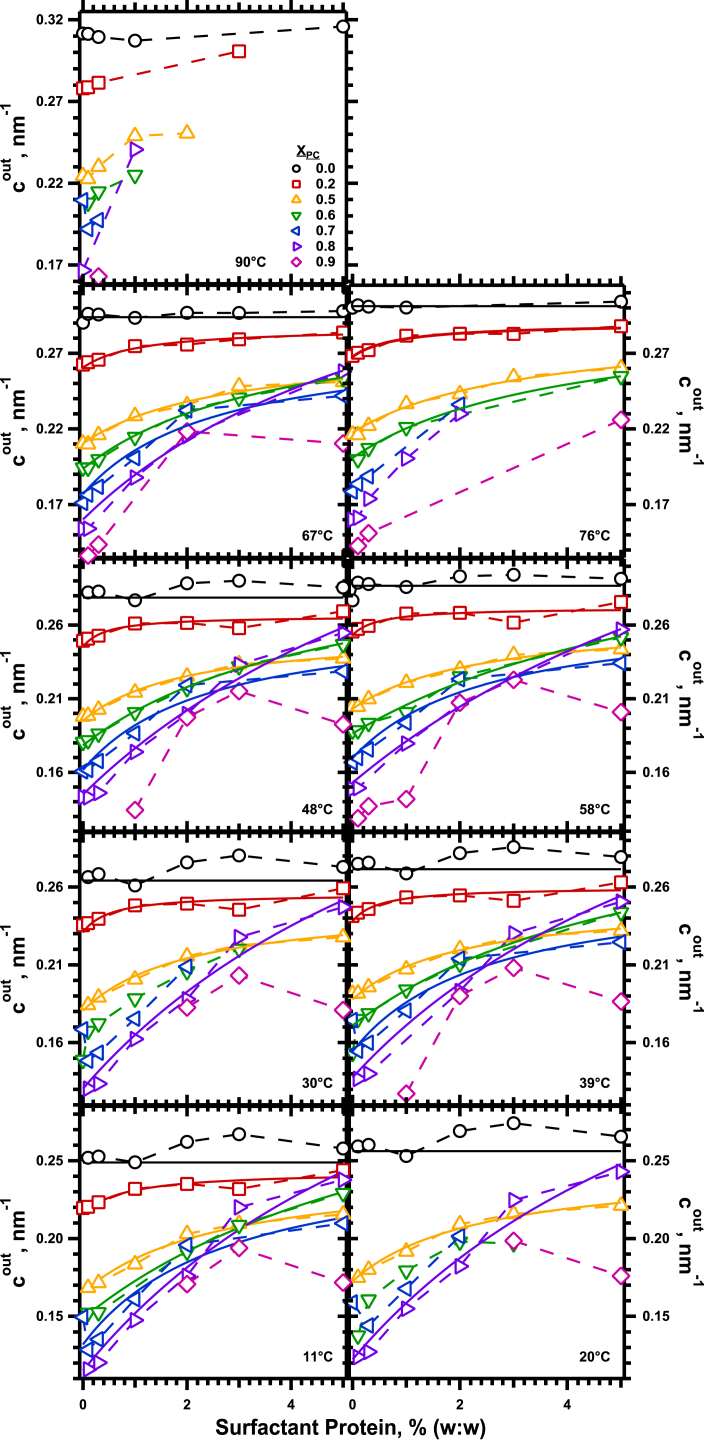
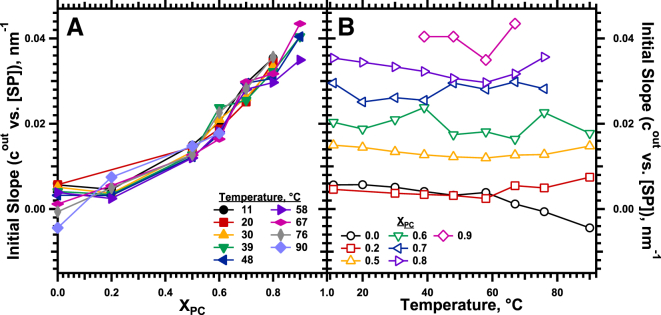
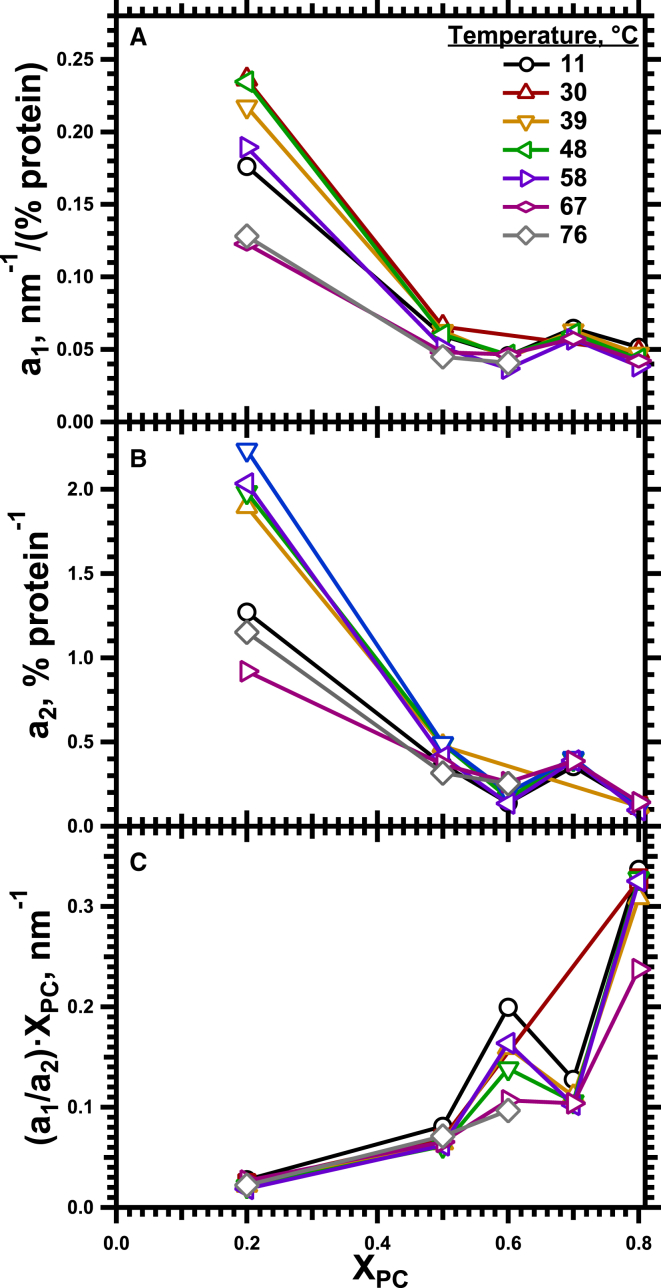
The hydrophobic surfactant proteins SP-B and SP-C greatly accelerate the adsorption of vesicles containing the surfactant lipids to form a film that lowers the surface tension of the air/water interface in the lungs. Pulmonary surfactant enters the interface by a process analogous to the fusion of two vesicles. As with fusion, several factors affect adsorption according to how they alter the curvature of lipid leaflets, suggesting that adsorption proceeds via a rate-limiting structure with negative curvature, in which the hydrophilic face of the phospholipid leaflets is concave. In the studies reported here, we tested whether the surfactant proteins might promote adsorption by inducing lipids to adopt a more negative curvature, closer to the configuration of the hypothetical intermediate. Our experiments used x-ray diffraction to determine how the proteins in their physiological ratio affect the radius of cylindrical monolayers in the negatively curved, inverse hexagonal phase. With binary mixtures of dioleoylphosphatidylethanolamine (DOPE) and dioleoylphosphatidylcholine (DOPC), the proteins produced a dose-related effect on curvature that depended on the phospholipid composition. With DOPE alone, the proteins produced no change. With an increasing mol fraction of DOPC, the response to the proteins increased, reaching a maximum 50% reduction in cylindrical radius at 5% (w/w) protein. This change represented a doubling of curvature at the outer cylindrical surface. The change in spontaneous curvature, defined at approximately the level of the glycerol group, would be greater. Analysis of the results in terms of a Langmuir model for binding to a surface suggests that the effect of the lipids is consistent with a change in the maximum binding capacity. Our findings show that surfactant proteins can promote negative curvature, and support the possibility that they facilitate adsorption by that mechanism.


Figures

Figure 1
Figure 1
Diagrams of pertinent curved structures. (A) Structure of the HII phase. The double-headed arrow indicates the lattice constant measured by diffraction. The solid circle approximates the location of the pivotal plane, at which the spontaneous curvature is estimated. The dashed circle gives the location of the outer surface of the cylindrical monolayer, the radius of which determines cout. (B) Hypothetical rate-limiting intermediate involved in the adsorption of phospholipid vesicles to an air/water interface (25).
Figure 2
Figure 2
Diffraction from samples of DOPE:DOPC with 16% (w/w) tetradecane and the hydrophobic surfactant proteins. The traces give the radially integrated, diffracted intensity produced by the dispersed samples as a function of the momentum transfer, q. The traces are shifted vertically by arbitrary amounts without a change in scale for clarity of presentation. The different panels illustrate the effects of (A) the content of surfactant protein, (B) the composition of the phospholipids, and (C) temperature. To see this figure in color, go online.
Figure 3
Figure 3
Response of the cylindrical phospholipid monolayers to the surfactant proteins. The panels share a common x axis. In the left column, which presents the lattice constant (a0) (left axis) for the HII phase, the range of the y axis is common to all panels, emphasizing the variation among samples with different XPC. In the right column, which gives cout (right axis), the different scales in the panels emphasize the shape of the curves. The samples, which contain 16% (w/w) tetradecane in addition to the phospholipids and proteins, were dispersed in buffered electrolyte (HSC). To see this figure in color, go online.
Figure 4
Figure 4
Effect of lipid composition on c0out for samples without proteins. To see this figure in color, go online.
Figure 5
Figure 5
Effect of temperature on the response of c0out to changes in composition for the lipids without proteins. The graph gives the slope (solid symbols, left axis) and intercept at XPC = 0 (open symbols, right axis) of the best linear fits to the data in Fig. 4. To see this figure in color, go online.
Figure 6
Figure 6
Variation of cout with XPC for the full set of samples. Each panel gives results for a specific temperature, with each curve representing the data for a specific concentration of protein. To see this figure in color, go online.
Figure 7
Figure 7
Effect of the proteins on the response of cout to changes in XPC. The slopes from linear fits to the variation of cout with XPC (Fig. 6) are plotted against the different concentrations of protein at each temperature. To see this figure in color, go online.
Figure 8
Figure 8
Dependence of cout on the concentration of protein. Each panel gives the data for a specific temperature, with each trace providing results for a specific XPC. The continuous curves give the best fit of the equation cout=c0out+a1SP/(1+a2SPXPC) to data (connected by dashed lines) that included measurements over the full range of protein concentrations. a1 and a2 are fitting parameters. c0out is the average value of c0out for a particular set of lipids, calculated from the linear fit for that temperature in Fig. 4. To see this figure in color, go online.
Figure 9
Figure 9
Initial response of cout to SP. Linear fits of cout to SP (Fig. 8) for the range of 0–3% protein provided the initial slopes. (A) Dependence on XPC at constant temperatures. (B) Effect of temperature for samples with fixed XPC. To see this figure in color, go online.
Figure 10
Figure 10
Dependence on XPC of the parameters that describe the variation of cout. Fits of the data to cout=c0out+a1SP/(1+a2SPXPC) (Fig. 8) provided the basis for calculating (A), a1; (B), a2; (C), (a1/a2XPC. To see this figure in color, go online.

References

    1. Zimmerberg J., Kozlov M.M. How proteins produce cellular membrane curvature. Nat. Rev. Mol. Cell Biol. 2006;7:9–19. - PubMed
    1. Markin V.S., Kozlov M.M., Borovjagin V.L. On the theory of membrane fusion. The stalk mechanism. Gen. Physiol. Biophys. 1984;3:361–377. - PubMed
    1. Chernomordik L., Chanturiya A., Zimmerberg J. The hemifusion intermediate and its conversion to complete fusion: regulation by membrane composition. Biophys. J. 1995;69:922–929. - PMC - PubMed
    1. Helfrich W. Elastic properties of lipid bilayers: theory and possible experiments. Z. Naturforsch. C. 1973;28:693–703. - PubMed
    1. Tamm L.K., Han X. Viral fusion peptides: a tool set to disrupt and connect biological membranes. Biosci. Rep. 2000;20:501–518. - PubMed

Publication types

MeSH terms

Substances

LinkOut - more resources