. 2015 Jul 16;523(7560):313-7.
doi: 10.1038/nature14583. Epub 2015 Jul 8.

Progesterone receptor modulates ERα action in breast cancer

Affiliations

Progesterone receptor modulates ERα action in breast cancer

Hisham Mohammed et al. Nature. .

Erratum in

  • Corrigendum: Progesterone receptor modulates ERα action in breast cancer.
    Mohammed H, Russell IA, Stark R, Rueda OM, Hickey TE, Tarulli GA, Serandour AA, Birrell SN, Bruna A, Saadi A, Menon S, Hadfield J, Pugh M, Raj GV, Brown GD, D'Santos C, Robinson JL, Silva G, Launchbury R, Perou CM, Stingl J, Caldas C, Tilley WD, Carroll JS. Mohammed H, et al. Nature. 2015 Oct 1;526(7571):144. doi: 10.1038/nature14959. Epub 2015 Aug 5. Nature. 2015. PMID: 26245370 No abstract available.

Abstract

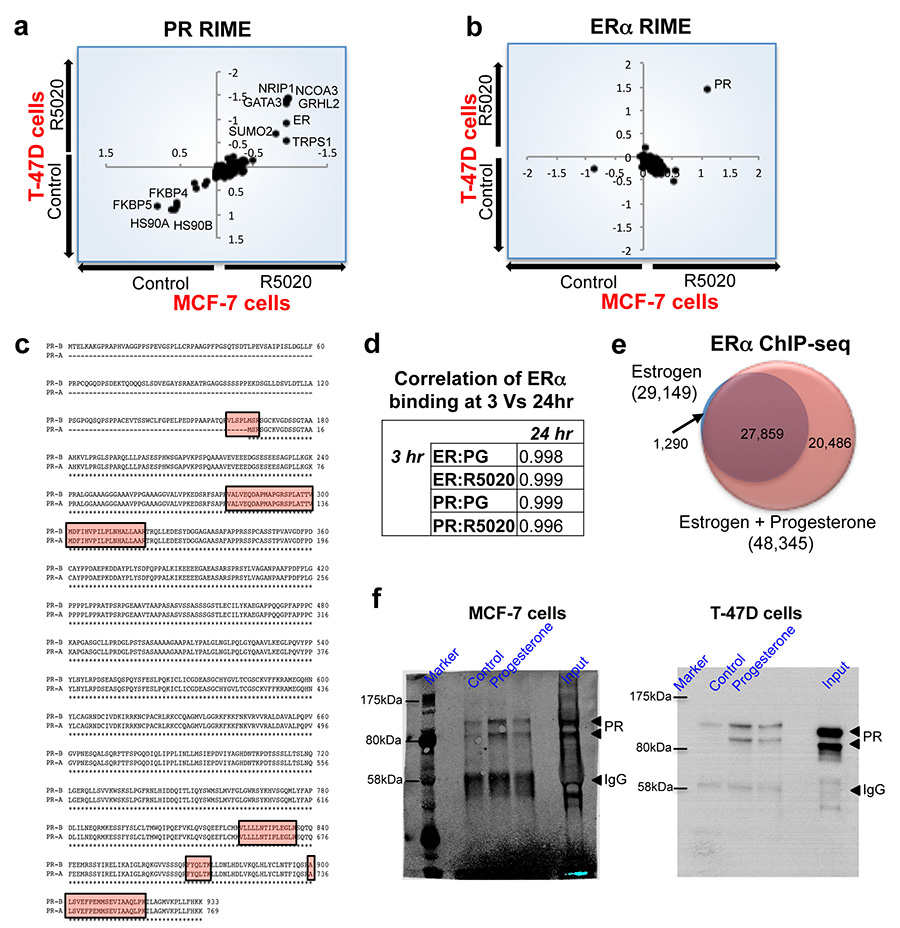
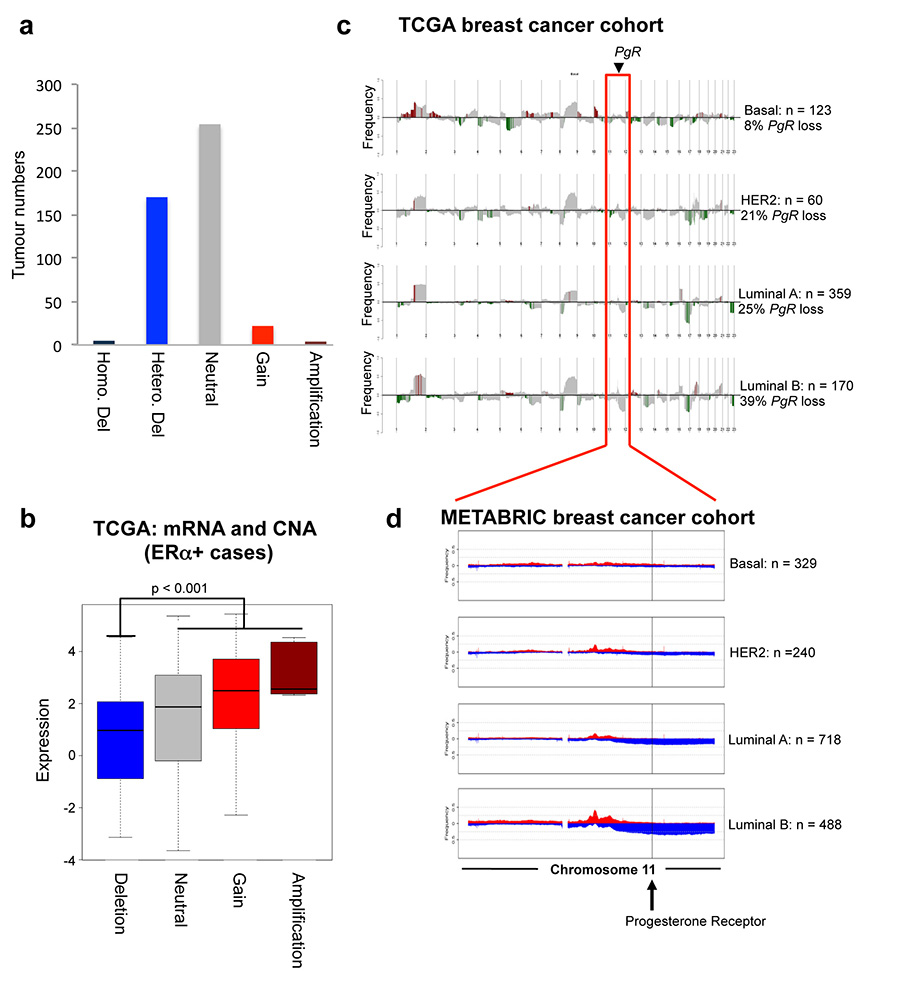
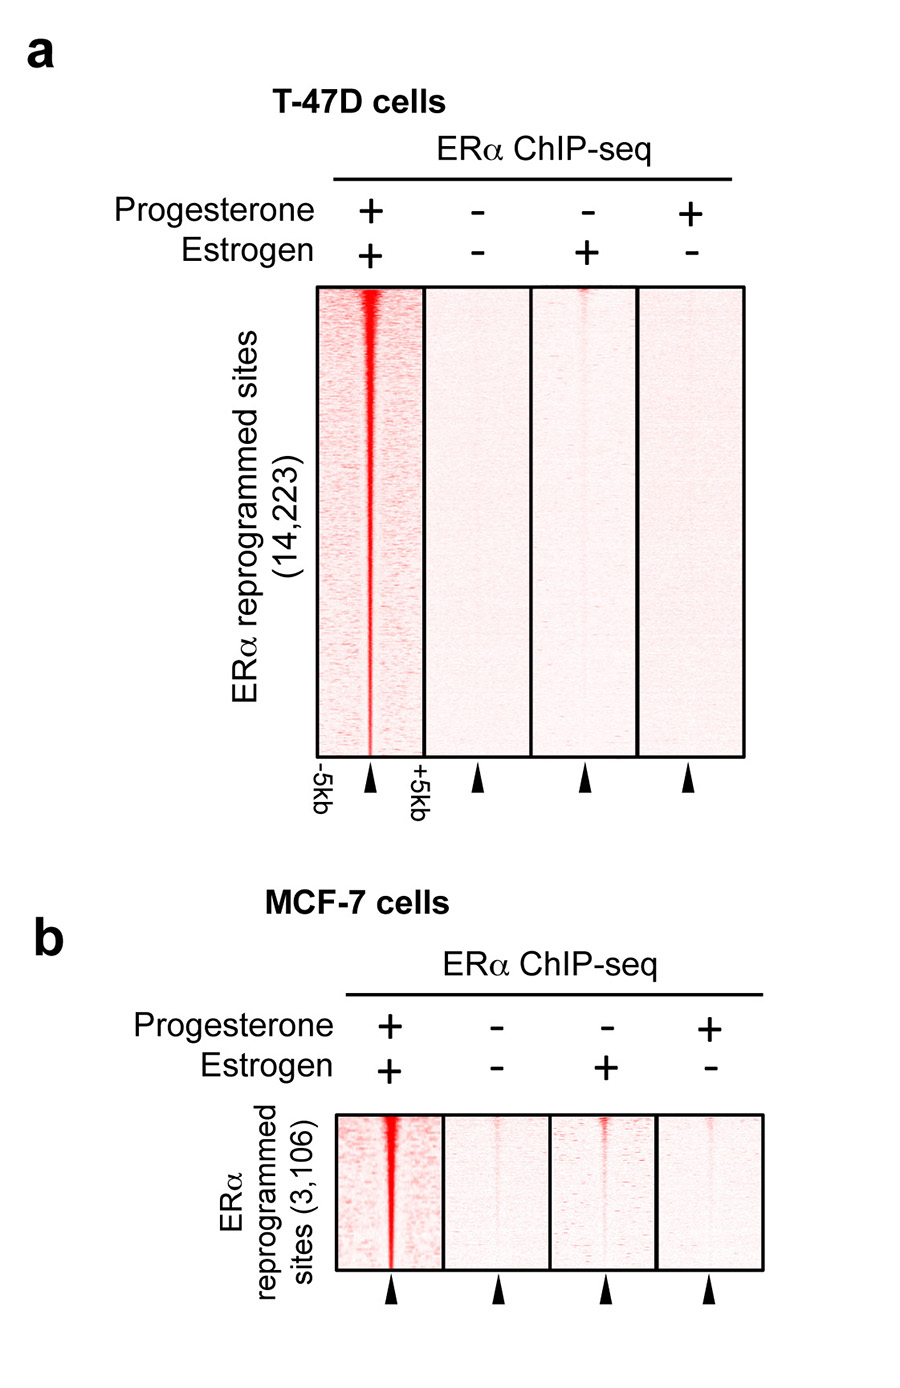
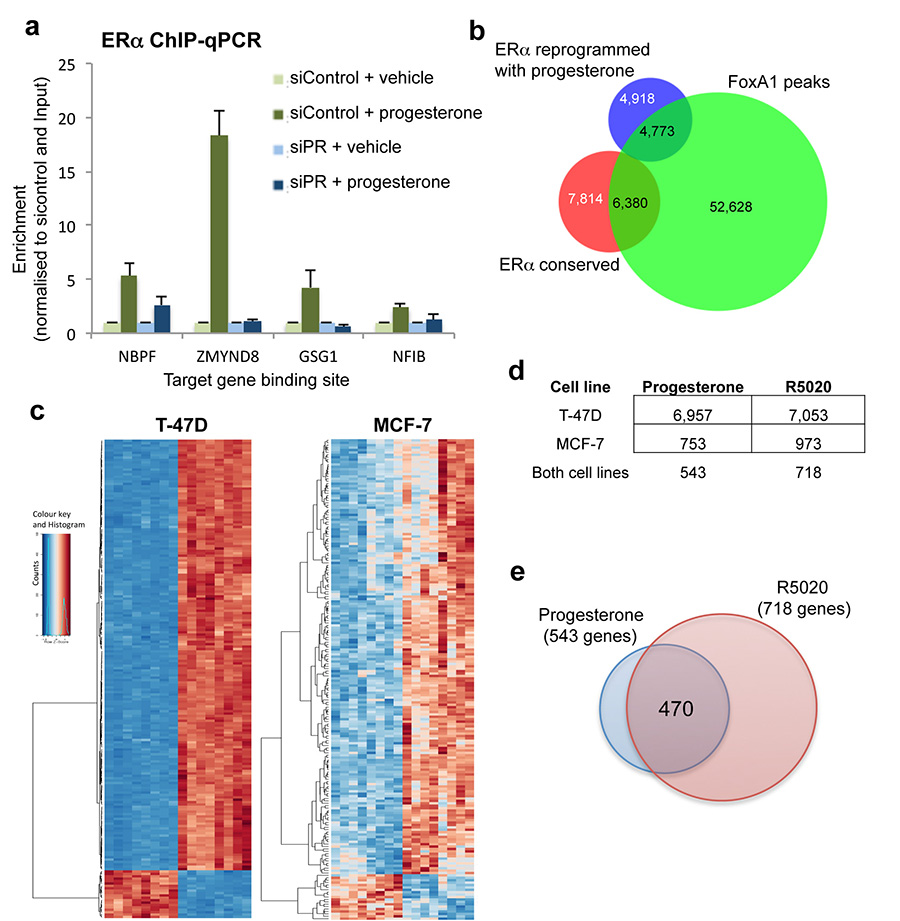
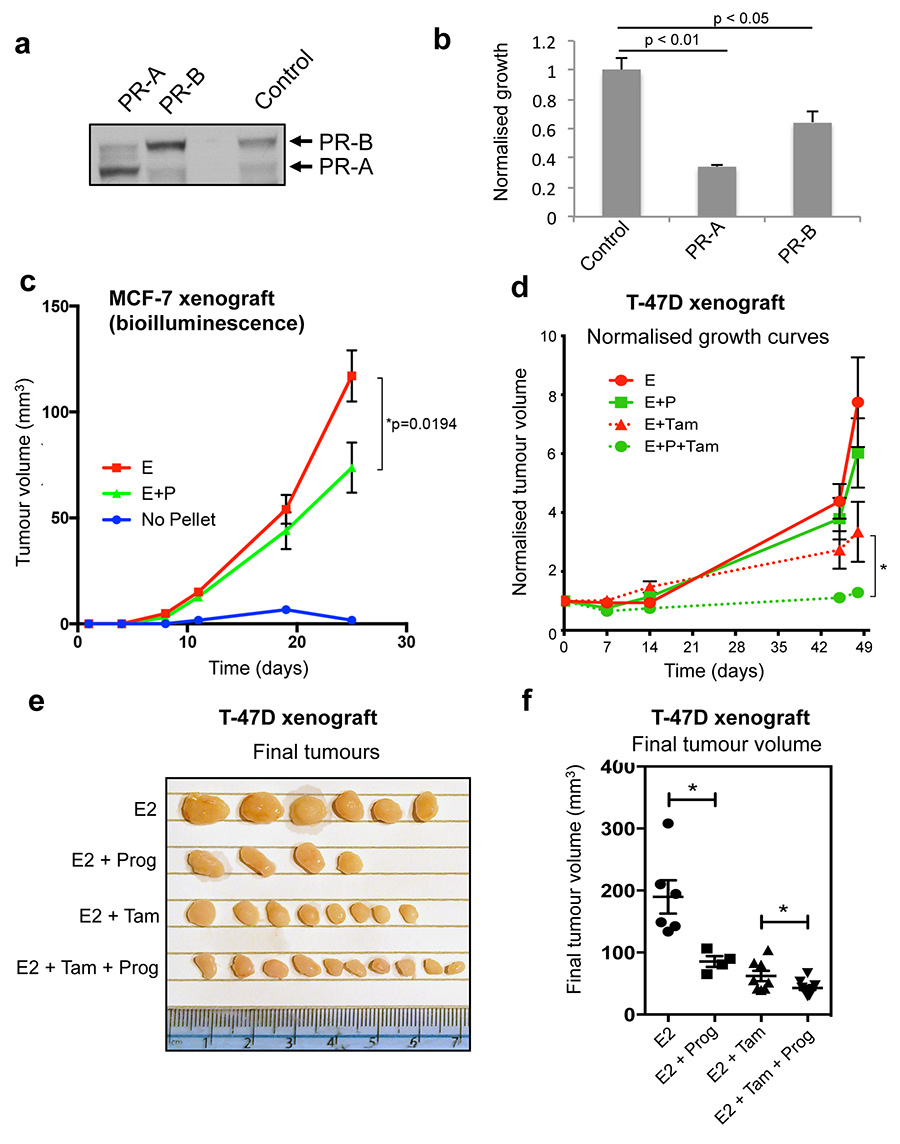
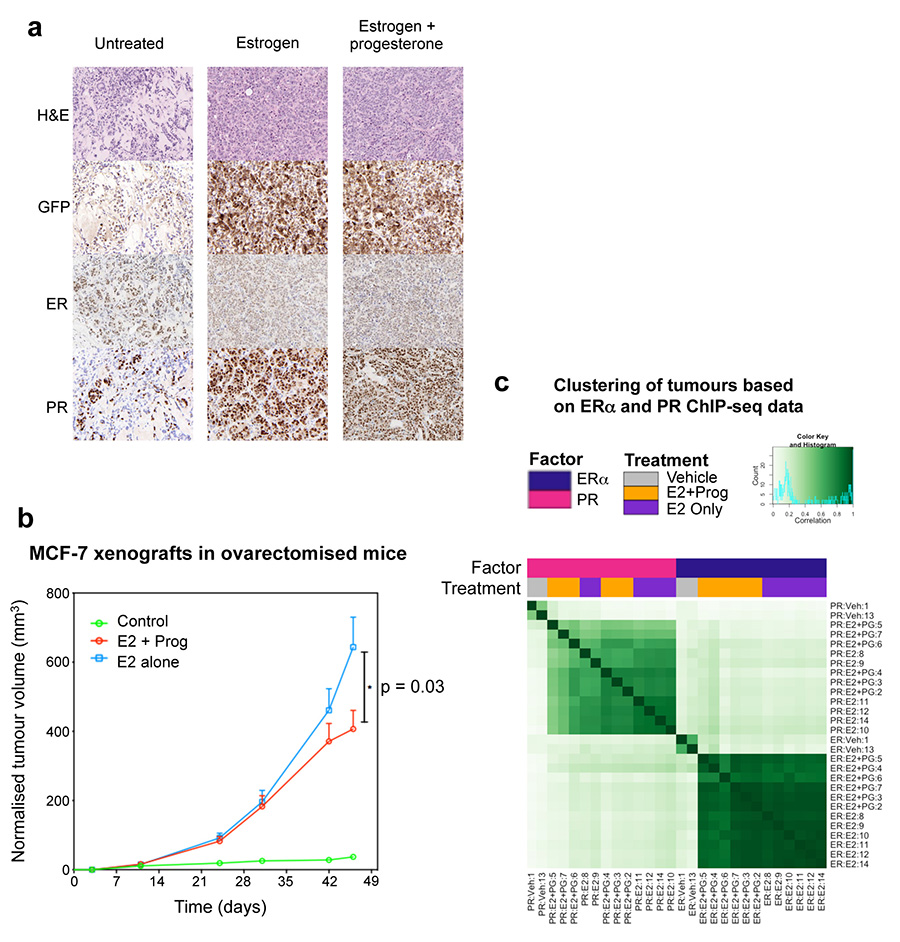
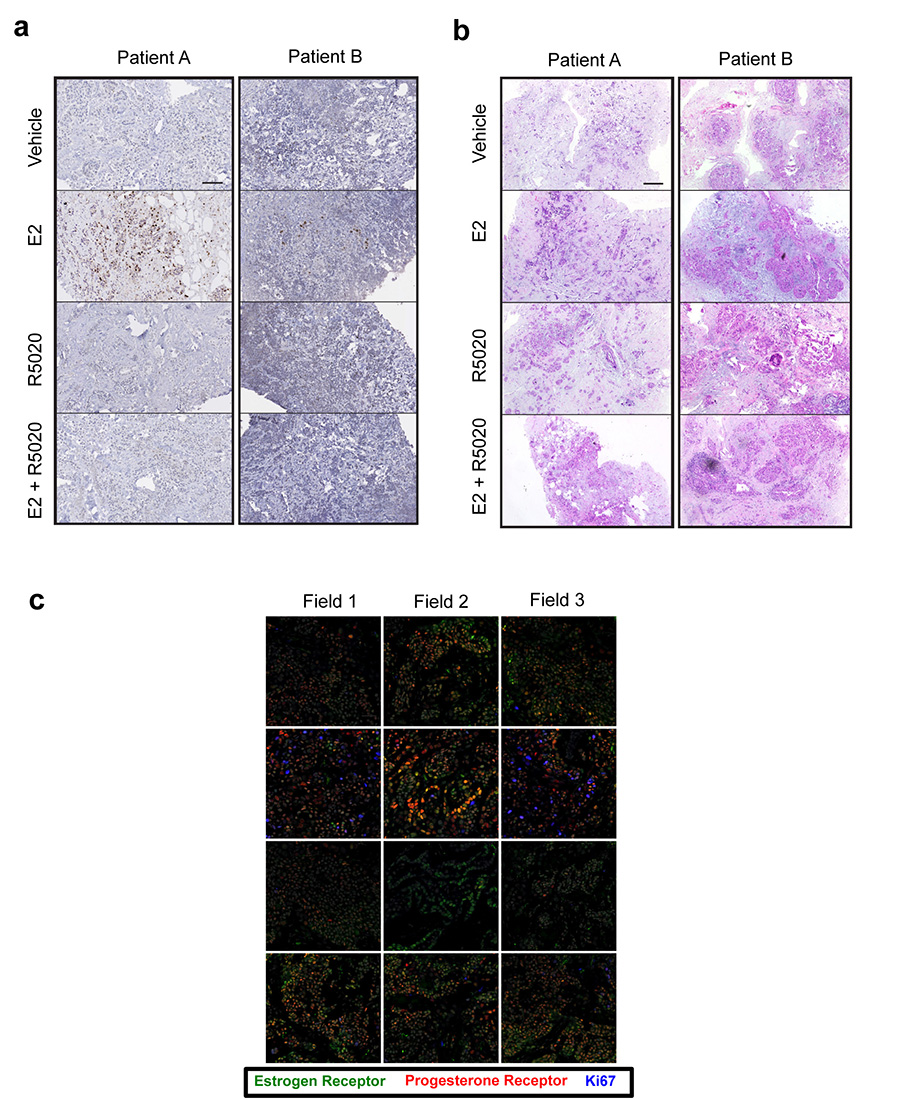
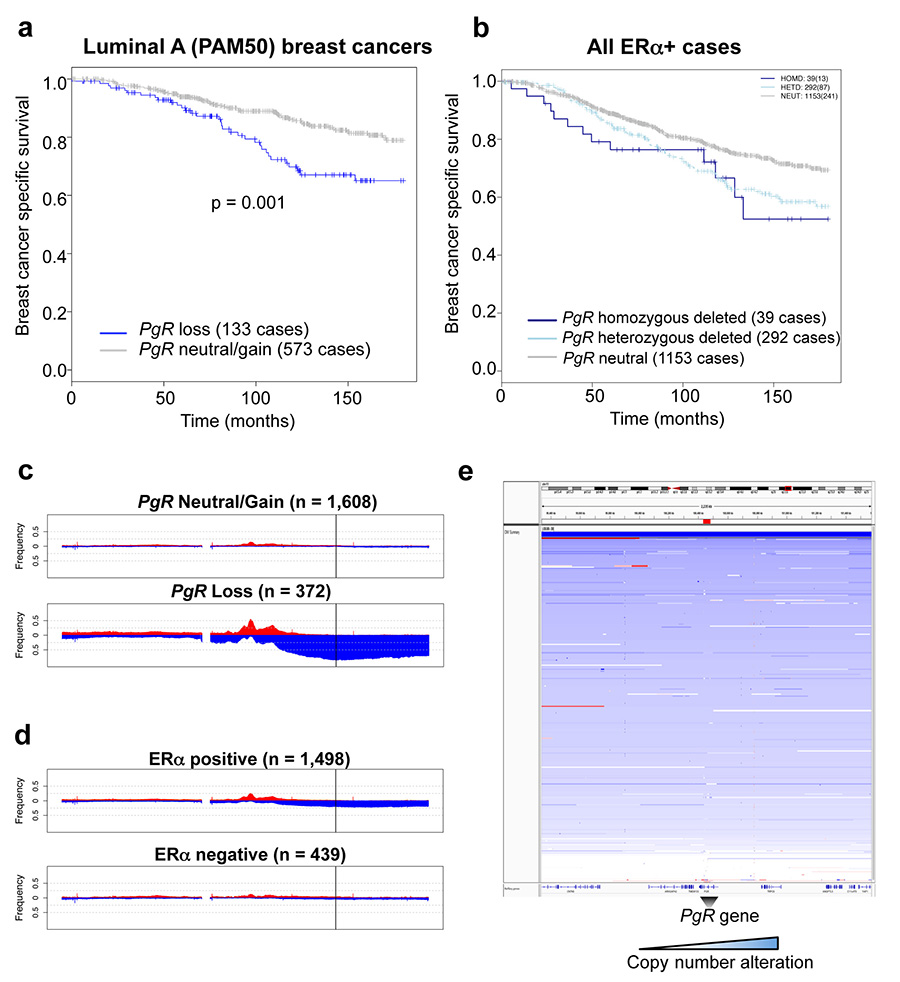
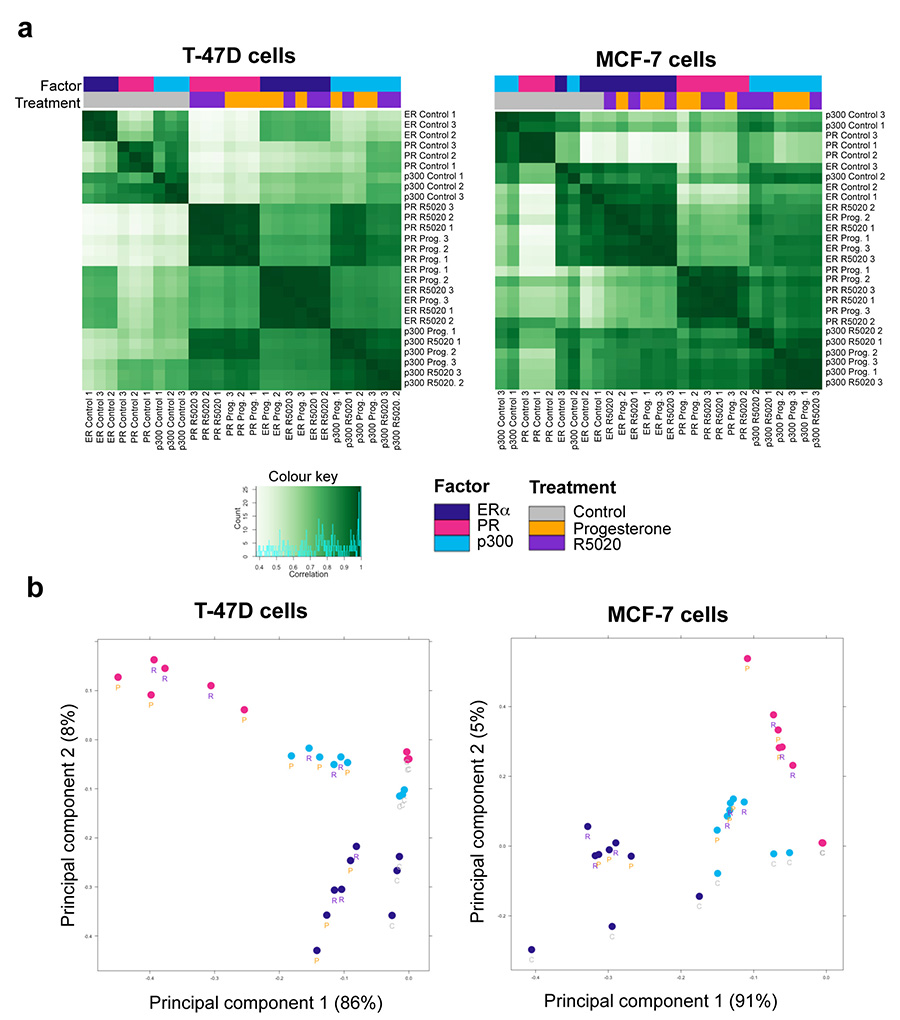
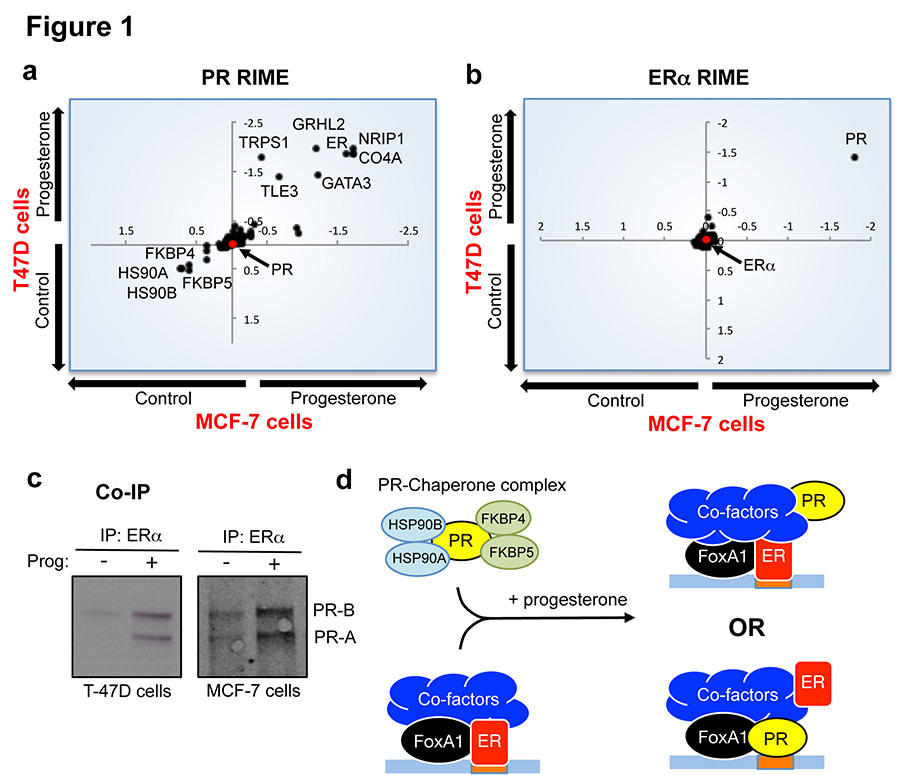
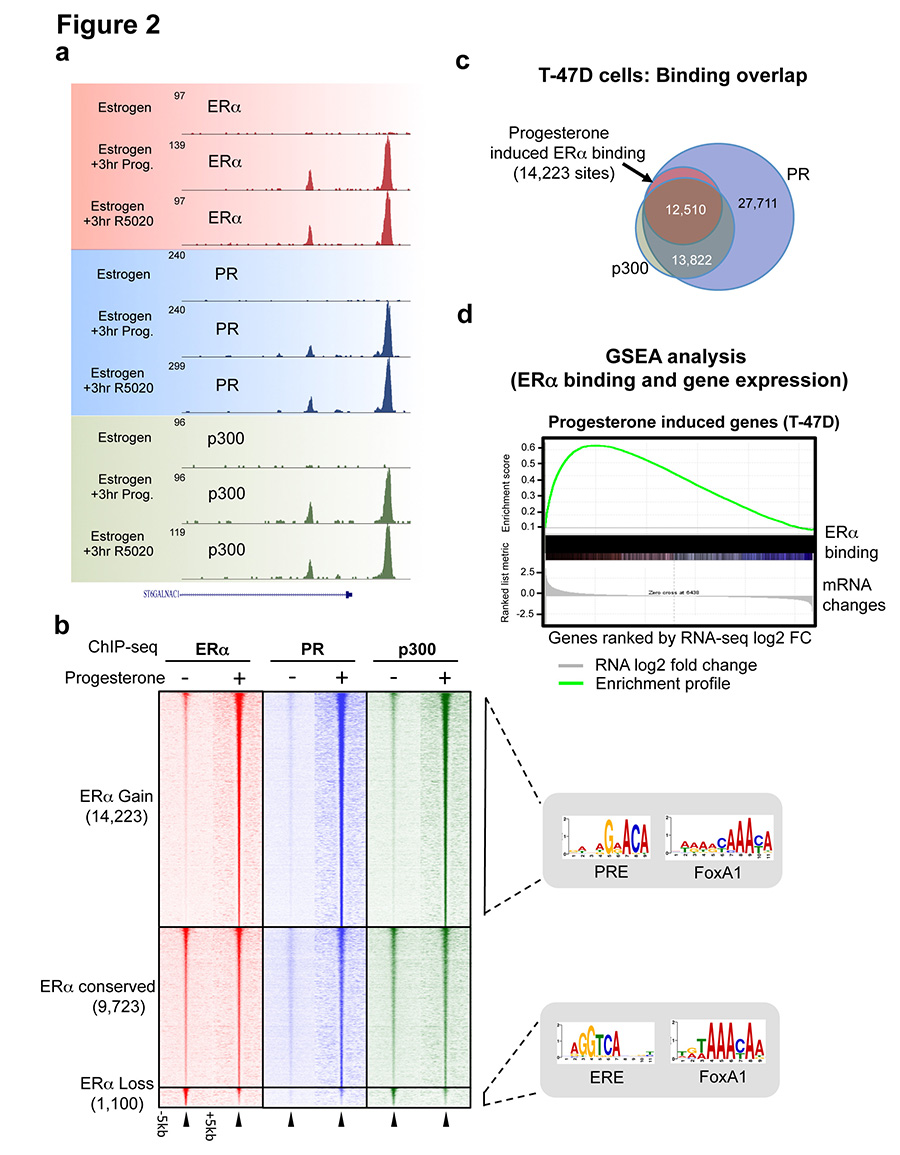
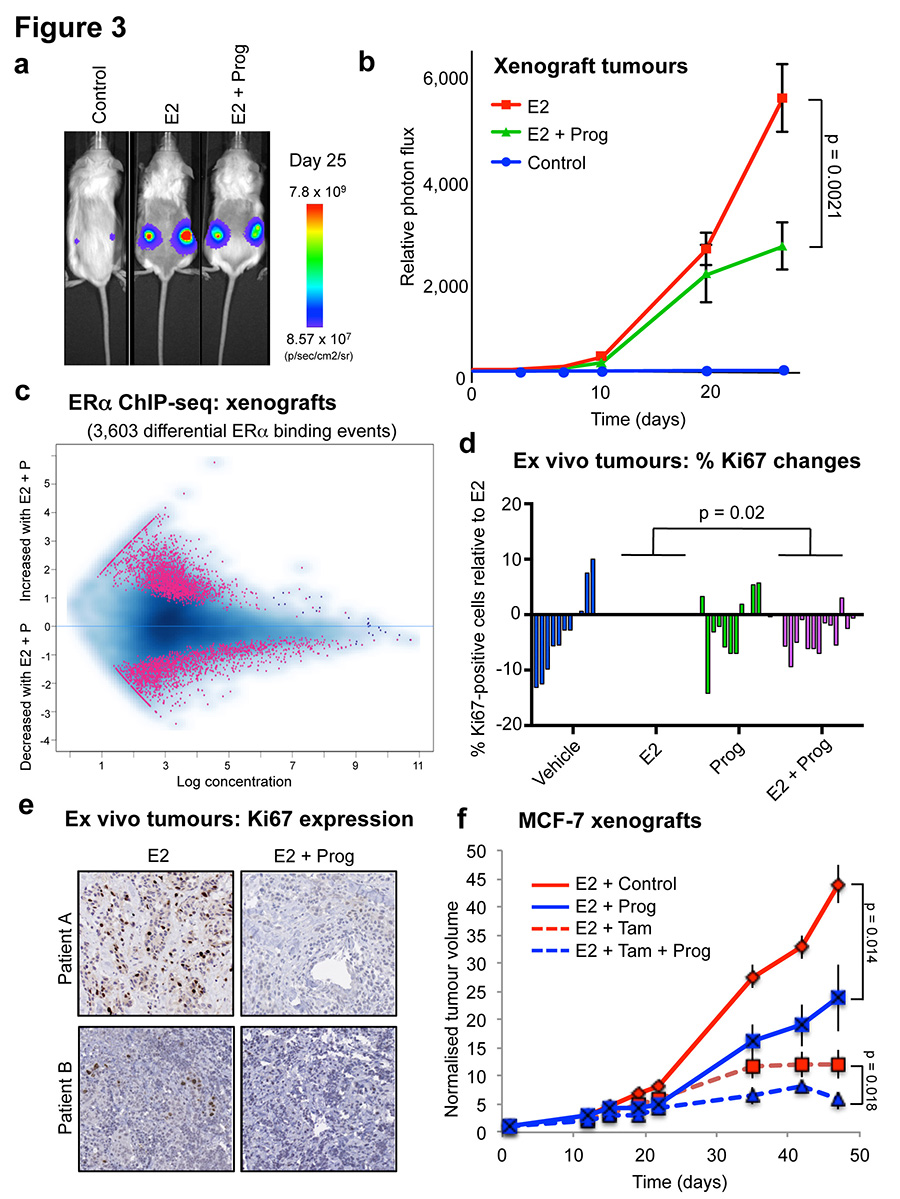
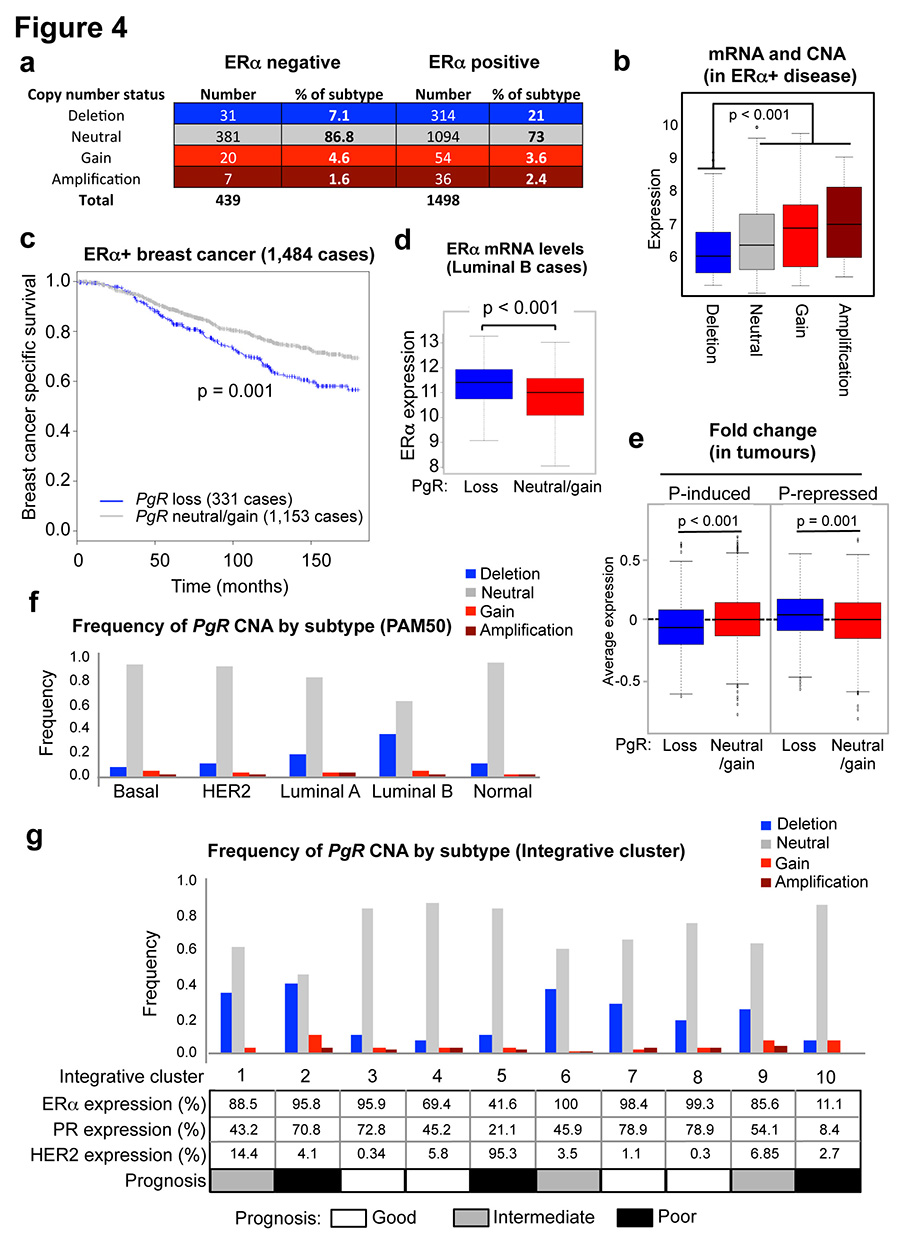
Progesterone receptor (PR) expression is used as a biomarker of oestrogen receptor-α (ERα) function and breast cancer prognosis. Here we show that PR is not merely an ERα-induced gene target, but is also an ERα-associated protein that modulates its behaviour. In the presence of agonist ligands, PR associates with ERα to direct ERα chromatin binding events within breast cancer cells, resulting in a unique gene expression programme that is associated with good clinical outcome. Progesterone inhibited oestrogen-mediated growth of ERα(+) cell line xenografts and primary ERα(+) breast tumour explants, and had increased anti-proliferative effects when coupled with an ERα antagonist. Copy number loss of PGR, the gene coding for PR, is a common feature in ERα(+) breast cancers, explaining lower PR levels in a subset of cases. Our findings indicate that PR functions as a molecular rheostat to control ERα chromatin binding and transcriptional activity, which has important implications for prognosis and therapeutic interventions.


Figures

Extended data figure 1
Extended data figure 1. Protein purification of ERα and PR interacting proteins, using RIME, following treatment with a synthetic progestin
T-47D and MCF-7 breast cancer cells were grown in SILAC-isotope containing media and treated with either vehicle control or R5020, a synthetic progestin for 3hr. PR (a) or ERα (b) RIME was conducted and the proteins that were quantitatively enriched in both cell lines are shown. Only proteins that were enriched with a FDR < 1% were included. c. Peptide coverage of the PR protein following ERα RIME in T-47D cells. The identified peptides are highlighted and one of the peptides covers the ‘Bus’ region representing the PR-B isoform. d. Comparison of binding at different time points and treatment of MCF-7 breast cancer cells with progesterone. ERα ChIP-seq at 3hr and 24hrs results in comparable binding. Correlation between Progesterone (PG) and R5020 (RO) at 3 and 24 hrs. e. MCF-7 cells were grown in estrogen rich complete media and treated with progesterone or vehicle control for 3hr. ERα ChIP was conducted and peaks that occurred in at least two of three independent replicates were considered. Venn diagram showing the changes in ERα binding following progesterone treatment of MCF-7 cells. f. Uncropped Western blots from Figure 1c.
Extended data figure 2
Extended data figure 2. Validation of genomic copy number loss in the PgR gene in an independent dataset
a. TCGA ERα+ breast cancers were assessed for copy number changes in PgR. The number of tumours in each category, based on copy number changes. Only included were ERα+ breast cancers. b. Correlation between PR mRNA levels and copy number status in all luminal breast cancers within the TCGA cohort. The heterozygous and homozygous deletions are combined. c. Frequency of copy number alterations across entire genome in TCGA breast cancer cohort, stratified based on subtype using PAM50 signature. Chromosome 11, which encompasses PgR gene is highlighted and the frequency of copy number loss of the PgR genomic region is provided. d. Copy number changes on chromosome 11 within the METABRIC cohort, based on subtype stratification (PAM50 signature).
Extended data figure 3
Extended data figure 3. ERα binding in single hormone conditions
a. T47-D or MCF-7 (b) cells were hormone deprived and treated with vehicle control, estrogen alone or progesterone alone. ERα ChIP-seq was conducted and we assessed the binding at the regions previously shown to be reprogrammed by estrogen plus progesterone. The ERα reprogramming data under both estrogen and progesterone conditions in the T-47D cells is from Figure 2b. In the absence of estrogen, progesterone does not induce ERα binding. In the absence of progesterone, estrogen does not induce ERα binding to the locations shown to acquire reprogrammed ER binding events under dual hormone conditions.
Extended data figure 4
Extended data figure 4. Validation of binding and gene expression changes
a. Validation of dependence on PR for ERα binding and overlap between ERα binding and FoxA1 binding. T-47D cells were grown in full, estrogen-rich media and transfected with siControl or siRNA to PR. ERα ChIP was conducted followed by qPCR of several novel ERα binding events only observed under progesterone treatment conditions. In the absence of PR, ERα is not able to associate with the progesterone-induced binding sites. The figure represents one biological replicate of three competed replicates and the error bars represent standard deviation of the technical ChIP-PCR replicates. b. Venn diagram showing the ERα binding events that were conserved in T-47D cells (i.e. not altered by progesterone when compared to estrogen alone) and the ERα binding events that were reprogrammed by progesterone treatment, when overlapped with FoxA1 ChIP-seq data from T-47D cells. The FoxA1 ChIP-seq data from T-47D cells was from Hurtado, et al, Nature Genetics, 2011, 43:27-33. c. Differential gene changes in MCF-7 and T-47D cells following treatment with progesterone or R5020 for 3hr. Heatmap showing gene changes relative to matched controls. Eight replicates were included. d. Table showing the differentially regulated genes in the two cell lines and in the two treatment conditions. e. Overlap between genes regulated by progesterone (in both cell lines) and gene regulated by the synthetic progestin R5020 (in both cell lines).
Extended data figure 5
Extended data figure 5. Analysis of gene expression changes and generation of gene signature
a. RNA-seq was conducted after progesterone or R5020 treatment for 3hr. GSEA analysis was conducted on progesterone/R5020 repressed genes with lost ERα binding events observed in T47-D cells. The progesterone-decreased ERα binding regions correlate with progesterone down-regulated genes. b. Kaplan Meier survival curve in 1,959 breast cancer patients based on a gene signature derived from the progesterone regulated genes and progesterone regulated ERα binding events. For a gene to be considered it was differentially regulated by progesterone/progestin (as measured by RNA-seq) and the gene had a differentially regulated ERα binding event within 10kb of the transcription start site. This resulted in 38 genes (c). d. Performance of progesterone induced gene signature at separating based on survival over 392 patients in top or bottom 10% of expression compared to null distribution of p-values computed using 1000 randomly selected 38-gene signatures. e. Copy number alterations on chromosome 11 in T-47D and MCF-7 cells. Green is copy number neutral, blue is copy number loss and red is copy number gain. T-47D cells have an amplification of the chromosome 11 region encompassing the PgR gene and MCF-7 cells have a copy number loss of this genomic region.
Extended data figure 6
Extended data figure 6. PR inhibits cell line growth and progesterone inhibits T-47D xenograft growth
a. MCF-7 cells were transfected with control vector, PR-A or PR-B expressing vectors. Western blotting confirmed the expression of the appropriate PR isoform. b. Growth was assessed following estrogen plus progesterone treatment. The graph represents the average of three independent biological replicates and the error bars represent standard deviation. c. Assessment of MCF-7 xenograft tumour growth by physical measurement of tumour volume. Ten tumours for each condition (two in each of five mice per condition) were included. The data was analysed using a t-test and the error bars represent +/- SEM. d. T-47D xenografts were established in NSG mice. Ten tumours for each condition (two in each of five mice per condition) were included. All were grown in the presence of estrogen (E2) pellets and subsequently supplemented with vehicle, progesterone, tamoxifen or tamoxifen plus progesterone. Normalised tumour growth is shown. The data was analysed using a t-test and the error bars represent +/- SEM. e. Final T-47D xenograft tumour volumes are shown. f. Final T-47D xenograft tumour volumes plotted graphically.
Extended data figure 7
Extended data figure 7. Histological analysis of xenograft tumours and ChIP-seq from xenograft tumours in ovariectomised mice
a. Histological analysis of MCF-7 xenograft tumours in untreated, estrogen or estrogen plus progesterone conditions. Tumours were taken from 25 day treated conditions. The human xenograft cells expressed GFP, permitting discrimination between human tumour cells and mouse host cells. MCF-7 xenograft experiment in ovariectomised mice. b. In order to map ERα binding events by ChIP-seq in MCF-7 xenograft tumours, we repeated the experiment in ovariectomised mice to eliminate any issues related to the endogenous mouse progesterone. Ten tumours for each condition (two in each of five mice per condition) were included. Growth of xenograft tumours under different hormonal conditions, Control, estrogen alone (E2) and estrogen plus progesterone (E2 + Prog). The data was analysed using a t-test and the error bars represent +/- SEM. c. ChIP-seq for ERα and PR were conducted in six matched tumours from each hormonal condition. Also included were two tumours from no hormone conditions. Correlation heatmap of all samples.
Extended data figure 8
Extended data figure 8. Primary tumours cultivated as ex vivo explants shown response to progesterone
Representative images of primary breast cancer explant tissue sections treated with vehicle, estrogen (E2), the progestin R5020 or estrogen plus progestin (E2 + R5020). These sections were probed with anti-Ki67 (brown) to label proliferating cells (a) or Haematoxylin and Eosin (b) . Each image is of a single tissue segment from a selection of 3-4 sections per sample treatment. Scale bar = 100mm. c. Confocal microscopy images (representative fields from each of the triplicate fragments) of a representative primary breast cancer explant tissue treated with vehicle, estrogen (E2), the progestin R5020 (Progestin) or estrogen plus progestin (E2 + R5020) and probed with anti-ERα (green), anti-PR (red) and anti-Ki67 to assess proliferating cells (blue).
Extended data figure 9
Extended data figure 9. Analysis of PgR copy number loss in the METABRIC cohort
a. Kaplan Meier analysis of breast cancer specific survival within the METABRIC cohort. Only within luminal A tumours (based on PAM50 gene expression signature), tumours were stratified based on copy number loss of PgR or not. In total 19% of luminal A tumours contain a copy number loss of the PgR genomic locus and these patients have a poorer clinical outcome. b. All ERα+ cases were stratified based on PgR copy number status, showing tumours with heterozygous and homozygous deletions separately. c. Chromosome 11 in tumours with neutral or gained PgR versus those with copy number loss of the PgR gene (defined by line). d. Chromosome 11 copy number status between ERα positive and negative tumours. e. Visual representation of all ERα+ tumours with a copy number alteration at the PgR genomic locus, showing the copy number changes relative to the PgR gene (highlighted below) and the surrounding ~2.2 Mb of genomic sequence.
Extended data figure 10
Extended data figure 10. Clustering of ERα, PR, and p300 ChIP-seq experiments in two ERα+ cell lines
For each experiment, all binding sites identified as overlapping in at least two samples are merged and retained, and normalised read counts computed at each site for each sample. a. Clustering correlation heatmaps, based on Pearson correlations read scores (with replicate numbers in the labels), show good reproducibility between replicates and similarity of natural and synthetic hormone treatments. b. PCA plots showing the two most significant principal components (with samples labeled with treatment type: “C” for full-media control conditions, “P” for progesterone, and “R” for R5020). The data from the two cell lines is shown.
Figure 1
Figure 1. PR is a novel ERα interacting protein following progesterone treatment
MCF-7 and T-47D breast cancer cells were SILAC labelled, treated with hormones and harvested for RIME (endogenous protein purification-mass spectrometry) of either PR (a) or ERα (b). Differential proteins identified in both cell lines are plotted and all proteins are provided in Supplementary table 1. The axes represent log fold change. c. Co-IP validation of PR interactions with ERα. Both PR isoforms interact with ERα. d. Model showing possible mechanisms of interplay between PR and ERα (ER)-co-factor complex.
Figure 2
Figure 2. Progesterone redirects estrogen-stimulated ERα binding events to novel chromatin loci and transcriptional targets
ChIP-seq for ERα, PR and the co-activator p300 in T-47D cells grown in estrogen-rich media and treated with progesterone or R5020. a. Example binding region of a progesterone/R5020 induced ERα, PR and p300 binding event. b. Heatmap of ERα, PR and p300 ChIP-seq data from T-47D cells after 3hr of progesterone treatment. The heatmap is shown in a horizontal window of −/+ 5kb. Also shown are the enriched motifs within each category. c. Overlap between progesterone-induced ERα, PR and p300 binding sites, representing only the progestogen-induced ERα binding events. d. RNA-seq was performed after progesterone or R5020 treatment for 3hr under estrogenic condition (control). GSEA analysis was conducted, comparing progestogen-induced transcripts with progestogen-induced ERα binding events within T-47D cells.
Figure 3
Figure 3. Progesterone treatment inhibits ERα+ tumour progression
a. MCF-7-Luciferase cells were implanted in NSG mice with control, estrogen (E2) pellets or estrogen plus progesterone (E2 + Prog) pellets (n = 10). b. Graphical representation of tumour formation, as assessed by bioluminescence. c. ERα ChIP-seq was conducted on randomly chosen (n = 6) xenograft tumours from ovariectomised NSG mice treated with estrogen alone or estrogen plus progesterone. MA plot representing changes in ERα binding. d. Proliferative responses (Ki67 staining) of primary breast cancer tissues cultured ex vivo with estrogen (E2) or progestin (R5020) alone or both in combination (n = 14 samples/treatment; except for vehicle (n = 11) and R5020 treatments (n =12)). The p-value was calculated using a linear mixed effect analysis. e. Representative images of Ki67 immunostaining in ex vivo cultured breast tumour tissue sections from two patients (scale bar = 100um). f. MCF-7 xenografts were grown in NSG mice in the presence of estrogen pellets. Mice were treated with vehicle, tamoxifen, progesterone or tamoxifen plus progesterone and normalised tumour volume is shown. The data was analysed using a t-test and the error bars represent +/- SEM.
Figure 4
Figure 4. The PgR genomic locus undergoes copy number loss in ERα+ breast cancer
a. METABRIC breast cancers (1,937 in total) were assessed for copy number change in the PgR genomic locus. b. Correlation between PR mRNA levels and copy number status within all ERα+ cases. The estimate of differences is 0.3551, 95% confidence interval: [0.244, 0.463]. c. Kaplan Meier curve showing breast cancer specific survival in all ERα+ cases. Cox model analysis: Hazard ratio = 1.46 [1.156, 1.843]. d. Changes in ERα mRNA levels in luminal B tumours within the METABRIC cases. The estimate of differences is 0.4436, 95% confidence interval: [0.269, 0.618]. e. The expression levels of the stringent progestogen-induced or repressed genes from the cell lines cultured under estrogenic conditions, were assessed in the ERα+ METABRIC tumours. Relative fraction of tumours with PgR CNA events within molecular subtypes, based on the PAM50 gene expression profile (f) and the ten integrative clusters (g).

Comment in

References

    1. Chlebowski RT, et al. Estrogen plus progestin and breast cancer incidence and mortality in postmenopausal women. JAMA. 2010;304:1684–1692. doi:10.1001/jama.2010.1500 304/15/1684 [pii] - PMC - PubMed
    1. Bentel JM, et al. Androgen receptor agonist activity of the synthetic progestin, medroxyprogesterone acetate, in human breast cancer cells. Mol Cell Endocrinol. 1999;154:11–20. doi:S0303-7207(99)00109-4 [pii] - PubMed
    1. Fournier A, Berrino F, Clavel-Chapelon F. Unequal risks for breast cancer associated with different hormone replacement therapies: results from the E3N cohort study. Breast cancer research and treatment. 2008;107:103–111. doi:10.1007/s10549-007-9523-x. - PMC - PubMed
    1. Blows FM, et al. Subtyping of breast cancer by immunohistochemistry to investigate a relationship between subtype and short and long term survival: a collaborative analysis of data for 10,159 cases from 12 studies. PLoS Med. 2010;7:e1000279. doi:10.1371/journal.pmed.1000279. - PMC - PubMed
    1. Vignon F, Bardon S, Chalbos D, Rochefort H. Antiestrogenic effect of R5020, a synthetic progestin in human breast cancer cells in culture. J Clin Endocrinol Metab. 1983;56:1124–1130. - PubMed

Publication types

MeSH terms

Associated data