. 2015 Oct;19(10):2469-80.
doi: 10.1111/jcmm.12641. Epub 2015 Jul 8.

A novel TXNIP-based mechanism for Cx43-mediated regulation of oxidative drug injury

Affiliations

A novel TXNIP-based mechanism for Cx43-mediated regulation of oxidative drug injury

Kun Gao et al. J Cell Mol Med. 2015 Oct.

Abstract

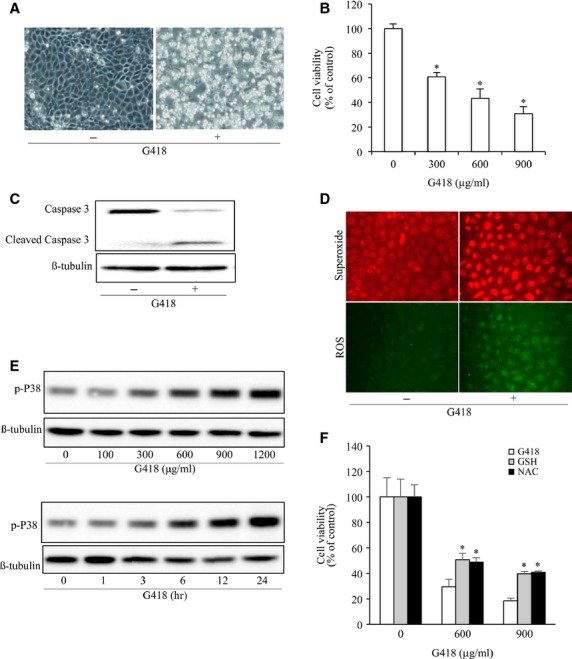
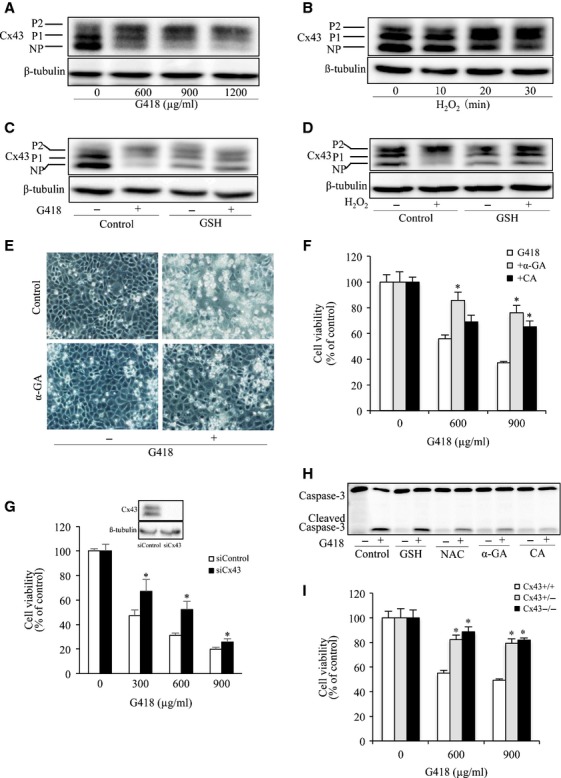
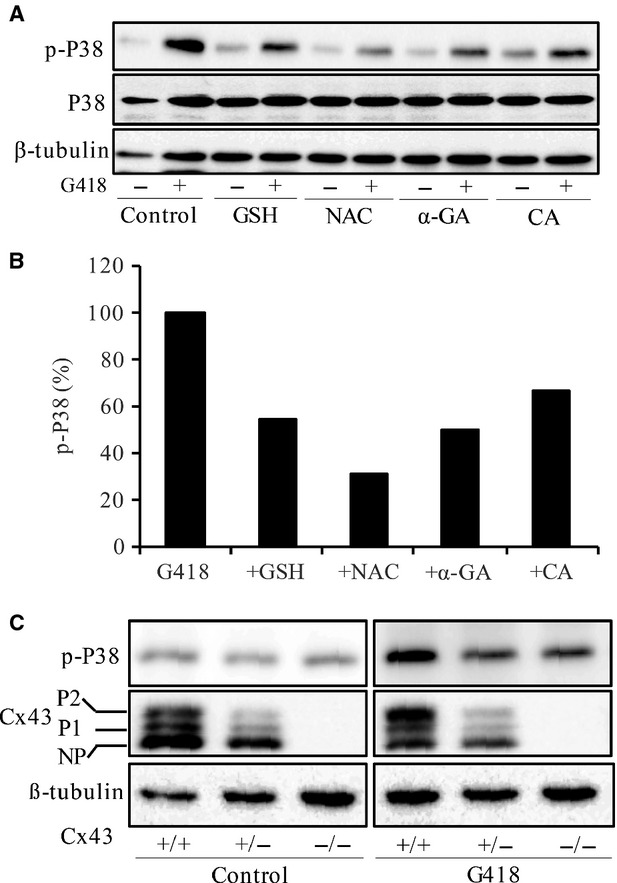
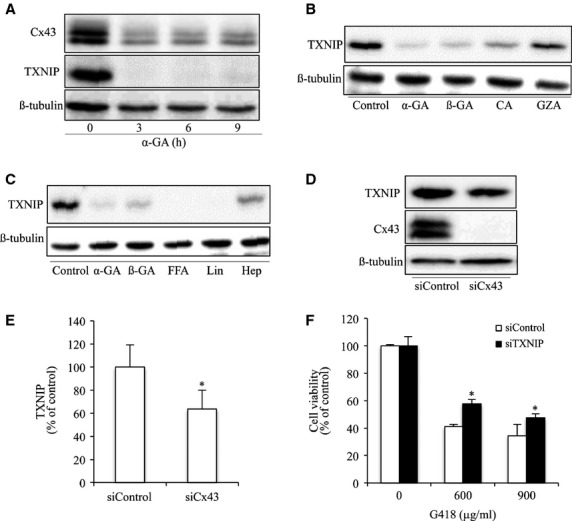
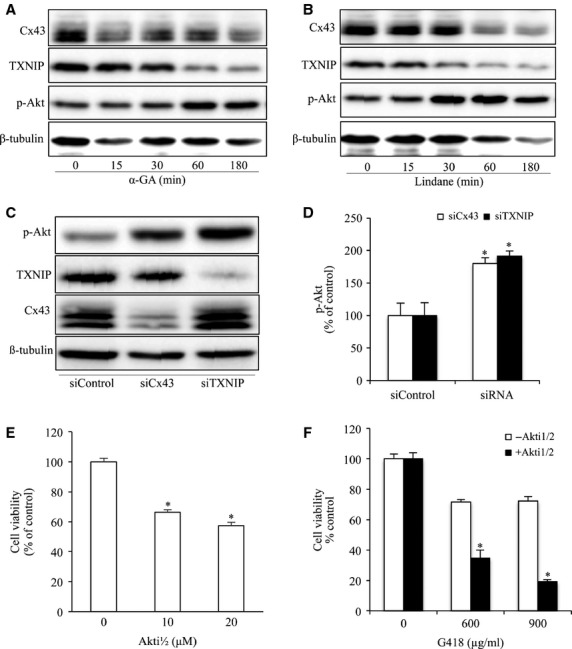
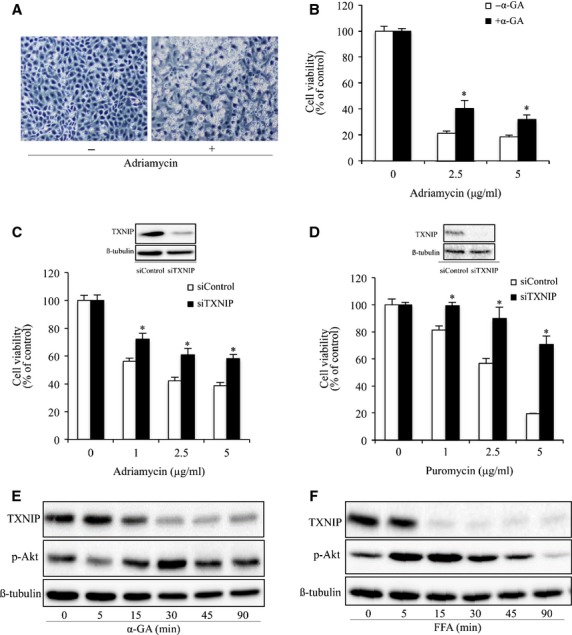
Gap junctions (GJs) play an important role in the regulation of cell response to many drugs. However, little is known about their mechanisms. Using an in vitro model of cytotoxicity induced by geneticin (G418), we explored the potential signalling mechanisms involved. Incubation of cells with G418 resulted in cell death, as indicated by the change in cell morphology, loss of cell viability and activation of caspase-3. Before the onset of cell injury, G418 induced reactive oxygen species (ROS) generation, activated oxidative sensitive kinase P38 and caused a shift of connexin 43 (Cx43) from non-phosphorylated form to hyperphosphorylated form. These changes were largely prevented by antioxidants, suggesting an implication of oxidative stress. Downregulation of Cx43 with inhibitors or siRNA suppressed the expression of thioredoxin-interacting protein (TXNIP), activated Akt and protected cells against the toxicity of G418. Further analysis revealed that inhibition of TXNIP with siRNA activated Akt and reproduced the protective effect of Cx43-inhibiting agents, whereas suppression of Akt sensitized cells to the toxicity of G418. Furthermore, interference of TXNIP/Akt also affected puromycin- and adriamycin-induced cell injury. Our study thus characterized TXNIP as a presently unrecognized molecule implicated in the regulatory actions of Cx43 on oxidative drug injury. Targeting Cx43/TXNIP/Akt signalling cascade might be a promising approach to modulate cell response to drugs.

Keywords: Akt; TXNIP; connexin 43; cytotoxicity; gap junction; oxidative stress.


Figures

Figure 1
Figure 1
Aminoglycoside elicits oxidative cell injury. (A) Induction of cell shape change by G418. NRK cells were exposed to 600 μg/ml G418 for 48 hrs. Cell morphology was photographed using phase-contrast microscopy (magnification, ×100). (B) Effect of G418 on cell viability. NRK cells were exposed to the indicated concentrations of G418 for 48 hrs. The cell viability was evaluated by CCK-8 assay. Data are expressed as percentage of living cells against the untreated control (mean ± SD, n = 4). *P < 0.05 versus untreated control. (C) Activation of caspase-3 by G418. NRK cells were exposed to 600 μg/ml G418 for 48 hrs and subjected to Western blot analysis of caspase-3. The top band represents procaspase-3 (M.W. 35,000) and the bottom band indicates its cleaved, mature form (M.W. 17,000). (D) Effects of G418 on O2•− and ROS production. Cells were loaded with O2•− and ROS detection reagent for 1 hr and stimulated with 900 μg/ml G418 for 24 hrs. After that, they were subjected to fluorescent microscopy (magnification, ×400). (E) Induction of P38 phosphorylation by G418. Cells were incubated with the indicated concentrations of G418 for 12 hrs or 600 μg/ml G418 for the indicated intervals. Cellular lysates were subjected to Western blot analysis for phosphorylated P38. (F) Effect of antioxidants on cell viability. Cells were exposed to the indicated concentrations of G418 for 48 hrs in the presence or absence of 5 mM GSH and 10 mM NAC. The cell viability was evaluated by CCK-8 assay. Data are expressed as percentage of living cells against the untreated control (mean ± SD, n = 4; *P < 0.05).
Figure 2
Figure 2
GJs contributed to aminoglycoside-induced NRK-E52 cell injury. (A and B) Influence of G418 and H2O2 on Cx43 expression and phosphorylation. NRK cells were exposed to the indicated concentrations of G418 for 24 hrs (A) or H2O2 for the indicated time intervals (B). Cellular proteins were subjected to Western blot analysis of Cx43 and loading control β-tubulin. NP and P denote non-phosphorylated and phosphorylated Cx43 respectively. (C and D) Effects of GSH on G418- or H2O2-induced Cx43 expression and phosphorylation. Cells were exposing to 600 μg/ml G418 or 50 μM H2O2 in the presence or absence of 5 mM GSH for 24 hrs (C) and 30 min. respectively. Cellular lysates were subjected to Western blot analysis for Cx43. (E) Effects of GJ inhibitor on cell morphology. Cells were exposed to 600 μg/ml G418 with or without 7.5 μM α-GA for 48 hrs. Cell morphology was photographed using phase-contrast microscopy (magnification, ×100). (F) Effects of GJ inhibitors on cell viability. NRK-E52 cells were exposed to the indicated concentrations of G418 in the presence or absence of 7.5 μM α-GA or 10 μM CA for 48 hrs. The cell viability was evaluated by CCK-8 assay. Data are expressed as percentage of living cells against the untreated control (mean ± SE, n = 4; *P < 0.05). (G) Effect of Cx43 siRNA on G418-induced cell injury. Cells transfected with Cx43 siRNA or control siRNA were exposed to the indicated concentrations of G418 for 72 hrs. Then the cellular viability was evaluated through CCK-8 assay. Data are expressed as percentage of living cells, compared with the siRNA control (mean ± SD, n = 4; *P < 0.05 versus siRNA control). (H) Effects of antioxidants and GJ inhibitors on G418-induced activation of caspase-3. Cells were pre-treated with 5 mM GSH, 10 mM NAC, 7.5 μM α-GA or 10 μM CA for 1 hr before exposing to 600 μg/ml G418 for an additional 24 hrs. Cellular lysates were subjected to Western blot analysis for caspase-3. The top band represents procaspase-3 (M.W. 35,000) and the bottom band indicates its cleaved, mature form (M.W. 17,000). (I) Effects of G418 on cell viability in foetal fibroblast cells. C43+/+, Cx43+/− and Cx43−/− fibroblasts were incubated with indicated concentrations of G418 for 24 hrs. The cell viability was evaluated by CCK-8 assay. Data are expressed as percentage of living cells against the untreated control (mean ± SD, n = 4; *P < 0.05 versus G418 alone).
Figure 3
Figure 3
Cx43 regulates aminoglycoside-induced activation of P38. (A and B) Effects of antioxidants and GJ inhibitors on G418-induced activation of P38. Cells were incubated with 5 mM GSH, 10 mM NAC, 7.5 μM α-GA and 10 μM CA for 1 hr before exposing to 600 μg/ml G418 for an additional of 24 hrs. Cellular lysates were subjected to Western blot analysis for total P38 and phosphorylated P38. The percentage of phosphorylated P38 in G418-treated cells with or without GJ inhibitors is shown in the lower panel of B. Quantitative measurement of the band density was performed with ImageJ 1.46 software. The phosphorylated levels of P38 were normalized to total p38, and are expressed as percentage of phosphorylation relative to G418-treated control. Note the obviously reduced level of phosphorylated P38 in antioxidant- or GJ inhibitor-treated cells. (C) Induction of P38 and Cx43 by G418 in foetal fibroblast cells. Cx43+/+, Cx43+/− and Cx43−/− foetal fibroblast cells were treated with or without 600 μg/ml G418 for 12 hrs. Then cellular lysates were subjected to Western blot analysis for P38 and Cx43. Note the different abundance of Cx43 and shift of Cx43 to phosphorylated form in Cx43+/+ and Cx43+/− cells.
Figure 4
Figure 4
Inhibition of GJ suppresses TXNIP. (A) Effects of GJ inhibitors on TXNIP. NRK cells were incubated with 7.5 μM α-GA for the indicated time intervals. Cellular lysates were subjected to Western blot analysis for TXNIP and Cx43. (B and C) Effects of structural analogue of α-GA and different GJ inhibitors on TXNIP expression. NRK cells were incubated with 7.5 μM α-GA, 7.5 μM ß-GA, 10 μM CA, 15 μM GZA (B), 50 μM FFA, 100 μM lindane (Lin) and 2 mM heptanol (Hep) (C) for 6 hrs. Cellular lysates were subjected to Western blot analysis for TXNIP. (D and E) Downregulation of Cx43 with siRNA on TXNIP expression. NRK cells were transfected with either Cx43 siRNA or control siRNA for 48 hrs. Cellular lysates were subjected to Western blot analysis for TXNIP and Cx43. Equal loading of protein per lane was verified by probing the blots with an anti-β-tubulin antibody. Results are representatives of 3 separate experiments. Densitometric analyses of TXNIP in D was done by using ImageJ software and are expressed as percentage of the control (mean ± SE, n = 3; *P < 0.05 compared with the siRNA control). (F) Effect of TXNIP siRNA on G418-induced cell injury. NRK cells were transfected with either TXNIP siRNA or control siRNA for 48 hrs. The cellular viability was evaluated through CCK-8 assay. Data are expressed as percentage of living cells, compared with the siRNA control (mean ± SD, n = 4; *P < 0.05 versus siRNA control).
Figure 5
Figure 5
Inhibition of Cx43 and TXNIP activate AKT. (A and B) Effects of GJ inhibitors on Akt phosphorylation and TXNIP. NRK cells were treated with 7.5 μM α-GA or 100 μM lindane for the indicated time intervals. Cellular lysate were subjected to Western blot analysis of phosphorylated Akt, TXNIP and Cx43. (C and D) Downregulation of Cx43 or TXNIP on Akt phosphorylation. NRK cells were transfected with either Cx43 siRNA or TXNIP siRNA for 48 hrs. Cellular lysates were subjected to Western blot analysis for phosphorylated Akt, TXNIP and Cx43. Equal loading of protein per lane was verified by probing the blots with an anti-β-tubulin antibody. Densitometric analyses of phosphorylated Akt were done by using ImageJ software and are expressed as percentage of the control (mean ± SE, n = 3; *P < 0.05 compared with the siRNA control). (E) Effects of Akt inhibitor on cell viability. NRK cells were incubated with the indicated various concentrations of Akt inhibitor Akti1/2 for 60 hrs. The cell viability was evaluated by CCK-8 assay. Data are expressed as percentage of living cells against the untreated control (mean ± SD, n = 4; *P < 0.05 versus untreated control). (F) Effects of Akt inhibitor on G418-induced cell injury. NRKs were exposed to the indicated concentrations of G418 for 18 hrs in the presence or absence of Akt inhibitor, 10 μM Akti1/2. The cell viability was evaluated by CCK-8 assay. Data are expressed as percentage of living cells against the untreated control (mean ± SD, n = 4; *P < 0.05 versus G418 alone).
Figure 6
Figure 6
Cx43/TXNIP/Akt signalling cascade regulates cell response to puromycin and adriamycin. (A) Induction of NRK-E52 cell shape change by adriamycin. NRK-E52 cells were exposed to adriamycin (1 μg/ml) for 24 hrs. Cell morphology was photographed using phase-contrast microscopy (magnification, ×100). (B) Effect of GJ inhibitor on adriamycin-induced loss of cell viability. NRK cells were exposed to the indicated concentrations of adriamycin in the presence or absence of 7.5 μM α-GA for 20 hrs. The cell viability was evaluated by CCK-8 assay. Data are expressed as percentage of living cells against the untreated control (mean ± SD, n = 4). *P < 0.05 versus adriamycin alone. (C) Effects of TXNIP siRNA on adriamycin-induced cell injury. NRK-E52 cells were transfected with either TXNIP siRNA or control siRNA for 24 hrs. The transfected cells were incubated with the indicated concentrations of adriamycin for 30 hrs. The cellular viability was evaluated through CCK-8 assay. Data are expressed as percentage of living cells, compared with the siRNA control (mean ± SD, n = 4; *P < 0.05 versus siRNA control). (D) Effects of TXNIP siRNA on puromycin-induced cell injury. Cells were transfected with either TXNIP siRNA or control siRNA for 24 hrs. The transfected cells were incubated with indicated various concentrations of puromycin for 30 hrs. The cellular viability was evaluated through CCK-8 assay. Data are expressed as percentage of living cells, compared with the siRNA control (mean ± SE, n = 4; *P < 0.05 versus siRNA control). (E) Effects of GJ inhibitors on Akt phosphorylation and TXNIP in podocytes. Podocytes were treated with 7.5 μM α-GA or 50 μM FFA for the indicated time intervals. Cellular lysate were subjected to Western blot analysis of phosphorylated Akt and TXNIP. Equal loading of protein per lane was verified by reprobing the blots with an anti-β-tubulin antibody.

Similar articles

Cited by

References

    1. Saez JC, Berthoud VM, Branes MC, et al. Plasma membrane channels formed by connexins: their regulation and functions. Physiol Rev. 2003;83:1359–400. - PubMed
    1. Yao J, Oite T, Kitamura M. Gap junctional intercellular communication in the juxtaglomerular apparatus. Am J Physiol Renal Physiol. 2009;296:F939–46. - PubMed
    1. Nielsen MS, Axelsen LN, Sorgen PL, et al. Gap junctions. Compr Physiol. 2012;2:1981–2035. - PMC - PubMed
    1. Loewenstein WR, Kanno Y. Intercellular communication and the control of tissue growth: lack of communication between cancer cells. Nature. 1966;209:1248–9. - PubMed
    1. Yotti LP, Chang CC, Trosko JE. Elimination of metabolic cooperation in Chinese hamster cells by a tumor promoter. Science. 1979;206:1089–91. - PubMed

Publication types

MeSH terms