

Metabolomics Approach Reveals Integrated Metabolic Network Associated with Serotonin Deficiency
- PMID: 26154191
- PMCID: PMC4495385
- DOI: 10.1038/srep11864
Metabolomics Approach Reveals Integrated Metabolic Network Associated with Serotonin Deficiency
Abstract
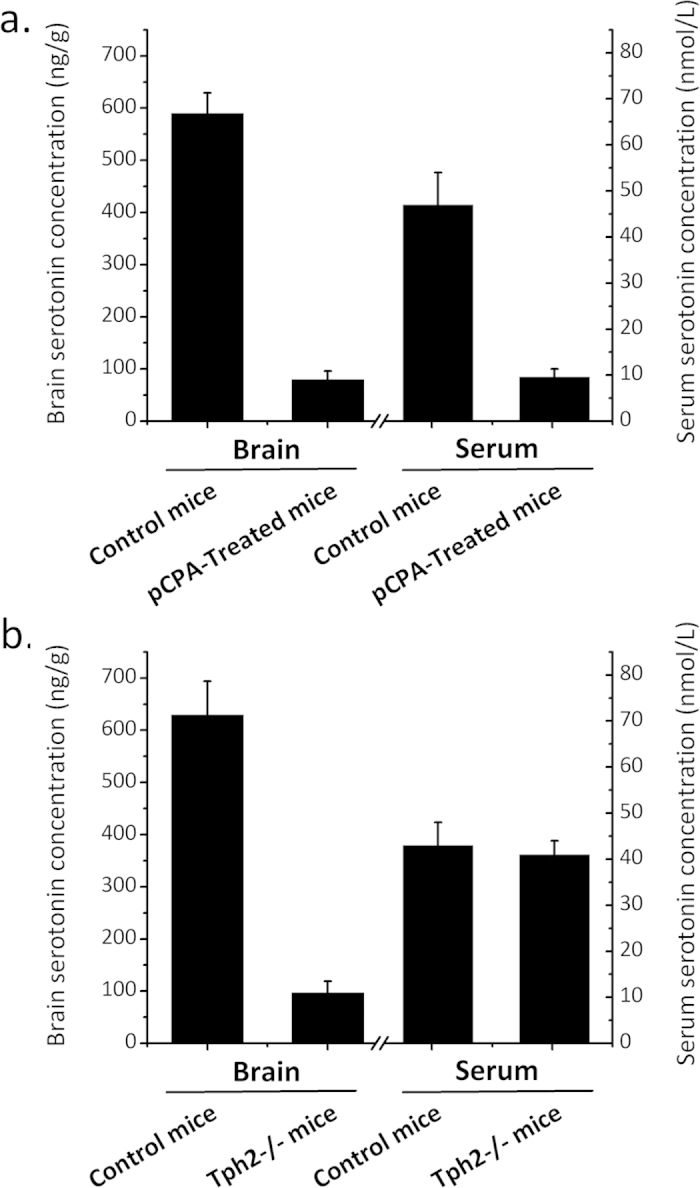
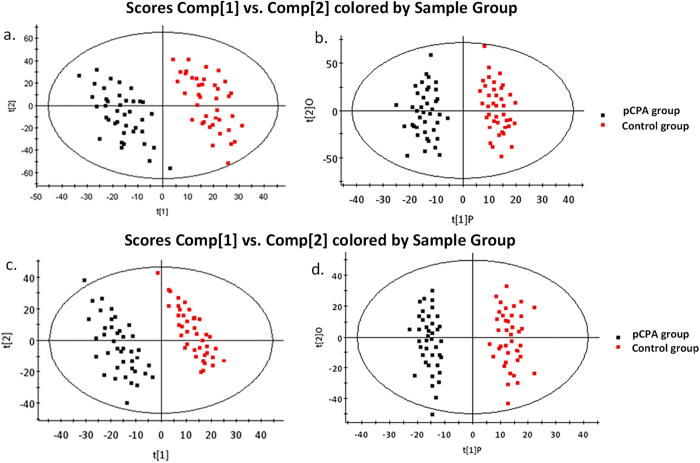
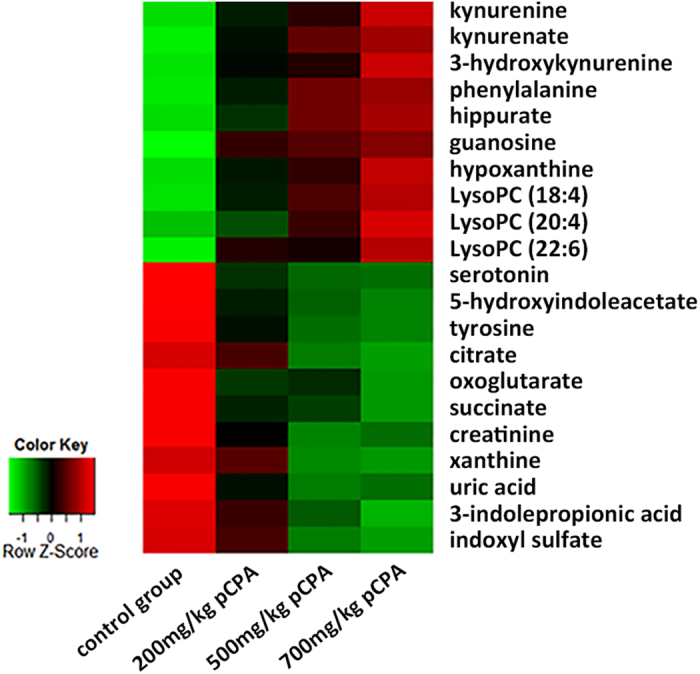
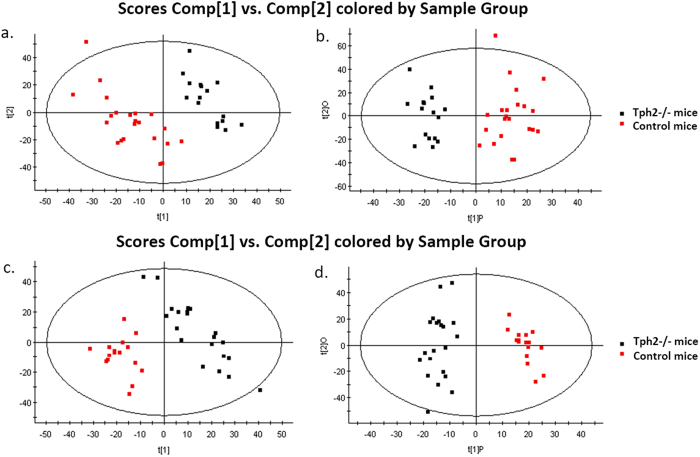
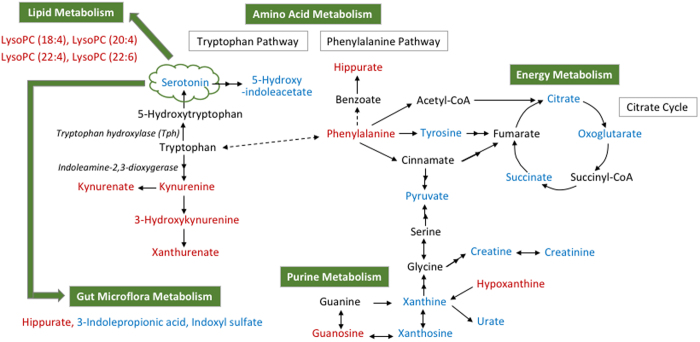
Serotonin is an important neurotransmitter that broadly participates in various biological processes. While serotonin deficiency has been associated with multiple pathological conditions such as depression, schizophrenia, Alzheimer's disease and Parkinson's disease, the serotonin-dependent mechanisms remain poorly understood. This study therefore aimed to identify novel biomarkers and metabolic pathways perturbed by serotonin deficiency using metabolomics approach in order to gain new metabolic insights into the serotonin deficiency-related molecular mechanisms. Serotonin deficiency was achieved through pharmacological inhibition of tryptophan hydroxylase (Tph) using p-chlorophenylalanine (pCPA) or genetic knockout of the neuronal specific Tph2 isoform. This dual approach improved specificity for the serotonin deficiency-associated biomarkers while minimizing nonspecific effects of pCPA treatment or Tph2 knockout (Tph2-/-). Non-targeted metabolic profiling and a targeted pCPA dose-response study identified 21 biomarkers in the pCPA-treated mice while 17 metabolites in the Tph2-/- mice were found to be significantly altered compared with the control mice. These newly identified biomarkers were associated with amino acid, energy, purine, lipid and gut microflora metabolisms. Oxidative stress was also found to be significantly increased in the serotonin deficient mice. These new biomarkers and the overall metabolic pathways may provide new understanding for the serotonin deficiency-associated mechanisms under multiple pathological states.
Figures
References
-
- Kriegebaum C., Gutknecht L., Schmitt A., Lesch K. P. & Reif A. Serotonin now: Part 1. Neurobiology and developmental genetics. Fortschr. Neurol. Psychiatr. 78, 319–331 (2010). - PubMed
-
- Kiser D., SteemerS B., Branchi I. & Homberg J. R. The reciprocal interaction between serotonin and social behaviour. Neurosci. Biobehav. Rev. 36, 786–798 (2012). - PubMed
-
- Nichols D. E. & Nichols C. D. Serotonin receptors. Chem. Rev. 108, 1614–1641 (2008). - PubMed
-
- Gershon M. D. & Tack J. The serotonin signaling system: From basic understanding to drug development-for functional GI disorders. Gastroenterology 132, 397–414 (2007). - PubMed
Publication types
MeSH terms
Substances
LinkOut - more resources
Full Text Sources
Other Literature Sources
