. 2015 Jul 8;10(7):e0131946.
doi: 10.1371/journal.pone.0131946. eCollection 2015.

Geraniol Suppresses Angiogenesis by Downregulating Vascular Endothelial Growth Factor (VEGF)/VEGFR-2 Signaling

Affiliations

Geraniol Suppresses Angiogenesis by Downregulating Vascular Endothelial Growth Factor (VEGF)/VEGFR-2 Signaling

Christine Wittig et al. PLoS One. .

Abstract

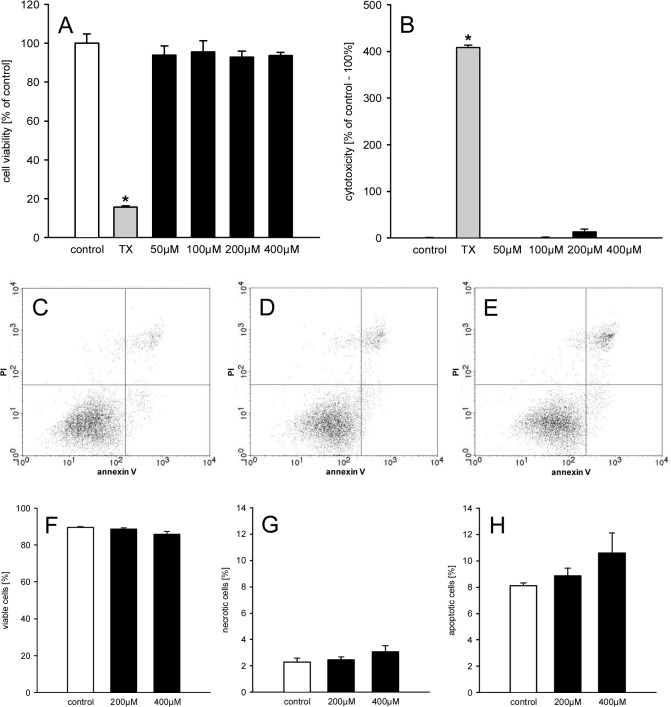
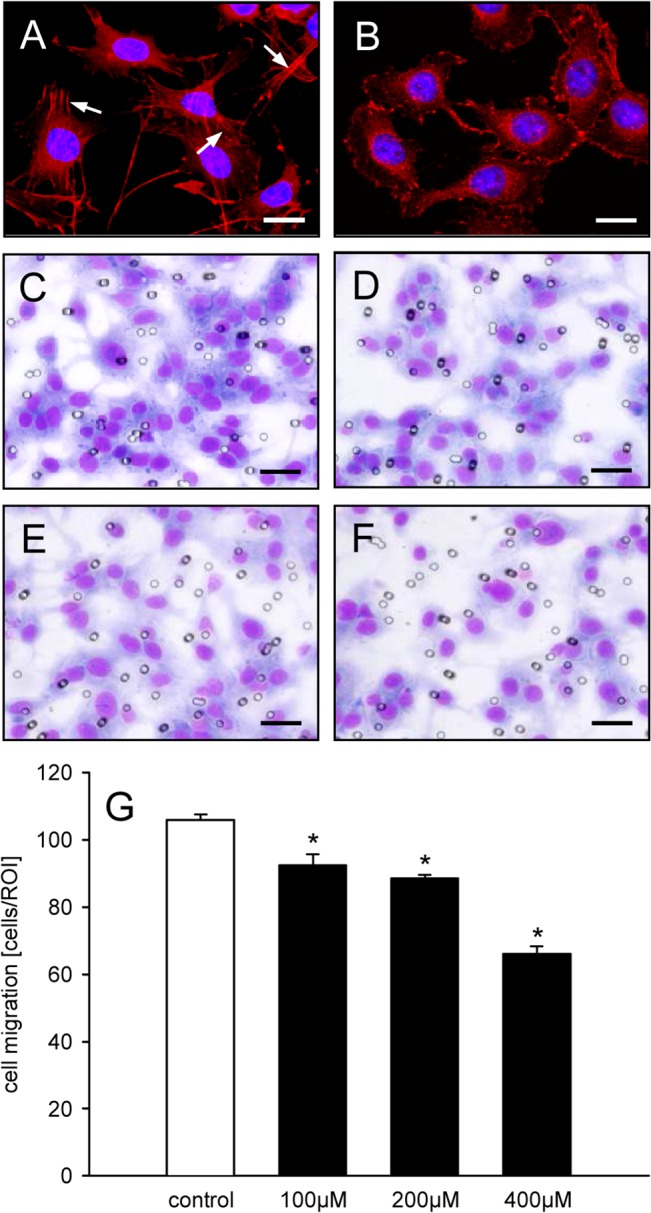
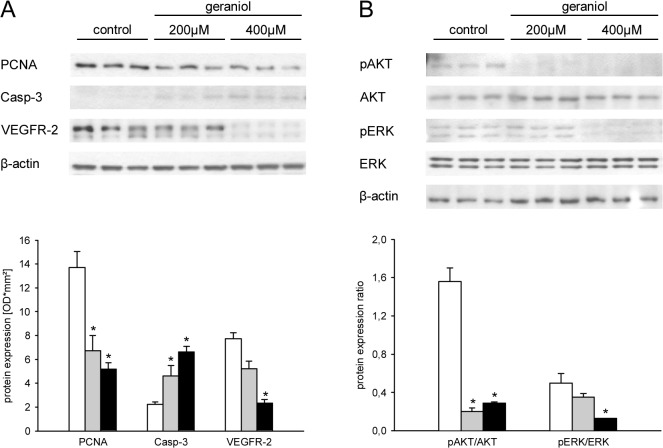
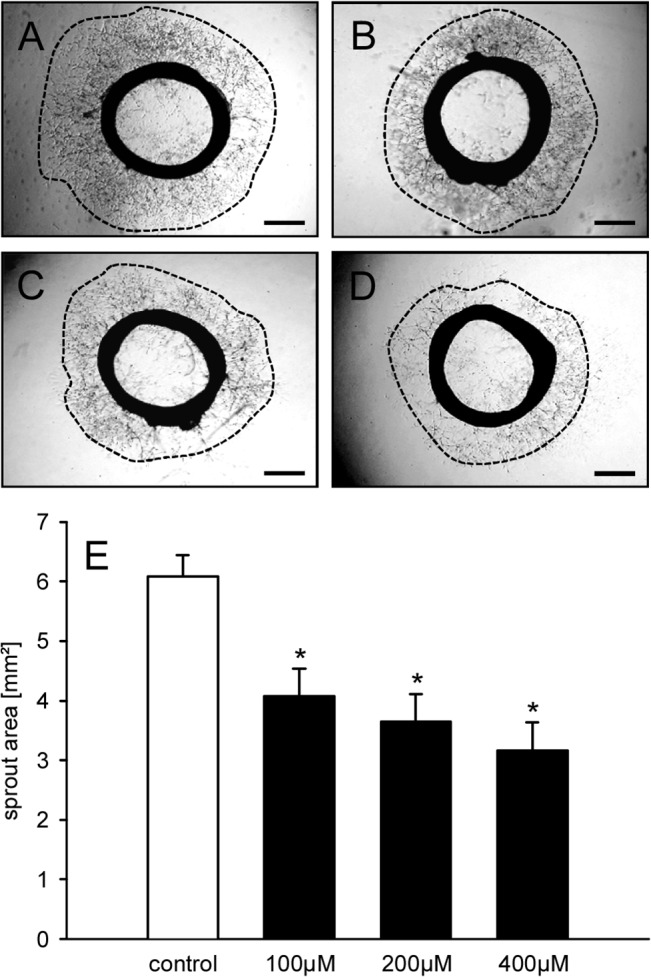
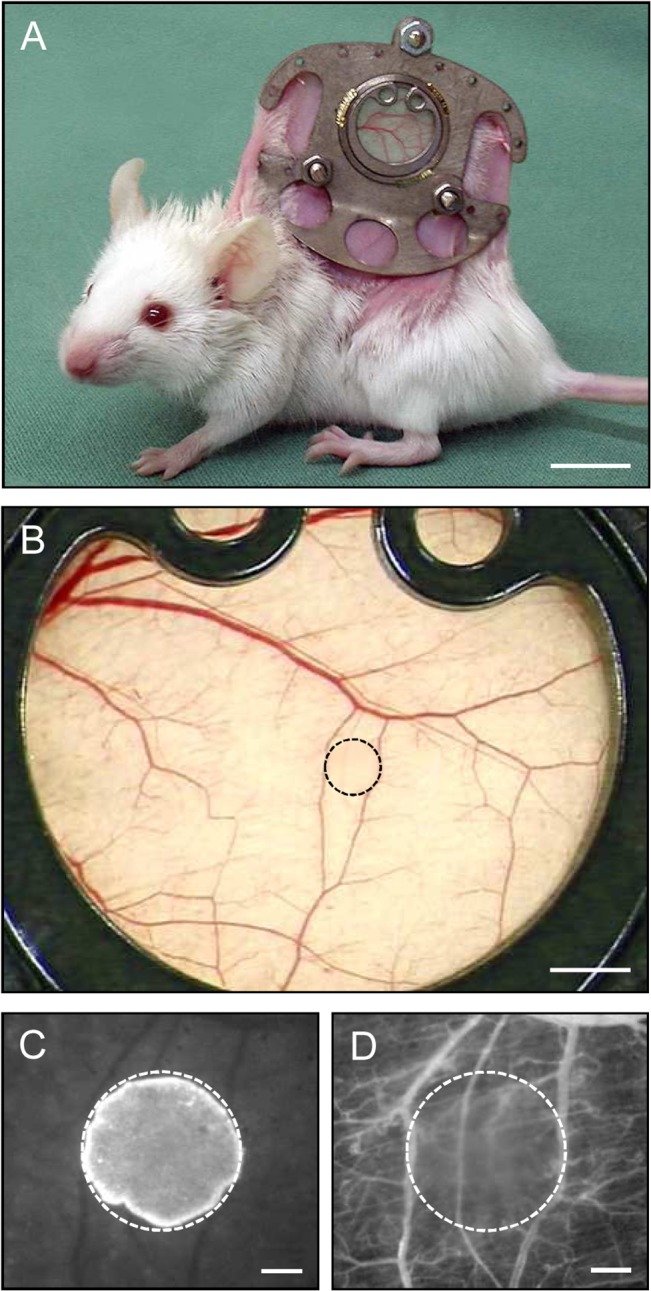
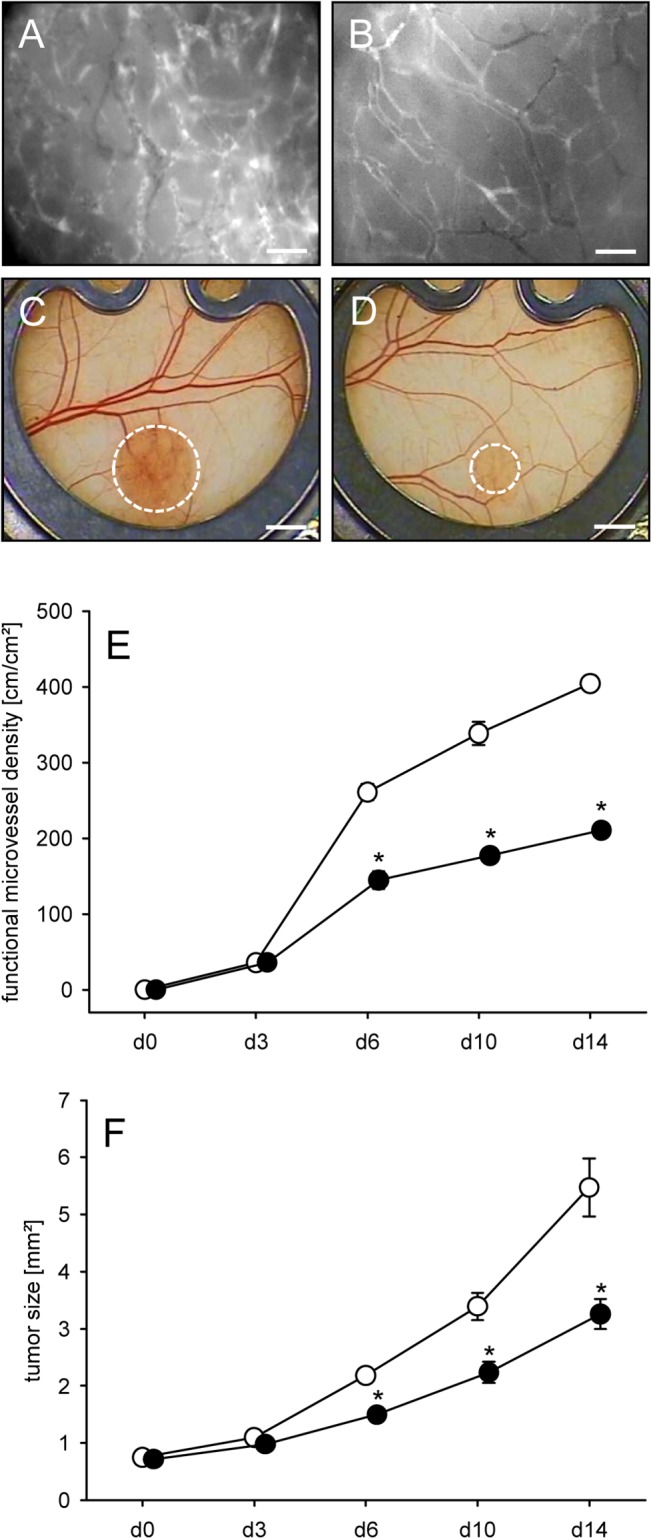
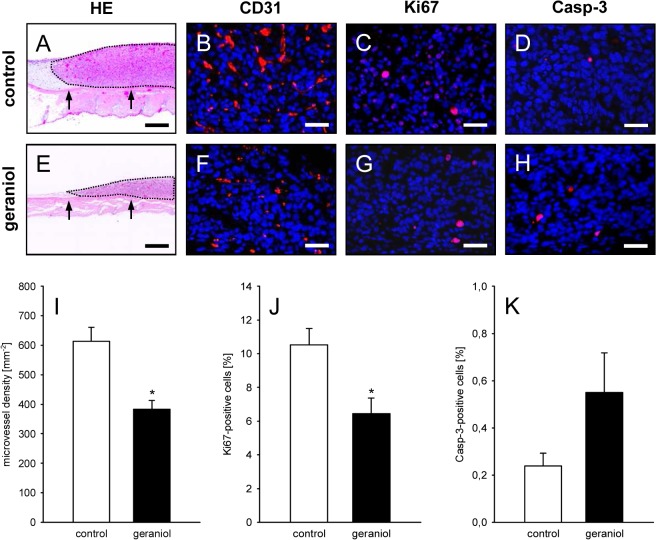
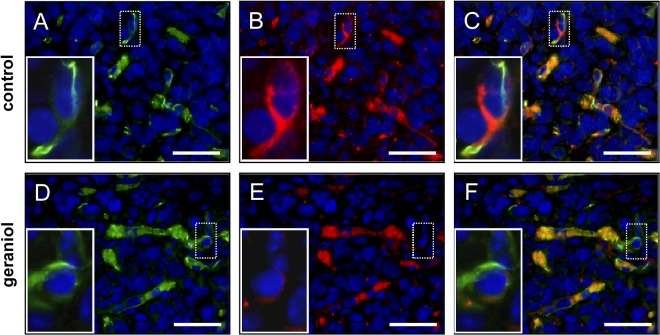
Geraniol exerts several direct pharmacological effects on tumor cells and, thus, has been suggested as a promising anti-cancer compound. Because vascularization is a major precondition for tumor growth, we analyzed in this study the anti-angiogenic action of geraniol. In vitro, geraniol reduced the migratory activity of endothelial-like eEND2 cells. Western blot analyses further revealed that geraniol downregulates proliferating cell nuclear antigen (PCNA) and upregulates cleaved caspase-3 (Casp-3) expression in eEND2 cells. Moreover, geraniol blocked vascular endothelial growth factor (VEGF)/VEGFR-2 signal transduction, resulting in a suppression of downstream AKT and ERK signaling pathways. In addition, geraniol significantly reduced vascular sprout formation in a rat aortic ring assay. In vivo, geraniol inhibited the vascularization of CT26 tumors in dorsal skinfold chambers of BALB/c mice, which was associated with a smaller tumor size when compared to vehicle-treated controls. Immunohistochemical analyses confirmed a decreased number of Ki67-positive cells and CD31-positive microvessels with reduced VEGFR-2 expression within geraniol-treated tumors. Taken together, these findings indicate that geraniol targets multiple angiogenic mechanisms and, therefore, is an attractive candidate for the anti-angiogenic treatment of tumors.


Conflict of interest statement

Competing Interests: The authors have declared that no competing interests exist.

Figures

Fig 1
Fig 1. Geraniol action on viability of eEND2 cells.
A, B: Cell viability (% of control) (A) and cytotoxicity (% of control– 100%) (B) of eEND2 cells, which were exposed for 24h to different doses (50–400μM; n = 4) of geraniol, Triton X-100 as cytotoxic control (TX) or vehicle (control; n = 4), as assessed by WST-1 assay (A) and LDH release assay (B). Means ± SEM. *P<0.05 vs. control. C-E: Representative graphs from flow cytometry analyses of PI- and annexin V-stained eEND2 cells, which were exposed for 24h to 200μM (D; n = 4) and 400μM (E; n = 4) geraniol or vehicle (control; C; n = 4). F-H: Viable cells (= PI-negative/annexin V-negative; %) (F), necrotic cells (= PI-positive/annexin V-negative; %) and apoptotic cells (PI-negative/annexin V-positive and PI-positive/annexin V-positive; %), as assessed by flow cytometry. Means ± SEM. *P<0.05 vs. control.
Fig 2
Fig 2. Geraniol action on viability of HDMEC.
A, B: Cell viability (% of control) (A) and cytotoxicity (% of control– 100%) (B) of HDMEC, which were exposed for 24h to different doses (50–400μM; n = 4) of geraniol, Triton X-100 as cytotoxic control (TX) or vehicle (control; n = 4), as assessed by WST-1 assay (A) and LDH release assay (B). Means ± SEM. *P<0.05 vs. control. C-E: Representative graphs from flow cytometry analyses of PI- and annexin V-stained HDMEC, which were exposed for 24h to 200μM (D; n = 4) and 400μM (E; n = 4) geraniol or vehicle (control; C; n = 4). F-H: Viable cells (= PI-negative/annexin V-negative; %) (F), necrotic cells (= PI-positive/annexin V-negative; %) and apoptotic cells (PI-negative/annexin V-positive and PI-positive/annexin V-positive; %), as assessed by flow cytometry. Means ± SEM.
Fig 3
Fig 3. Geraniol action on stress fiber formation and cell migration.
A, B: Fluorescence microscopic images of eEND2 cells, which were exposed for 24h to vehicle (A) or 400μM geraniol (B). The cells were stained with Alexa Fluor 568-conjugated phalloidin (red) for the detection of the cytoskeleton. The cell nuclei were stained with Hoechst 33342 (blue). Note that in contrast to the geraniol-treated cells (B) many of the vehicle-treated cells exhibit typical actin stress fibers (A, arrows). Scale bars: 30μm. C-F: Light microscopic images of eEND2 cells, which have migrated through the 8μm pores of the PET filters of the transwell migration assay to the lower membrane surface. The cells were exposed for 24h to vehicle (C), 100μM (D), 200μM (E) or 400μM geraniol (F) and visualized by Diff-Quick staining. Scale bars: 70μm. G: Cell migration (cells/ROI) of eEND2 cells, which were exposed for 24h to different doses (100–400μM; n = 4) of geraniol or vehicle (control; n = 4), as assessed by the transwell migration assay. Means ± SEM. *P<0.05 vs. control.
Fig 4
Fig 4. Geraniol action on protein expression.
A: Western blot analysis of PCNA, Casp-3 and VEGFR-2 protein expression (optical density (OD)*mm²) of eEND2 cells, which were exposed for 24h to vehicle (white bars; n = 3) or 200μM (grey bars; n = 3) and 400μM geraniol (black bars; n = 3). B: Western blot analysis of pAKT/AKT and pERK/ERK protein expression ratio of eEND2 cells, which were exposed for 24h to vehicle (white bars; n = 3) or 200μM (grey bars; n = 3) and 400μM geraniol (black bars; n = 3). Means ± SEM. *P<0.05 vs. control.
Fig 5
Fig 5. Geraniol action on vascular sprouting.
A-D: Phase-contrast microscopic images of rat aortic rings with vascular sprouting (borders marked by broken line) upon 6 days of treatment with vehicle (A), 100μM (B), 200μM (C) or 400μM geraniol (D). Scale bars: 700μm. E: Sprout area (mm2) of the outer aortic sprouting, as assessed by phase-contrast microscopy and computer-assisted image analysis. The aortic rings were exposed to vehicle (control; n = 8) or increasing concentrations of geraniol (100–400μM; n = 8) for 6 days. Means ± SEM. *P<0.05 vs. control.
Fig 6
Fig 6. Dorsal skinfold chamber model for the in vivo analysis of tumor angiogenesis.
A: BALB/c mouse with a dorsal skinfold chamber (weight: ~2g). B: Observation window of a dorsal skinfold chamber directly after transplantation of a CT26 tumor cell spheroid (border marked by broken line). C, D: Intravital fluorescence microscopy of the tumor cell spheroid (border marked by broken line) in B. Because the cell nuclei of the spheroid were stained with the fluorescent dye Hoechst 33342 before transplantation, the implant can easily be differentiated from the non-stained surrounding host tissue of the chamber using ultraviolet light epi-illumination (C). Blue light epi-illumination of the identical region of interest as in C with contrast enhancement by intravascular staining of plasma with 5% FITC-labeled dextran 150,000 i.v. allows the visualization of the microvasculature surrounding the spheroid (D). Scale bars: A = 10mm; B = 1.4mm; C, D = 250μm.
Fig 7
Fig 7. Geraniol action on tumor vascularization and growth.
A, B: Intravital fluorescence microscopic images of the newly developed microvascular network within CT26 tumors at day 14 after implantation into the dorsal skinfold chamber of a vehicle-treated control mouse (A) and a geraniol-treated animal (B). Blue light epi-illumination with contrast enhancement by 5% FITC-labeled dextran 150,000 i.v.. Scale bars: 50μm. C, D: Stereo microscopic images of CT26 tumors (borders marked by broken line) at day 14 after transplantation of spheroids into the dorsal skinfold chamber of a vehicle-treated (C) and a geraniol-treated animal (D). Scale bars: 1.4mm. E, F: Functional microvessel density (cm/cm2) (E) and size (mm2) (F) of CT26 tumors in dorsal skinfold chambers of vehicle-treated (white circles; n = 8) and geraniol-treated BALB/c mice (black circles; n = 8), as assessed by intravital fluorescence microscopy and computer-assisted off-line analysis. Means ± SEM. *P<0.05 vs. control.
Fig 8
Fig 8. Histological and immunohistochemical analysis of tumors.
A, E: HE-stained cross sections of CT26 tumors (borders marked by dotted line) at day 14 after transplantation of tumor spheroids onto the striated muscle tissue (arrows) within the dorsal skinfold chamber of a vehicle-treated control mouse (A) and a geraniol-treated animal (E). Scale bars: 300μm. B, C, D, F, G, H: Immunohistochemical detection of CD31 (B, F, red), Ki67 (C, G, red) and Casp-3 (D, H, red) in CT26 tumors at day 14 after transplantation of tumor spheroids into the dorsal skinfold chamber of a vehicle-treated control mouse (B, C, D) and a geraniol-treated animal (F, G, H). Sections were stained with Hoechst 33342 to identify cell nuclei (blue). Scale bars: 40μm. I-K: Microvessel density (mm-2) (I), Ki67-positive cells (%) (J) and Casp-3-positive cells (%) (K) in CT26 tumors in dorsal skinfold chambers of vehicle-treated (white bars; n = 8) and geraniol-treated BALB/c mice (black bars; n = 8), as assessed by quantitative immunohistochemical analysis. Means ± SEM. *P<0.05 vs. control.
Fig 9
Fig 9. Immunohistochemical analysis of tumor microvessels.
Immunohistochemical detection of endothelial CD31 (A, D, green) and VEGFR-2 (B, E, red) of microvessels within CT26 tumors at day 14 after transplantation of tumor spheroids into the dorsal skinfold chamber of a vehicle-treated control mouse (A-C) and a geraniol-treated animal (D-F). Sections were stained with Hoechst 33342 to identify cell nuclei (blue). C and F are merges of A, B and D, E. Erythrocytes in the vessel lumina are unspecifically stained (C, F, orange color). Note that the endothelium of microvessels within the geraniol-treated tumor exhibits a markedly reduced expression of VEGFR-2 (E, insert = higher magnification of dotted ROI) when compared to those within the vehicle-treated control tumor (B, insert = higher magnification of dotted ROI). Scale bars: 35μm.

Similar articles

Cited by

References

    1. Folkman J. Role of angiogenesis in tumor growth and metastasis. Semin Oncol. 2002;29: 15–18. - PubMed
    1. Rak JW, St Croix BD, Kerbel RS. Consequences of angiogenesis for tumor progression, metastasis and cancer therapy. Anticancer Drugs 1995;6: 3–18. - PubMed
    1. Marques I, Araújo A, de Mello RA. Anti-angiogenic therapies for metastatic colorectal cancer: current and future perspectives. World J Gastroenterol. 2013;19: 7955–7971. 10.3748/wjg.v19.i44.7955 - DOI - PMC - PubMed
    1. Lauro S, Onesti CE, Righini R, Marchetti P. The use of bevacizumab in non-small cell lung cancer: an update. Anticancer Res. 2014;34: 1537–1545. - PubMed
    1. Khan AQ, Khan R, Qamar W, Lateef A, Rehman MU, Tahir M, et al. Geraniol attenuates 12-O-tetradecanoylphorbol-13-acetate (TPA)-induced oxidative stress and inflammation in mouse skin: possible role of p38 MAP Kinase and NF-κB. Exp Mol Pathol. 2013;94: 419–429. 10.1016/j.yexmp.2013.01.006 - DOI - PubMed

MeSH terms