

Evidence of Experimental Bias in the Life Sciences: Why We Need Blind Data Recording
- PMID: 26154287
- PMCID: PMC4496034
- DOI: 10.1371/journal.pbio.1002190
Evidence of Experimental Bias in the Life Sciences: Why We Need Blind Data Recording
Abstract
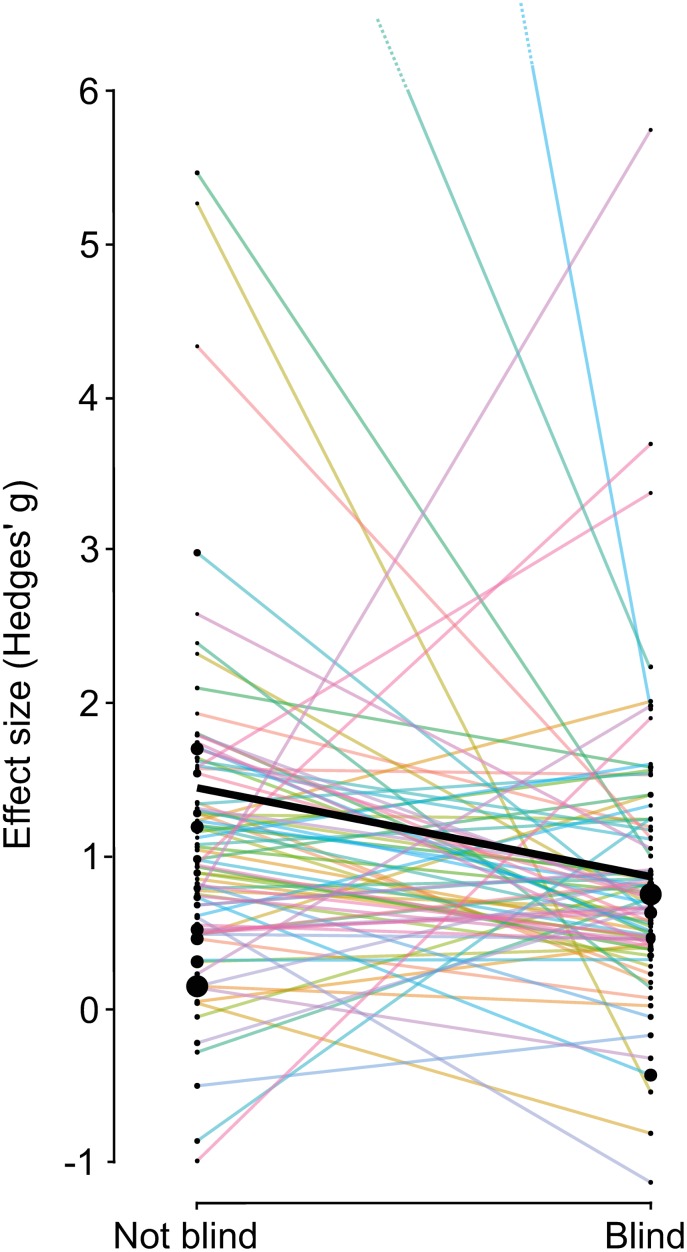
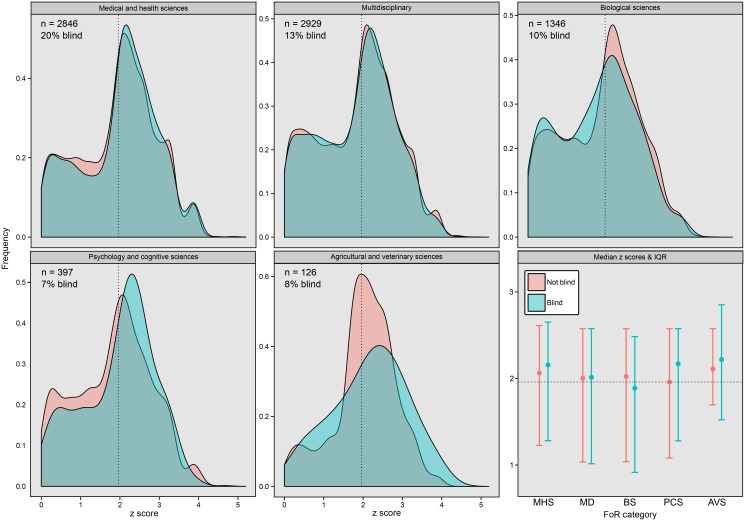
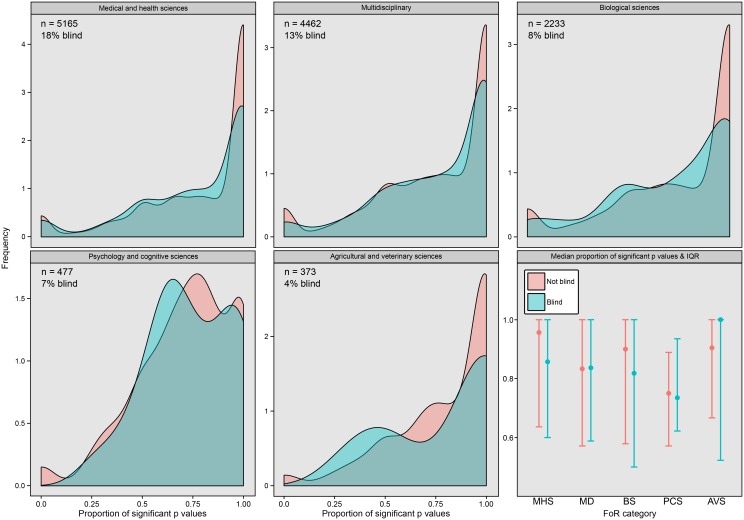
Observer bias and other "experimenter effects" occur when researchers' expectations influence study outcome. These biases are strongest when researchers expect a particular result, are measuring subjective variables, and have an incentive to produce data that confirm predictions. To minimize bias, it is good practice to work "blind," meaning that experimenters are unaware of the identity or treatment group of their subjects while conducting research. Here, using text mining and a literature review, we find evidence that blind protocols are uncommon in the life sciences and that nonblind studies tend to report higher effect sizes and more significant p-values. We discuss methods to minimize bias and urge researchers, editors, and peer reviewers to keep blind protocols in mind.
Conflict of interest statement
The authors have declared that no competing interests exist.
Figures
References
-
- Nickerson RS (1998) Confirmation bias: A ubiquitous phenomenon in many guises. Review of General Psychology 2: 175–220.
-
- Rosenthal R (1966) Experimenter Effects in Behavioral Research. East Norwalk, CT: Appleton-Century-Crofts.
-
- Rosenthal R (2009) Artifacts in Behavioral Research. Oxford: Oxford University Press.
-
- Rosenthal R (1994) Interpersonal expectancy effects: A 30-year perspective. Current Directions in Psychological Science 3: 176–179.
-
- Schulz KF, Grimes DA (2002) Blinding in randomised trials: hiding who got what. Lancet 359: 696–700. - PubMed
Publication types
MeSH terms
LinkOut - more resources
Full Text Sources
Other Literature Sources
