. 2015 Jul 8;10(7):e0131588.
doi: 10.1371/journal.pone.0131588. eCollection 2015.

The Role of α-CTD in the Genome-Wide Transcriptional Regulation of the Bacillus subtilis Cells

Affiliations

The Role of α-CTD in the Genome-Wide Transcriptional Regulation of the Bacillus subtilis Cells

Satohiko Murayama et al. PLoS One. .

Abstract

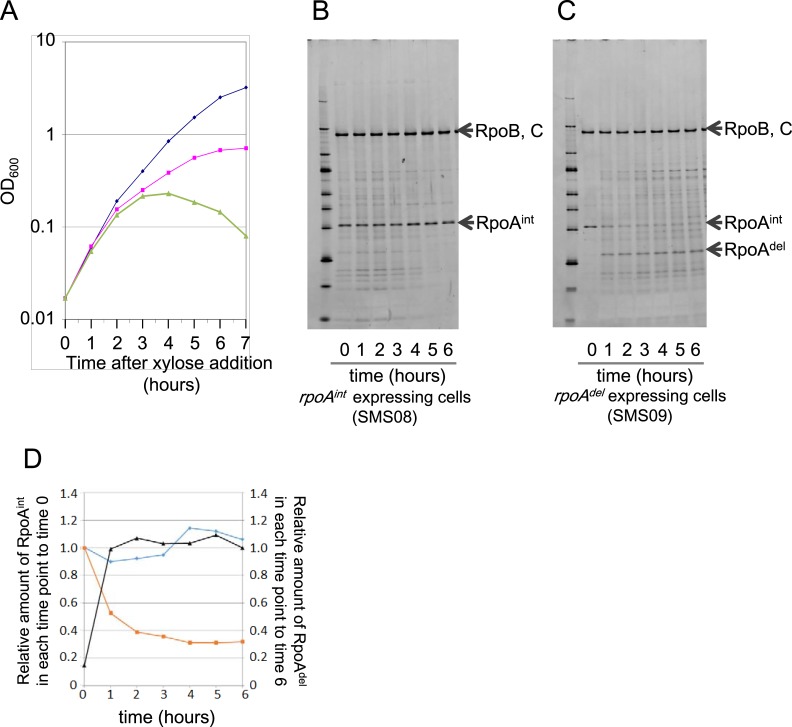
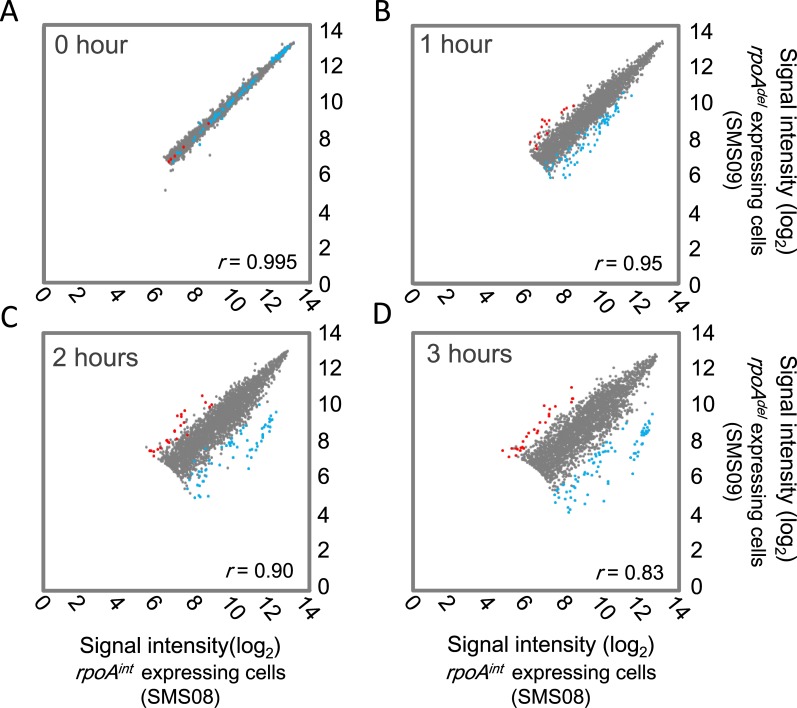
The amino acid sequence of the RNA polymerase (RNAP) α-subunit is well conserved throughout the Eubacteria. Its C-terminal domain (α-CTD) is important for the transcriptional regulation of specific promoters in both Escherichia coli and Bacillus subtilis, through interactions with transcription factors and/or a DNA element called the "UP element". However, there is only limited information regarding the α-CTD regulated genes in B. subtilis and the importance of this subunit in the transcriptional regulation of B. subtilis. Here, we established strains and the growth conditions in which the α-subunit of RNAP was replaced with a C-terminally truncated version. Transcriptomic and ChAP-chip analyses revealed that α-CTD deficiency reduced the transcription and RNAP binding of genes related to the utilization of secondary carbon sources, transition state responses, and ribosome synthesis. In E. coli, it is known that α-CTD also contributes to the expression of genes related to the utilization of secondary carbon sources and ribosome synthesis. Our results suggest that the biological importance of α-CTD is conserved in B. subtilis and E. coli, but that its specific roles have diversified between these two bacteria.


Conflict of interest statement

Competing Interests: The authors have declared that no competing interests exist.

Figures

Fig 1
Fig 1. Schematic representation of the loci used to switch rpoA expression from IPTG-to xylose-inducible.
Open thick arrows represent genes, while thick gray arrows represent genes whose expression levels were induced by IPTG or xylose via the Pspac and Pxyl promoters, respectively. The dashed line (with arrowhead) represents the region in which transcription was initiated from the original promoter of the operon; this region includes rpoA and rplQ, which are expected to be located upstream of infA [31]. Gray solid lines represent the transcribed regions of the new transcriptional units (Pspac-rpoA int -rplQ, Pxyl-rpoA int -rplQ, Pxyl-rpoA del -rplQ or Pxyl-rplQ) regulated by the Pspac and Pxyl promoters. Native rpoA locus (A) and amyE locus (B) are shown.
Fig 2
Fig 2. The effects of replacing RpoAint with RpoAdel in the RNAP complexes of rpoA del-expressing cells.
(A) Growth curves of strains that expressed RpoAint (SMS05, blue line), RpoAdel (SMS06, pink line) and RplQ without RpoA (SMS07, green line), upon xylose induction. (B and C) Pull-down assays of RpoA assembled in RNAP complexes. RNAP complexes were purified using His-tagged RpoC as bait, separated by SDS-PAGE and detected by fluorescent staining with Flamingo dye (Bio-Rad), which is characterized by a high sensitivity and a low background, allowing accurate quantification [32]. The band positions corresponding to RpoB and C, RpoAint and RpoAdel in the SDS-PAGE gel are indicated by arrows (right). The duration of cultivation in LBxyl is shown at the bottom of each panel. (D) Time course of alteration in the relative amounts of RpoAint and RpoAdel in the RNAP complexes of rpoA int- and rpoA del-expressing cells grown in LBxyl. The blue line indicates the relative ratio (see below) of the amount of RpoAint in the RNAP complexes of rpoA int-expressing cells at each time point. For normalization, the amount of RpoAint was divided by that of RpoB, C in each lane as follows: normalized signal intensity of RpoA = [signal intensity of the RpoA band] / [signal intensity of the RpoB, C band]. The amount of RpoAint at each time point was then divided by the amount of RpoAint at time 0 as follows: relative ratio (RpoAint (X hour)) = [normalized signal intensity of RpoAint (X hour)] / [normalized signal intensity of RpoAint (0 hour)]. The orange line represents the relative ratios of RpoAint in the RNAP complexes of rpoA del-expressing cells at each time point, calculated as described above. The black line shows the relative ratios of the amount of RpoAdel in the RNAP complexes of rpoA del-expressing cells at each time point against to the amount of RpoAdel at 6 hours after the beginning of the RpoAdel induction. Here, the relative ratio was calculated as: relative ratio (RpoAdel (X hour)) = [normalized signal intensity of RpoAdel (X hour)] / [normalized signal intensity of RpoAdel (6 hour)]. Each relative ratio was calculated using the average values obtained from triplicate experiments.
Fig 3
Fig 3. Transcriptome analysis of rpoA int-expressing cells (SMS08) and rpoA del-expressing cells (SMS09).
A scatter plot (log2 scale) of the transcriptional signal intensity (averaged from duplicate experiments) of each gene in rpoA del-expressing cells (vertical axis) versus rpoA int-expressing cells (horizontal axis) at 0 hour (A) and at 1 hour (B), 2 hours (C) and 3 hours (D) after the beginning of the RpoAdel induction. The correlation coefficients between the transcriptomes of rpoA int and rpoA del-expressing cells are indicated as (r) in each panel. The average signal intensities from two independent experiments are plotted. For each gene plotted, the sum of the signal intensities for all experiments performed at the same time point (two experiments each for rpoA int- and rpoA del-expressing cells) was > 400; this avoided the inclusion of minimally expressed genes in our analysis. We analyzed a total of 2755 (0 hour), 2855 (1 hour), 2921 (2 hour) and 2956 (3 hour) genes. The genes found to be down-regulated in rpoA del-expressing cells compared to rpoA int-expressing cells at 3 hours after the beginning of the RpoAdel induction are shown as blue dots, and the up-regulated genes are shown by red dots.
Fig 4
Fig 4. Genome-wide map of the genes up- and down-regulated, and highly reduced RNAP binding in rpoA del-expressing cells (at 3 hours).
From the outermost ring, the genes with highly reduced RNAP binding identified by ChAP-chip analysis (dark-blue bars, gene names corresponding to those bars are indicated by dark-blue letters outside of rings), down-regulated genes identified by transcriptome analysis (sky-blue bars, gene names corresponding to those bars are indicated by sky-blue letters outside of rings), CDSs (orange bars, an outer and inner ring indicates clockwise and counterclockwise CDSs, respectively) and up-regulated genes identified by transcriptome analysis (red bars in innermost ring, gene names corresponding to those bars are indicated by red letters) are shown as bars at their corresponding genome coordinates. The pink letters indicate the genes which were identified as the genes both down-regulated and with highly reduced RNAP binding. The GenomeMatcher was used to draw rings [40].
Fig 5
Fig 5. RNAP binding effects following the replacement of RpoAint with RpoAdel in the RNAP complex.
(A) Typical RNAP binding profiles obtained from rpoA int- and rpoA del-expressing cells; rpsU and yqeY are indicated, with the RNAP binding signal of each probe mapped to the corresponding position in the B. subtilis chromosome. The binding intensity (shown by vertical bars) was determined as the relative ratio of the signal intensities obtained for the hybridization of labeled DNA fragments prepared from the affinity purification with RpoC or RpoA (ChAP DNA) versus whole cell extract (control DNA) fractions in each experiment. The RNAP binding intensities determined by affinity purification with RpoC as bait are shown in lanes 1 and 2. The RNAP binding intensities determined by affinity purification with RpoA as bait are shown in lanes 3 and 4. The RNAP binding intensities in the rpoA int-expressing cells are shown in lanes 1 (SMS08) and 3 (SMS18), and those in rpoA del-expressing cells are indicated in lanes 2 (SMS09) and 4 (SMS19). The arrangement of genes in the presented chromosomal region is indicated by thick arrows at the top of the figure. The RNAP binding profiles obtained from one (Exp. 1) of duplicate experiments are shown as representative. (B) Binding to the mtl operon is shown as a typical example of the reduced RNAP binding observed in rpoA del-expressing cells. (C) Binding to the srf operon is shown as an example of the unique RNAP binding profile observed in rpoA del-expressing cells, in which reductions were seen in the protein coding regions but not in the promoter proximal regions.

References

    1. Browning DF, Busby SJ (2004) The regulation of bacterial transcription initiation. Nature Reviews Microbiology 2: 57–65. - PubMed
    1. Moran CP Jr., Lang N, LeGrice SF, Lee G, Stephens M, Sonenshein AL, et al. (1982) Nucleotide sequences that signal the initiation of transcription and translation in Bacillus subtilis . Molecular & General Genetics 186: 339–346. - PubMed
    1. Dombroski AJ, Walter WA, Record MT Jr., Siegele DA, Gross CA (1992) Polypeptides containing highly conserved regions of transcription initiation factor sigma 70 exhibit specificity of binding to promoter DNA. Cell 70: 501–512. - PubMed
    1. Gourse RL, Ross W, Gaal T (2000) UPs and downs in bacterial transcription initiation: the role of the alpha subunit of RNA polymerase in promoter recognition. Molecular Microbiology 37: 687–695. - PubMed
    1. Negishi T, Fujita N, Ishihama A (1995) Structural map of the alpha subunit of Escherichia coli RNA polymerase: structural domains identified by proteolytic cleavage. Journal of Molecular Biology 248: 723–728. - PubMed

Publication types

MeSH terms

LinkOut - more resources