

Review
doi: 10.1021/acs.chemrev.5b00109.
Epub 2015 Jul 8.
Synthetic Nanoparticles for Vaccines and Immunotherapy
Affiliations
- PMID: 26154342
- PMCID: PMC4688911
- DOI: 10.1021/acs.chemrev.5b00109
Item in Clipboard
Review
Synthetic Nanoparticles for Vaccines and Immunotherapy
Chem Rev.
.
No abstract available
Figures

Examples of the impact of vaccination on disease burdens in the United States. (A) Poliomyelitis before and after introduction of the polio vaccines. Reprinted form reference 12. (B) Measles cases before and after introduction of the measles vaccine. Reprinted from Center for Disease Control and Prevention: Vaccines and Immunizations Publications. Parents guide to childhood immunization http://www.cdc.gov/vaccines/pubs/parents-guide/downloads/parents-guide-part3.pdf#page=10 (accessed Feb 1, 2015).
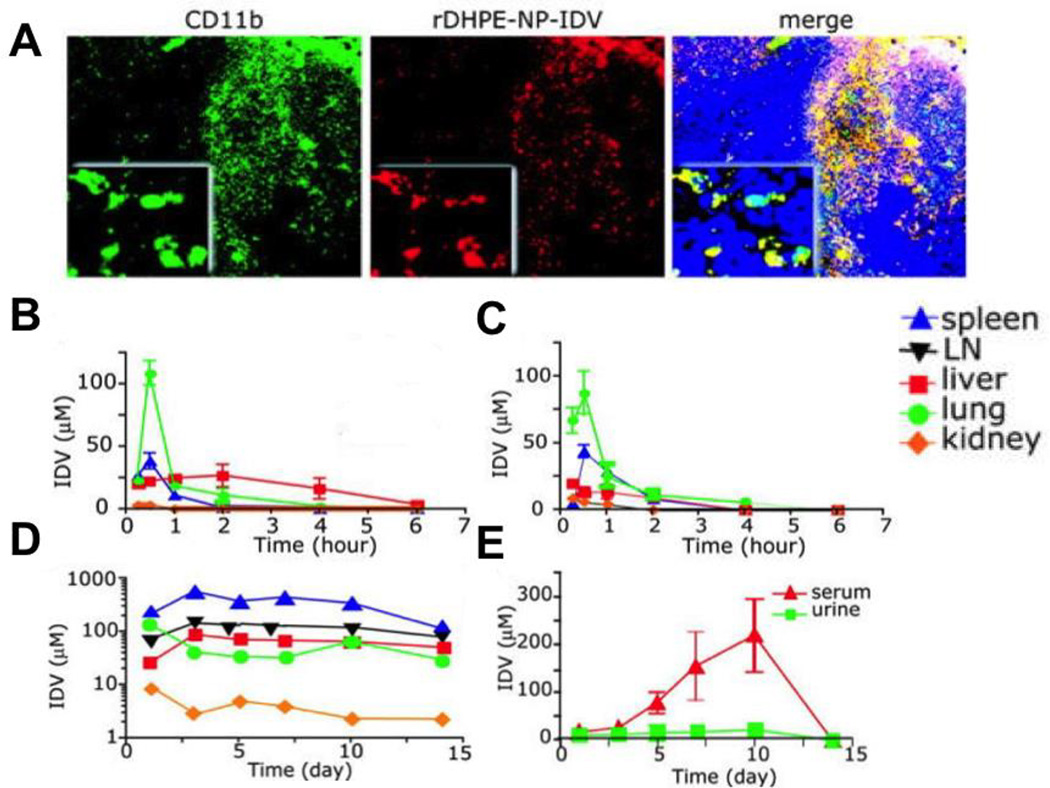
Delivery of idinavir (IDV) nanoparticles loaded into bone marrow derived macrophages (BMDMs) results in increased serum and tissue drug concentrations. (A) Sections of spleen from mice at day 5 after the transfer of rhodamine-labeled idinavir nanoparticle loaded bone marrow derived macrophages (IDV-loaded BMDMs). Sections were stained for CD11b and examined by fluorescence microscopy. Higher magnification inserts demonstrate the co-localization of BMDM-IDVs (Red) with the cytoplasm of CD11b+ cells (Green). BMDMs appear yellow in the merged panel and nuclei are stained in blue. (B–E) IDV distribution in targeted tissues and body fluids was assessed in mice treated with a single dose of (B) IDV free drug solution (C) Cell- free IDV nanoparticles (D–E) BMDM-IDVs. IDV concentrations in mice treated with BMDM-IDVs were increased and prolonged over 14 days. Data represent mean ± SEM for n = 4 mice per group per time point. Magnifications are (originals) × 100 and (insets) × 400. Reprinted with permission from reference 37. Copyright 2006 American Society of Hematology.

siRNA LNP is primarily engulfed in small vesicles by Kuppfer cells within the mononuclear cell pool. Representative images of cell stained with a surface lineage marker (Yellow), DAPI (Blue), and siRNA LNP (Red) are depicted (n = 3 per group). DAPI: 4’,6-diamidno-2phenylindole; DC: Dendritic Cell; IU: Infectious Unit; KC: Kuppfer Cell; LNP: Lipidoid nanoparticle; LSEC: Liver Sinusoidal Endothelial Cell. Reprinted with permission from reference 52. Copyright 2013 American Society of Gene & Cell Therapy.

Mannosylated liposomes are targeted to macrophages in the tumor microenvironement. (A) Schematic diagram of DOTA containing plain liposomes (B) Schematic diagram of DOTA containing mannosylated liposomes (Man-Lipos) (C and D) Strong fluorescence signal associated with PEG liposomes and Man-Lipos is localized to lung tumors. However, compared to Man-lipos, PEG liposomes exhibit a higher background signal and poor tumor contrast. Reprinted with permission from reference 63. Copyright 2012 Elsevier Ltd.

Different nanoparticle based strategies to improve adoptive T-cell transfer (A) Schematic of iron-dextran nanoparticles functionalized with T-cell activating proteins (nano-APCs) stimulating T-cell receptor signaling in the absence or presence of a magnetic field (B) Adoptive transfer of magnet-enhanced nano-APC activated T cells increased survival compared to no magnet and control groups. Mice were censored if dead or tumors were > 150 mm2. (p<0.001 by Mantel Cox log-rank test) Reprinted with permission from reference 74. Copyright 2014 American Chemical Society. (C) Schematic of maleimide-based conjugation to cell surface thiols. MBP-PE: 1,2-dioleoyl-sn-glycero-3-phosphoethanolamine-N-[4– (p-maleimidophenyl)butyamide] (D) Confocal microscopy images of CD8+ effector T-cells immediately after conjugation with fluorescent 1,1-dioctadecyl-3,3,3,3-tetramethylindodicarbocyanine (DiD)-labeled multilamellar lipid nanoparticles (top) and after 4 days of in vitro expansion (bottom) (D) Scale bar, 2 µm (E) Survival of mice after adoptive T-cell therapy is enhanced with nanoparticle conjugated T-cells illustrated by Kaplan-Meir curves (n=6 per group) Reprinted with permission from reference 79. Copyright 2010 Nature America, Inc. (F) T-cell targeted liposome with surface attached anti-Thy1.1 or IL-2Fc (G) Representative histograms of liposomes labeling antigen-specific adoptively transferred or endogenous CD8+ T-cells 48 hours after adoptive transfer and 24 hours after liposome injection. Reprinted with permission from reference 83. Copyright 2013 Elsevier B.V.

Antigens bound to the surface of liposomes generate a significantly higher antibody tire. Mice were immunized with liposomes containing 2 µg MPLA associated with peptide. (a) no peptide (b) 60 µg peptide internally encapsulated in 5 µmol lipid (c) 65 µg peptide internally encapsulated in 1 µmol lipid (d) 60 µg peptide covalently bound to liposome surface (I µmol lipid) (e) 60 µg peptide co-injected with liposomes (1 µmol lipid) to which no peptide is bound (f) peptide conjugated to ovalbumin in Freund’s complete adjuvant with boosters in Freund’s incomplete adjuvant. IgG titer was measured after the third injection with an interval of three weeks between each injection. Reprinted with permission from reference 115 Copyright 1993 Pergamon Press Ltd.

Relationship between molecular weight and uptake into lymphatics following subcutaneous injection for a series of globular proteins and small molecules in a sheep model. Data for fluorodeoxyuridine (FuDu), inulincytochrome (CyC), interferon-α (IFN), human growth hormone (hGH), soluble insulin, r metHu-Leptin (Lep), an analogue of Leptin (Lep*), epoietin alfa (EPO), darbepoetin alfa (DA) and a high molecular weight protein (HMwP) Reproduced from Kaminska and Porter with permission. Reprinted with permission from reference 133. Copyright 2011 Elsevier B.V.

Vaccination with PLGA-αCD40 nanoparticles prolong survival after tumor inoculation. Vaccines consisted of immunization in the right flank with 10 µg OVA encapsulated in nanoparticles displaying αCD40 mAb (NP-CD40), or isotype control antibody (NP-iso) at 7 days prior to tumor inoculation in the prophylactic model (A), or 7 and 17 days post-tumor inoculation in the therapeutic model (B). Tumor inoculations consisted of 2×10⁵ B16-OVA tumor cells injected s.c. in the left flank. Adapted from Rosalia et al. Reprinted with permission from reference 156. Copyright 2014 Elsevier Ltd.
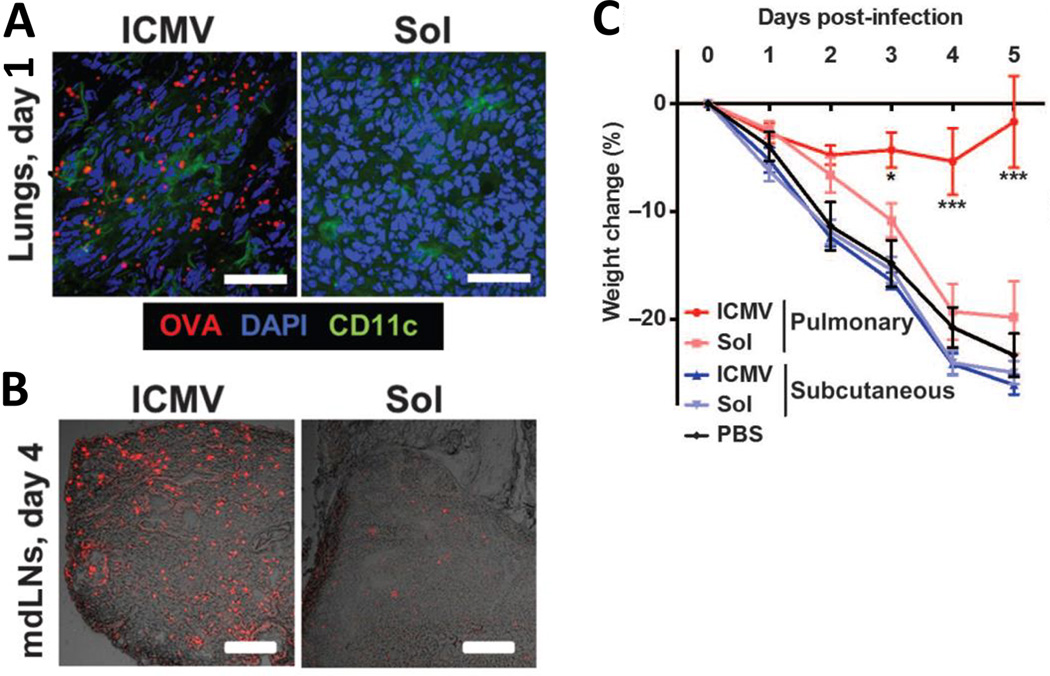
Nanoparticles targeted to lung DCs enhance vaccine uptake and protect against infection challenge. (A & B) C57BL/6 mice were immunized intratracheally with OVA in lipid nanoparticle (ICMV) or soluble formulations. Representative cryosections after intratracheal immunization with fluorescent OVA (red) from lungs on day 1 (A; scale bars, 50 µm) and mediastinal draining lymph nodes (mdLNs) on day 4 (B; scale bars, 200 µm). (C) C57BL/6 mice were immunized intratracheally or subcutaneously with a peptide vaccine in nanoparticle (ICMV) or soluble forms on days 0 and 28, then challenged by intratracheal administration of vaccinia virus (1×10⁶ PFU) on day 42; body weight changes were tracked over time. Adapted from Li et al. Reprinted with permission from reference 169. Copyright 2013 American Association for the Advancement of Science.

Cationic nanogels facilitate effective delivery of vaccine antigen into the nasal mucosa. Antigen (Clostridium botulinum type-A neurotoxin BoHc/A) was administered intranasally in cationic nanogels (cCHP-BoHc/A) or in soluble form (BoHc/A) and nasal epithelium tissue sections were collected over time. Green fluorescence refers to the antigen, BoHc/A, red fluorescence refers to the nanogels, and nuclei are represented in blue. Adapted from Nochi et al. Reprinted with permission from reference 172. Copyright 2010 Macmillan Publishers Ltd.

Carbon nanoparticles for oral vaccination. (A) Schematic of carbonization mechanism for formation of mesoporous carbon nanoparticles (C1). (B) Mean serum anti-BSA IgG profile of mice after: i.m. administration of BSA emulsified in Complete Freund’s Adjuvant (FCA), oral administration of soluble BSA, or oral administration of BSA loaded in carbon nanoparticles (C1). Prime and boost immunizations were spaced three weeks apart. Adapted from Wang et al. Reprinted with permission from reference 193. Copyright 2011 Elsevier B.V.

Distribution of solid lipid nanoparticles (SLN) and PEGylated solid lipid nanoparticles (pSLN) in small intestinal villi viewed at different magnifications. Blue fluorescence indicates the nuclei of small intestinal cells and green fluorescence indicates nanoparticles. Adapted from Yuan et al. Reprinted with permission from reference 209. Copyright 2013 American Chemical Society.

MPPs are retained in the cervicovaginal tract. (A) Overlay of particle fluorescence intensity and photographic images for conventional nanoparticles (CPs) and mucus-penetrating particles (MPPs) in the entire cervicovaginal tract tissue. (B) Percent of particles remaining over time on the basis of quantification of particle fluorescence in (A). Adapted from Ensign et al. Reprinted with permission from reference 219. Copyright 2012 American Association for the Advancement of Science.
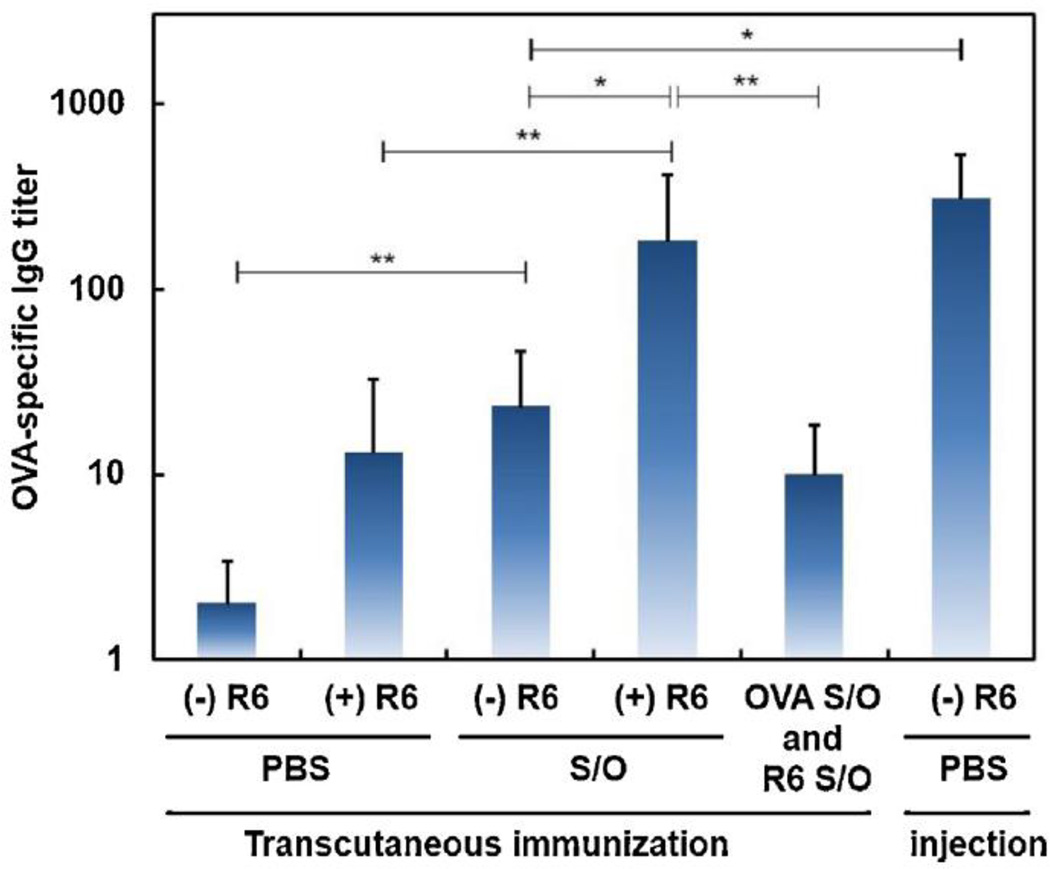
Anti-OVA mouse serum IgG response to 100 µg OVA in ddy mice (n = 5 mice) after transcutaneous application of OVA in S/O nanodispersions or in PBS with (+) or without (-) polyarginine (R6), or OVA and R6 in separate nanodispersions (OVA S/O and R6 S/O), compared to subcutaneous injection of 100 µg soluble OVA in PBS. Adapted from Kitaoka et al. Reprinted with permission from reference 227. Copyright 2013 Elsevier B.V.

A schematic view of antigen processing and presentation in dendritic cells (DCs). DC activity is initiated by pathogen-associated molecular patterns (PAMPs) and/or danger-associated molecular patterns (DAMPs) that are recognized by pattern recognition receptors (PRRs) on the DC surface. As depicted on the right, antigen and adjuvant containing nanoparticles are internalized by DCs through cell internalization pathways such as phagocytosis. Exogenous antigen is processed by proteases in endocytic vesicles (endosomes) and eventually loaded onto MHC Class II molecules found in vesicles targeted to endosomes that carry potential ligands. Once peptide is loaded onto MHC II molecules, the peptide-MHC II complex is trafficked to the cell membrane where it presents the antigen to CD4+ T-cells bearing a cognate T-cell receptor (TCR). Activated CD4+ T-cells can further initiate B-cell activation and other immune effector functions. Depicted on the left are the two alternate pathways through which antigens can be loaded onto MHC Class I molecules. In the classical MHC I loading pathway, cytosolic or endogenous antigens are processed through the proteasome. Resulting peptide fragments are transported to the endoplasmic reticulum (ER) where they are loaded onto MHC Class I molecules. In certain DCs, exogenous antigens can be loaded onto MHC Class I molecules (‘cross-presented’) when antigens from endosomes are released into the cytoplasm or when trafficked to special vacuoles (not depicted). Resulting peptide-MHC l complexes are similarly trafficked to the membrane where they can interact with CD8+ T-cells bearing cognate TCRs. Activated CD8+ T-cells have cytotoxic activity and can kill infected cells that present cognate peptide-MHC I complexed antigens. DCs also express MHC Class I-like molecules called CD1d which present lipid antigens like a-galactosylceramide (a-Gal-Cer) to invariant TCRs on NKT cells. On the lower right side, nanoparticles carrying α-Gal-Cer are internalized, processed and lipid antigen is presented on CD1d to TCRs on NKT cells. NKT activation further leads to NK cell transactivation.

Liposomes with surface-displayed B cell epitope (membrane-proximal external region, MPER) and encapsulated T-cell epitope (HIV30) promote strong B-cell responses against MPER while minimizing off-target responses against the helper epitope. (A) Schematic of 3 forms of T-helper epitope incorporation in MPER liposomes. Only in the case of TCEP cleaved external HIV30 is the T-helper epitope displayed solely intrastructurally. (B) Mice were immunized with 150 nm MPER liposomes with soluble or incorporated HIV30 with co-delivered adjuvant-containing liposomes. Shown are serum anti-MPER and anti-HIV30 IgG titers 7 days post-boost. Liposomes with “hidden” T helper HIV30 epitopes (cleaved HIV30) elicited greatly reduced antibody responses against the helper sequence. Adapted from Hanson et al. Reprinted with permission from reference 142. Copyright 2014 Elsevier Ltd.

(A) Schematic describing chemical and physical differences between solid-core NPs and water-core polymersomes (PS). Mice were immunized s.c. 3 times at 2-week intervals with various OVA formulations. One week after the final immunization, splenocytes, lymph nodes cells and lung leukocytes were isolated and restimulated ex vivo with OVA for 6 hours. PSs were more effective than NPs in inducing cytokine-secreting CD4+ T-cells (B) while NPs were more effective in inducing cytokine-secreting CD8+ T-cells (C). Co-administration of both particle types elicited T-cell immunity characteristic of the two particles at the same time. Adapted from Stano et al. Reprinted with permission from reference 256. Copyright 2013 Elsevier Ltd.

Sustained-release PLGA nanoparticles induce stronger immune responses than fast-release liposomes. (A) OVA release profiles from liposomes and PLGA nanoparticles incubated in PBS at 37°C. (B) Splenocytes from mice (n=3)—immunized subcutaneously on day 0 and challenged on day 90 with i.v. 5 ×10⁴ CFU of OVA-expressing L. monocytogenes —were collected on day 7 post-challenge and pulsed with SIINFEKL. Activated antigen-specific CD8+CD44+ T-cells were determined using a SIINFEKL tetramer. Adapted from Demento et al. Reprinted with permission from reference 280. Copyright 2012 Elsevier Ltd.

Immunization with two TLR agonists induces persistent germinal centers and long-lived antibody-forming cells in draining lymph nodes. C57BL/6 mice were immunized with OVA encapsulated in nanoparticles with TLR-4 agonist (MPL) and TLR-7 agonist (R837) plus antigen. (A) Antibody titers 4 weeks post-prime. (B) Germinal centers (GCs) were counted in draining lymph node (LN) sections over time. (C) ELISPOT assay quantification of antibody-secreting cells in lymph nodes over time. Adapted from Kasturi et al. Reprinted with permission from reference 309. Copyright 2011 Macmillan Publishers Ltd.
References
-
- Charles A Janeway J, Travers P, Walport M, Shlomchik MJ. Principles of Innate and Adaptive Immunity. 2001
Publication types
MeSH terms
Substances
Grants and funding
LinkOut - more resources
Full Text Sources
Other Literature Sources
