. 2015 Feb 3;4(5):e1005460.
doi: 10.1080/2162402X.2015.1005460. eCollection 2015 May.

Th22 cells increase in poor prognosis multiple myeloma and promote tumor cell growth and survival

Affiliations

Th22 cells increase in poor prognosis multiple myeloma and promote tumor cell growth and survival

Giulia Di Lullo et al. Oncoimmunology. .

Abstract

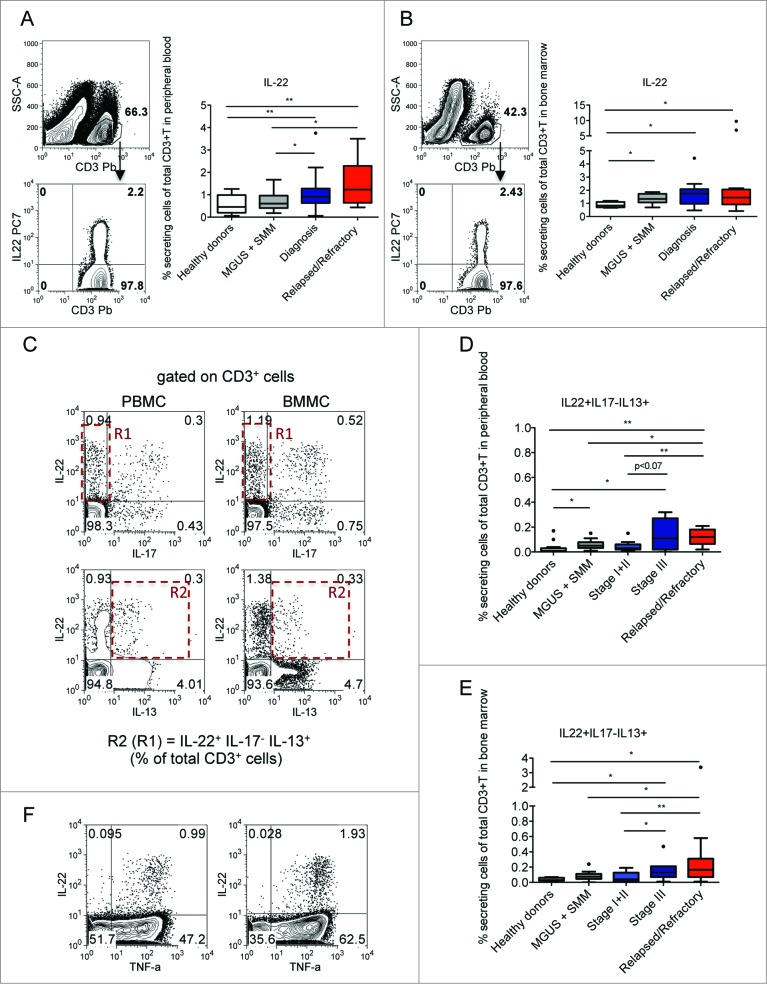
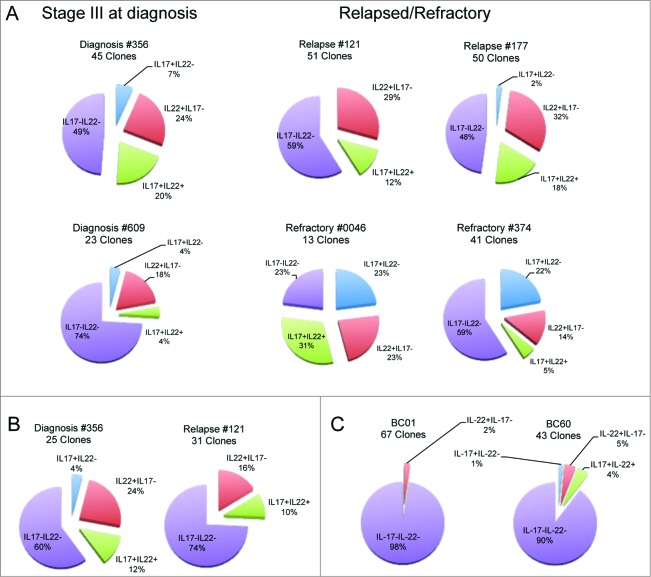
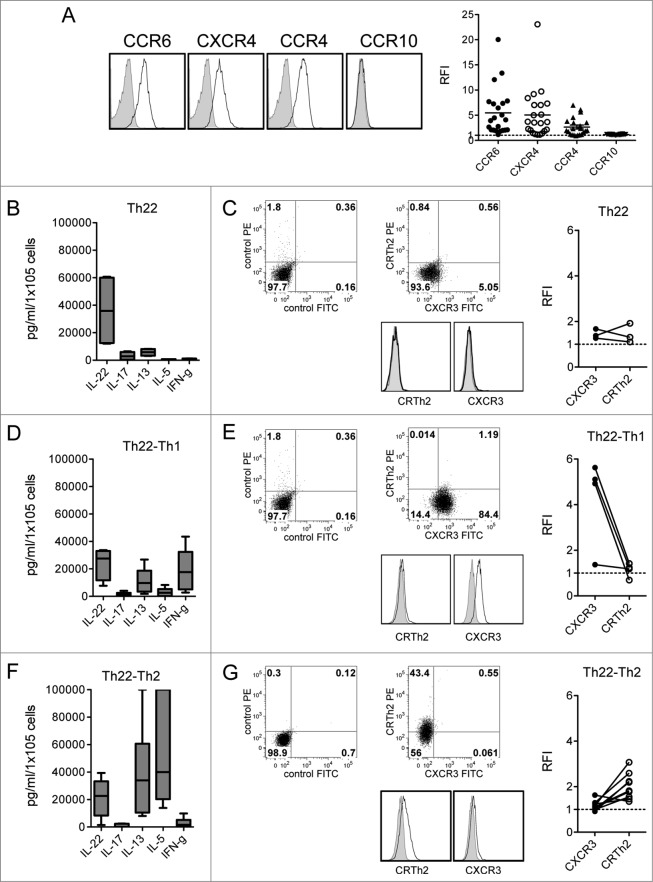
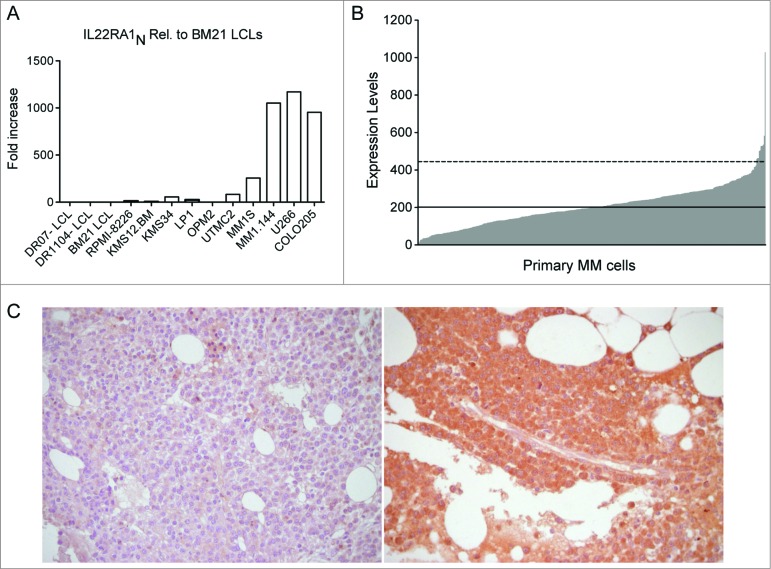
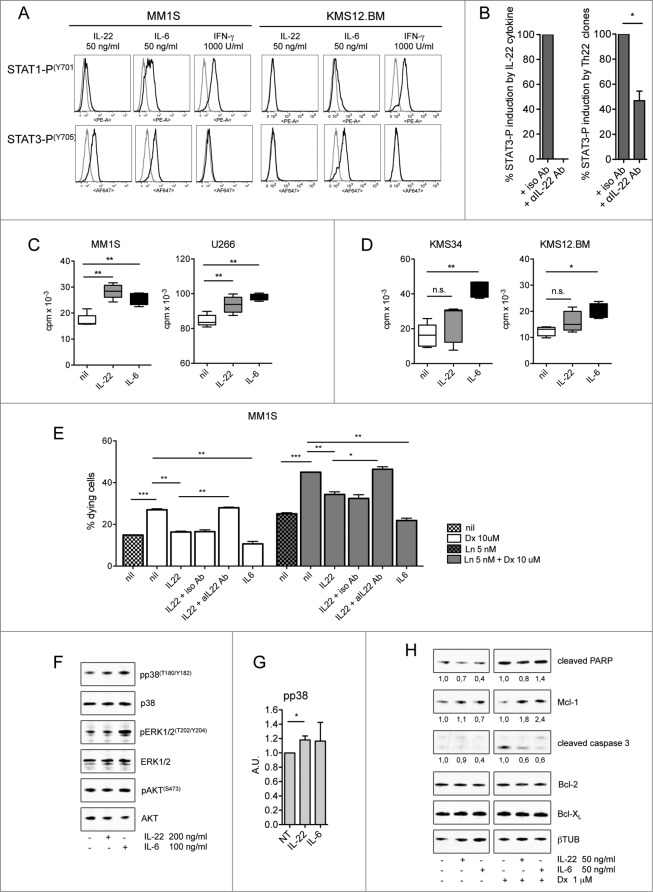
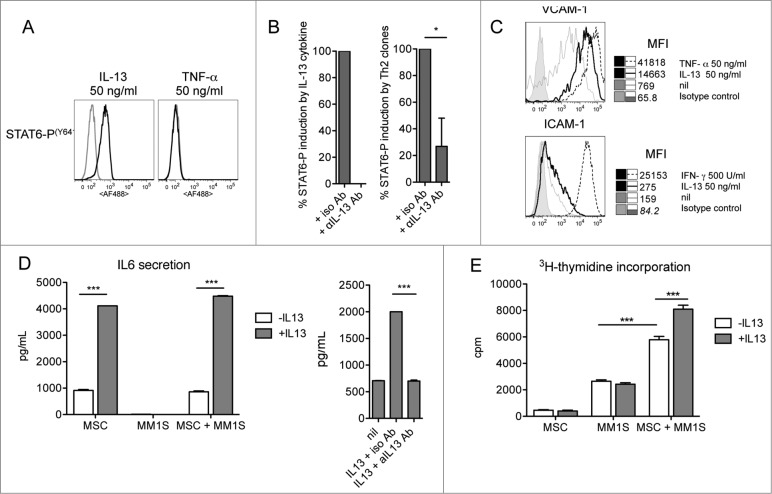
There is increased production of plasmacytoid dendritic cells (pDCs) in the bone marrow (BM) of multiple myeloma (MM) patients and these favor Th22 cell differentiation. Here, we found that the frequency of interleukin (IL)-22+IL-17-IL-13+ T cells is significantly increased in peripheral blood (PB) and BM of stage III and relapsed/refractory MM patients compared with healthy donors and patients with asymptomatic or stage I/II disease. Th22 cells cloned from the BM of MM patients were CCR6+CXCR4+CCR4+CCR10- and produced IL-22 and IL-13 but not IL-17. Furthermore, polyfunctional Th22-Th2 and Th22-Th1 clones were identified based on the co-expression of additional chemokine receptors and cytokines (CRTh2 or CXCR3 and IL-5 or interferon gamma [IFNγ], respectively). A fraction of MM cell lines and primary tumors aberrantly expressed the IL-22RA1 and IL-22 induced STAT-3 phosphorylation, cell growth, and resistance to drug-induced cell death in MM cells. IL-13 treatment of normal BM mesenchymal stromal cells (MSCs) induced STAT-6 phosphorylation, adhesion molecule upregulation, and increased IL-6 production and significantly favored MM cell growth compared with untreated BM MSCs. Collectively, our data show that increased frequency of IL-22+IL-17-IL-13+ T cells correlates with poor prognosis in MM through IL-22 and IL-13 protumor activity and suggest that interference with IL-22 and IL-13 signaling pathways could be exploited for therapeutic intervention.

Keywords: Ab, antibody; BM, bone marrow; BMMCs, bone marrow mononuclear cells; DCs, dendritic cells; Dx, dexamethasone; ICS, intracellular cytokine staining; IFN, interferon; IL, interleukin; ISS, International Staging System; LCL, Epstein–Barr virus-transformed B lymphoblastoid cell line; Ln, lenalidomide; MGUS, monoclonal gammopathy of undetermined clinical significance; MM, multiple myeloma; MSC, mesenchymal stromal cell; PB, peripheral blood; PBMCs, peripheral blood mononuclear cells; pDCs, plasmacytoid dendritic cells; SMM, smoldering multiple myeloma; Th, T helper; TNF, tumor necrosis factor; Treg, regulatory T cells; WB, Western blot; CD4+ T helper lymphocytes; IL-22RA1; Th22 cells; bone marrow mesenchymal stromal cells; bone marrow microenvironment; interleukin-13; interleukin-22; multiple myeloma.


Figures

Figure 1
Figure 1
(see previous page). IL-22+IL-17IL-13+ CD3+ T cells are increased in the PB and BM of MM patients with poor prognosis. Tukey plots of cumulative results (A, B, D, and E) and dot-plots of representative data from cytokine-ICS analyses (A [left], B [left], C, and F). (A) Analysis for IL-22 expression was conducted on CD3+ cells (left, representative of PBMCs of patient #356). Percentage of IL-22+ T cells in PB of healthy donors (n = 15), MGUS+SMM (n = 11), MM at diagnosis (n = 20), and relapsed/refractory MM (n = 9). (B) Analysis for IL-22 expression was conducted on CD3+ cells (left, representative of BMMCs of patient #356). Percentage of IL-22+ T cells in the BM of healthy donors (n = 4), MGUS+SMM (n = 9), MM at diagnosis (n = 18), and relapsed/refractory MM (n = 14). (C) Representative ICS of PBMCs and BMMCs of patient #177. Top: IL-22 and IL-17 expression. Bottom: IL-22 and IL-13 expression. Gate of IL-22+IL-17 (R1) cells was used for analysis of IL-22+IL-17IL-13+ cells (R2). (D) Percentage of IL-22+IL-17IL-13+ T cells in PB of healthy donors (n = 15), MGUS+SMM (n = 11), MM at diagnosis divided into stage I+II (n = 13) and stage III (n = 7) and relapsed/refractory MM (n = 9). (E) Percentage of IL-22+IL-17-IL-13+ T cells in BM aspirates of healthy donors (n = 4), MGUS+SMM (n = 9), MM at diagnosis divided into stage I+II (n = 11) and stage III (n = 7) and relapsed/refractory MM (n = 14). Responses significantly different by the Mann–Whitney U test are indicated as: *, P < 0.05 and **, 0.001 < P < 0.01. (F) Representative ICS for IL-22 and TNFα expression in PBMCs (left) and BMMCs (right) of patient #177.
Figure 2.
Figure 2.
Distribution of CD4+CCR6+ T-cell clones based on the profile of IL-22 and IL-17 secretion. Cake graphs of percentages of IL-22+IL-17 (red slices), IL-22+IL-17+ (light blue slices), IL-22IL-17+ (green slices), and IL-22IL-17 (violet slices) clones obtained from the (A) BM of MM patients (B) and PB of MM patients, and (C) healthy donors. Clonal efficiencies for cloning conducted after in vitro expansion were (A) 48.2% and 55.6% for BM of patients #356 and #121, respectively and (B) 25.4% and 21.1% for PB of the same patients, respectively. (C) Clonal efficiencies for PB of healthy donors were 45.8% and 76.9% for BC01 and BC60, respectively. Clonal efficiencies for cloning conducted immediately after sorting were 4%, 11.9%, 2.3%, and 7.6% for BM of patients #609, #177, #0046, and #374, respectively (A). For patient characteristics, see Table 1.
Figure 3.
Figure 3.
Chemokine receptor and cytokine profile of Th22 clones from the BM of MM patients. (A) Surface expression of CCR6, CXCR4, CCR4, and CCR10. (Left) Representative histograms: isotype control staining (solid gray), chemokine receptor-specific staining (black line). (Right) RFI (i.e., fold increase in mean fluorescence intensity relative to isotype control) calculated for each clone. (B, D, and F) Cumulative cytokine secretion by clones from different MM patients represented as Whisker plots. (B) Th22 clones (n = 4). (D) Th22-Th1 clones (n = 8). (F) Th22-Th2 clones (n = 10). (C-E-G) (Left and middle) Analysis of CXCR3 and CRTh2 expression in one representative Th22 (C), Th22-Th1 (E), and Th22-Th2 (G) clone, respectively. Dot plots (left and middle upper) and histograms (middle lower) from representative clones are shown. (Right) Cumulative RFI of paired CXCR3 and CRTh2 staining calculated for each clone.
Figure 4.
Figure 4.
IL-22RA1 is expressed in a fraction of MM cell lines and primary tumors. (A) mRNA expression of IL-22RA1 in MM cell lines. COLO205 cells were positive controls. Epstein–Barr virus-transformed B lymphoblastoid cell lines (LCLs) were negative controls. (B) mRNA expression of IL-22RA1 in primary MM cells of a cohort of 414 newly diagnosed patients described in ref. 34. The expression pattern for the probe set 220056_at is shown. Continued line: median. Dotted line: 2× standard deviation. (C) IL-22RA1 protein expression in BM biopsies from MM patients #121 (negative) (left) and #177 (positive) (right). Images were acquired at a ×40 magnification.
Figure 5 (see previous page).
IL-22 induces MM cell activation, proliferation, and resistance to drug-induced cell death. (A) Representative staining for phosphorylated STAT-1 and STAT-3 (n = 6). MM1S are representative of IL–22RA1-positive cells, KMS34 for low/absent IL-22RA1 expression. IL-6 and IFNγ were positive controls for phosphorylated STAT-3 and STAT-1, respectively; unstimulated cells (gray line) and cytokine-stimulated cells (black line). (B) Cumulative percentage of induction of STAT-3 phosphorylation by recombinant IL-22 (left) and supernatants of Th22 clones (i.e., C37 and 374-19) (right) in the presence of anti-IL-22 or isotype control antibodies (Abs). Recombinant IL-22 was used at 20 ng/mL. IL-22 measured in the supernatants was 20 and 26.5 ng/mL for clone C37 and clone 374-19, respectively. (C and D) 3H-thymidine incorporation of MM cells cultured in the absence (nil) or in the presence of IL-22 (50 ng/mL) or IL-6 (50 ng/mL) in IL–22RA1-positive (C) and -negative (D) cells. Representative data from 1 of 4 independent experiments are depicted for each cell line. (E) Percentages of dying MM cells after (i) 24-h incubation with Dx in the absence (nil) or presence of IL-22 (20 ng/mL) or IL-6 (20 ng/mL) and in the presence of anti-IL-22 or isotype control Abs (2.5 μg/mL); (ii) 48-h incubation with Ln; and (iii) 24-h incubation with Ln followed by 24-h incubation with both drugs in the absence or the presence of IL-22 or IL-6 and in the presence of anti-IL-22 or isotype control Abs (n = 2). (F) WB of phosphorylated (p) p38, p38, pERK1/2, ERK1/2, pAKT, and AKT in MM1S untreated or treated with IL-22 or IL-6, as indicated. (G) pp38 data were quantified by densitometric analysis, normalized using p38, and divided by the value of untreated cells (Arbitrary Units, A.U.). (H) WB analysis of Mcl-1, Bcl-2, Bcl-XL, and cleaved PARP and caspase-3 in MM1S untreated or treated with IL-22 or IL-6 and in the absence or in the presence of Dx, as indicated (n = 2). A.U. were calculated as in (G), using β-tubulin (βTUB) for normalization, and are reported at the bottom of the lanes. IL-6 was used throughout as the positive control. Significant values calculated with the Mann–Whitney U test (C and D) or unpaired, one-tailed Student's t-test (E) are indicated as: *, P < 0.05; **, 0.001 < P < 0.01; and ***, P < 0.001.
Figure 6.
Figure 6.
IL-13 induces BM-MSC activation and adhesion molecule upregulation, enhances IL-6 production and IL–13-treated BM-MSCs favor MM cell proliferation. (A) Representative staining for phosphorylated STAT-6 (n = 3). TNFα was used as negative control. Unstimulated cells (gray line) and cytokine-stimulated cells (black line). (B) Cumulative percentage of induction of STAT-6 phosphorylation by recombinant IL-13 (left) and the supernatants of Th22 clones (i.e., A15 and 05.08) (right) in the presence of anti-IL-13 or isotype control Abs. Recombinant IL-13 was used at 10 ng/mL. Clone A15 supernatant (IL-13 = 90 ng/mL) was used diluted (1:10) and clone 05.08 supernatant (IL-13 = 15 ng/mL) was used undiluted. (C) Representative VCAM-1 and ICAM-1 expression on untreated (nil) or IL–13-treated BM-MSCs (n = 2). TNFα and IFNγ were positive controls. (D, left) Representative IL-6 secretion by untreated (-IL-13, white bars) or treated (+IL-13, gray bars) BM-MSCs in the absence or in the presence of MM1S cells (n = 3). (D, right) Effect of addition of anti-IL-13 or isotype control Abs on IL-6 secretion by BM-MSCs. (E) Representative MM1S cell proliferation in the presence of untreated (-IL-13, white bars) or IL-13 (+IL-13, gray bars)-treated BM-MSCs (n = 3). IL-13 in (D) and (E) was used at 50 ng/mL. Responses significantly different are indicated as: *, P < 0.05 and ***, P < 0.001 (determined by paired, one-tailed Student's t-test).

References

    1. Palumbo A, Anderson K. Multiple myeloma. N Engl J Med 2011; 364:1046-60; PMID:; http://dx.doi.org/10.1056/NEJMra1011442 - DOI - PubMed
    1. Hideshima T, Mitsiades C, Tonon G, Richardson PG, Anderson KC. Understanding multiple myeloma pathogenesis in the bone marrow to identify new therapeutic targets. Nat Rev Cancer 2007; 7:585-98; PMID:; http://dx.doi.org/10.1038/nrc2189 - DOI - PubMed
    1. Dimopoulos MA, San-Miguel JF, Anderson KC. Emerging therapies for the treatment of relapsed or refractory multiple myeloma. Eur J Haematol 2011; 86:1-15; PMID:; http://dx.doi.org/10.1111/j.1600-0609.2010.01542.x - DOI - PubMed
    1. Borrello I. Can we change the disease biology of multiple myeloma? Leuk Res 2012; 36(Suppl 1):S3-12; PMID:; http://dx.doi.org/10.1016/S0145-2126(12)70003-6 - DOI - PMC - PubMed
    1. Rajkumar SV. Treatment of multiple myeloma. Nat Rev Clin Oncol 2011; 8:479-91; PMID:; http://dx.doi.org/10.1038/nrclinonc.2011.63 - DOI - PMC - PubMed

Publication types