

Spatial variation of compound muscle action potentials across human gastrocnemius medialis
- PMID: 26156382
- PMCID: PMC4563026
- DOI: 10.1152/jn.00221.2015
Spatial variation of compound muscle action potentials across human gastrocnemius medialis
Abstract
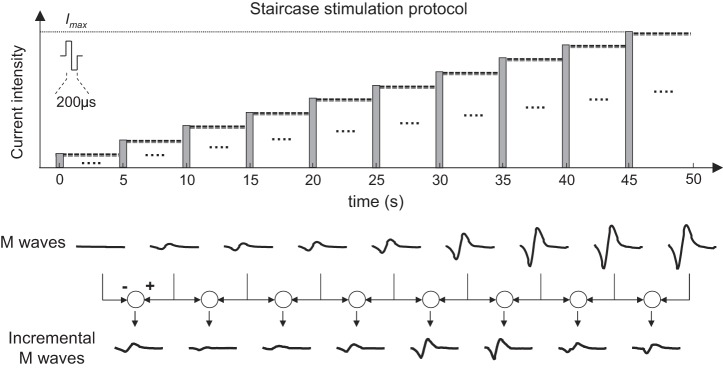
The massed action potential (M wave) elicited through nerve stimulation underpins a wide range of physiological and mechanical understanding of skeletal muscle structure and function. Although systematic approaches have evaluated the effect of different factors on M waves, the effect of the location and distribution of activated fibers within the muscle remains unknown. By detecting M waves from the medial gastrocnemius (MG) of 12 participants with a grid of 128 electrodes, we investigated whether different populations of muscle units have different spatial organization within MG. If populations of muscle units occupy discrete MG regions, current pulses of progressively greater intensities applied to the MG nerve branch would be expected to lead to local changes in M-wave amplitudes. Electrical pulses were therefore delivered at 2 pps, with the current pulse amplitude increased every 10 stimuli to elicit different degrees of muscle activation. The localization of MG response to increases in current intensity was determined from the spatial distribution of M-wave amplitude. Key results revealed that increases in M-wave amplitude were detected somewhat locally, by 10-50% of the 128 electrodes. Most importantly, the electrodes detecting greatest increases in M-wave amplitude were localized at different regions in the grid, with a tendency for greater stimulation intensities to elicit M waves in the more distal MG region. The presented results indicate that M waves recorded locally may not provide a representative MG response, with major implications for the estimation of, e.g., the maximal stimulation levels, the number of motor units, and the onset and normalization in H-reflex studies.
Keywords: M wave; electrical stimulation; medial gastrocnemius; motor units; surface EMG.
Copyright © 2015 the American Physiological Society.
Figures


Similar articles
-
Nonlinear twitch torque summation by motor units activated at M-wave and H-reflex latencies.Muscle Nerve. 2009 Aug;40(2):221-30. doi: 10.1002/mus.21288. Muscle Nerve. 2009. PMID: 19609909
-
Contributions to the understanding of gait control.Dan Med J. 2014 Apr;61(4):B4823. Dan Med J. 2014. PMID: 24814597 Review.
-
EMG power spectrum and features of the superimposed M-wave during voluntary eccentric and concentric actions at different activation levels.Eur J Appl Physiol. 2002 Apr;86(6):534-40. doi: 10.1007/s00421-001-0563-3. Epub 2002 Mar 1. Eur J Appl Physiol. 2002. PMID: 11944102
-
Spatial variability of muscle activity during human walking: the effects of different EMG normalization approaches.Neuroscience. 2015 Aug 6;300:19-28. doi: 10.1016/j.neuroscience.2015.05.003. Epub 2015 May 9. Neuroscience. 2015. PMID: 25967267
-
M-wave, H- and V-reflex recruitment curves during maximal voluntary contraction.J Clin Neurophysiol. 2013 Aug;30(4):415-21. doi: 10.1097/WNP.0b013e31829ddcf1. J Clin Neurophysiol. 2013. PMID: 23912583
Cited by
-
Potentiation of the first and second phases of the M wave after maximal voluntary contractions in the biceps brachii muscle.Med Biol Eng Comput. 2019 Oct;57(10):2231-2244. doi: 10.1007/s11517-019-02025-7. Epub 2019 Aug 13. Med Biol Eng Comput. 2019. PMID: 31410691
-
Electrode position markedly affects knee torque in tetanic, stimulated contractions.Eur J Appl Physiol. 2016 Feb;116(2):335-42. doi: 10.1007/s00421-015-3289-3. Epub 2015 Nov 2. Eur J Appl Physiol. 2016. PMID: 26526290
-
Changes in tibialis anterior architecture affect the amplitude of surface electromyograms.J Neuroeng Rehabil. 2017 Aug 14;14(1):81. doi: 10.1186/s12984-017-0291-5. J Neuroeng Rehabil. 2017. PMID: 28807025 Free PMC article.
-
Characterization of torque generating properties of ankle plantar flexor muscles in ambulant adults with cerebral palsy.Eur J Appl Physiol. 2019 May;119(5):1127-1136. doi: 10.1007/s00421-019-04102-z. Epub 2019 Feb 18. Eur J Appl Physiol. 2019. PMID: 30778762
-
Neuromechanical basis of region-specific differences and their implications for sport performance and injury prevention: a narrative review.Eur J Appl Physiol. 2025 Jul 25. doi: 10.1007/s00421-025-05889-w. Online ahead of print. Eur J Appl Physiol. 2025. PMID: 40711548 Review.
References
-
- Barber L, Barrett R, Lichtwark G. Validation of a freehand 3D ultrasound system for morphological measures of the medial gastrocnemius muscle. J Biomech 42: 1313–1319, 2009. - PubMed
-
- Bostock H, Cikurel K, Burke D. Threshold tracking techniques in the study of human peripheral nerve. Muscle Nerve 21: 137–158, 1998. - PubMed
Publication types
MeSH terms
LinkOut - more resources
Full Text Sources
Other Literature Sources