

Single cell super-resolution imaging of E. coli OmpR during environmental stress
- PMID: 26156621
- PMCID: PMC8428147
- DOI: 10.1039/c5ib00077g
Single cell super-resolution imaging of E. coli OmpR during environmental stress
Abstract
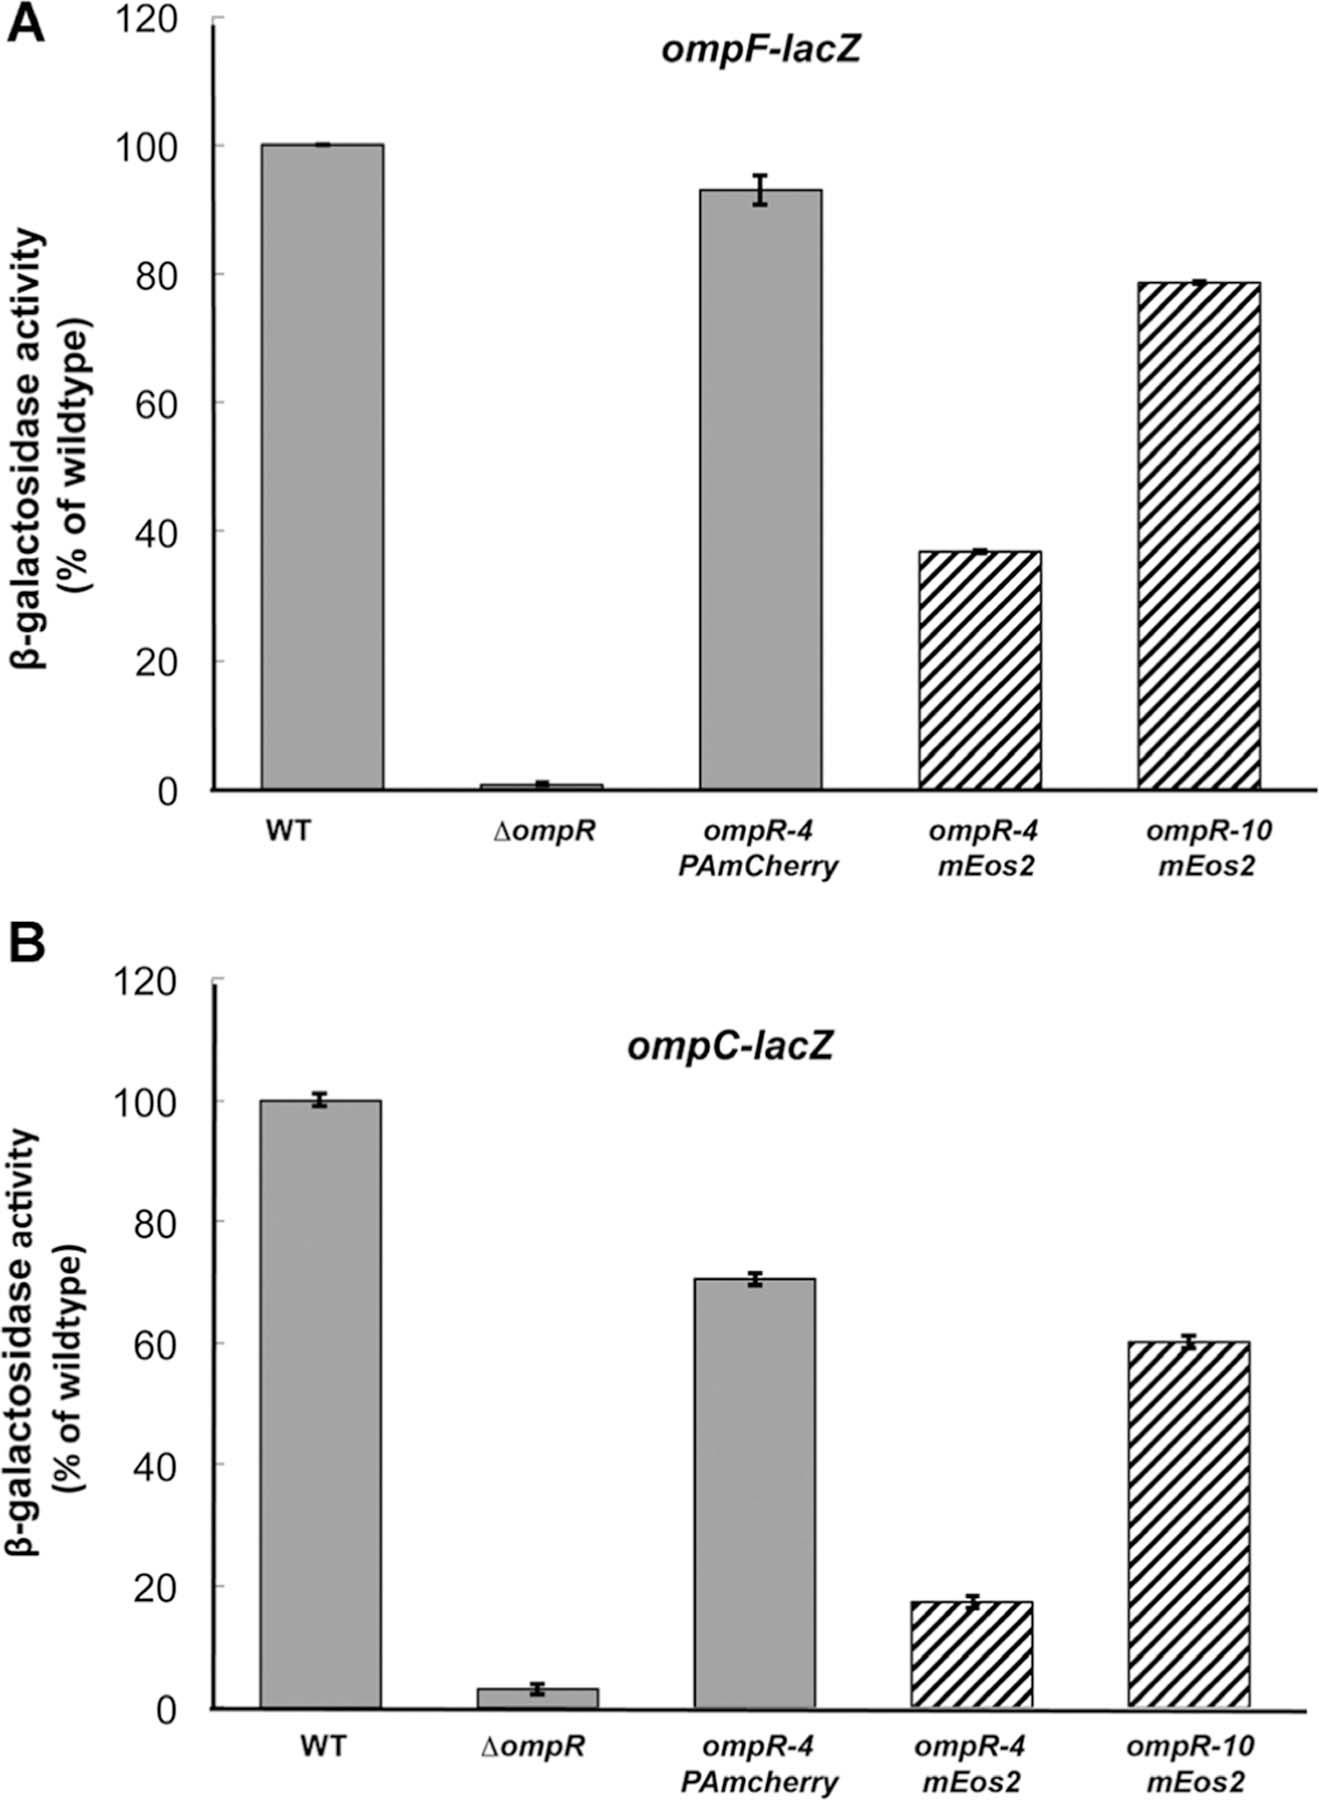
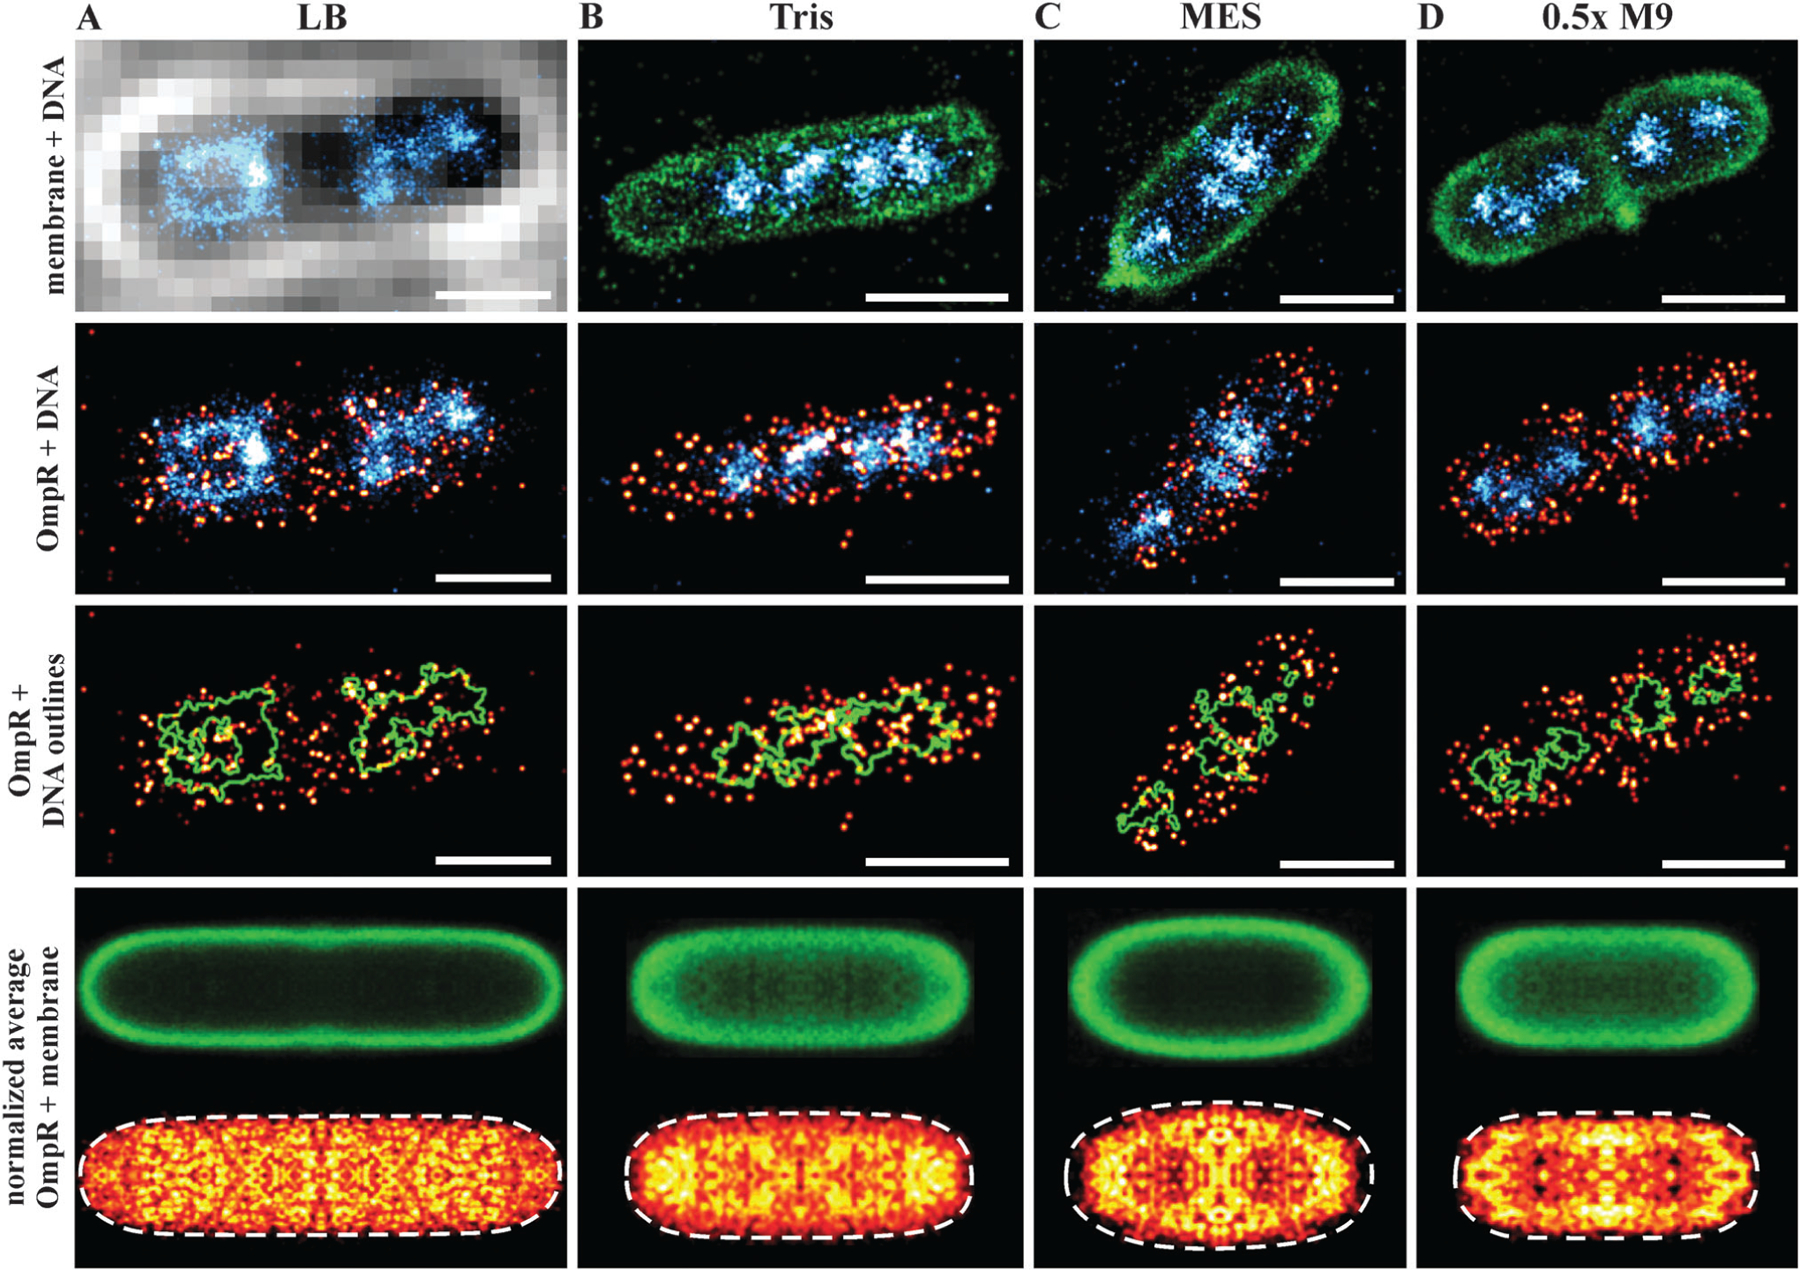
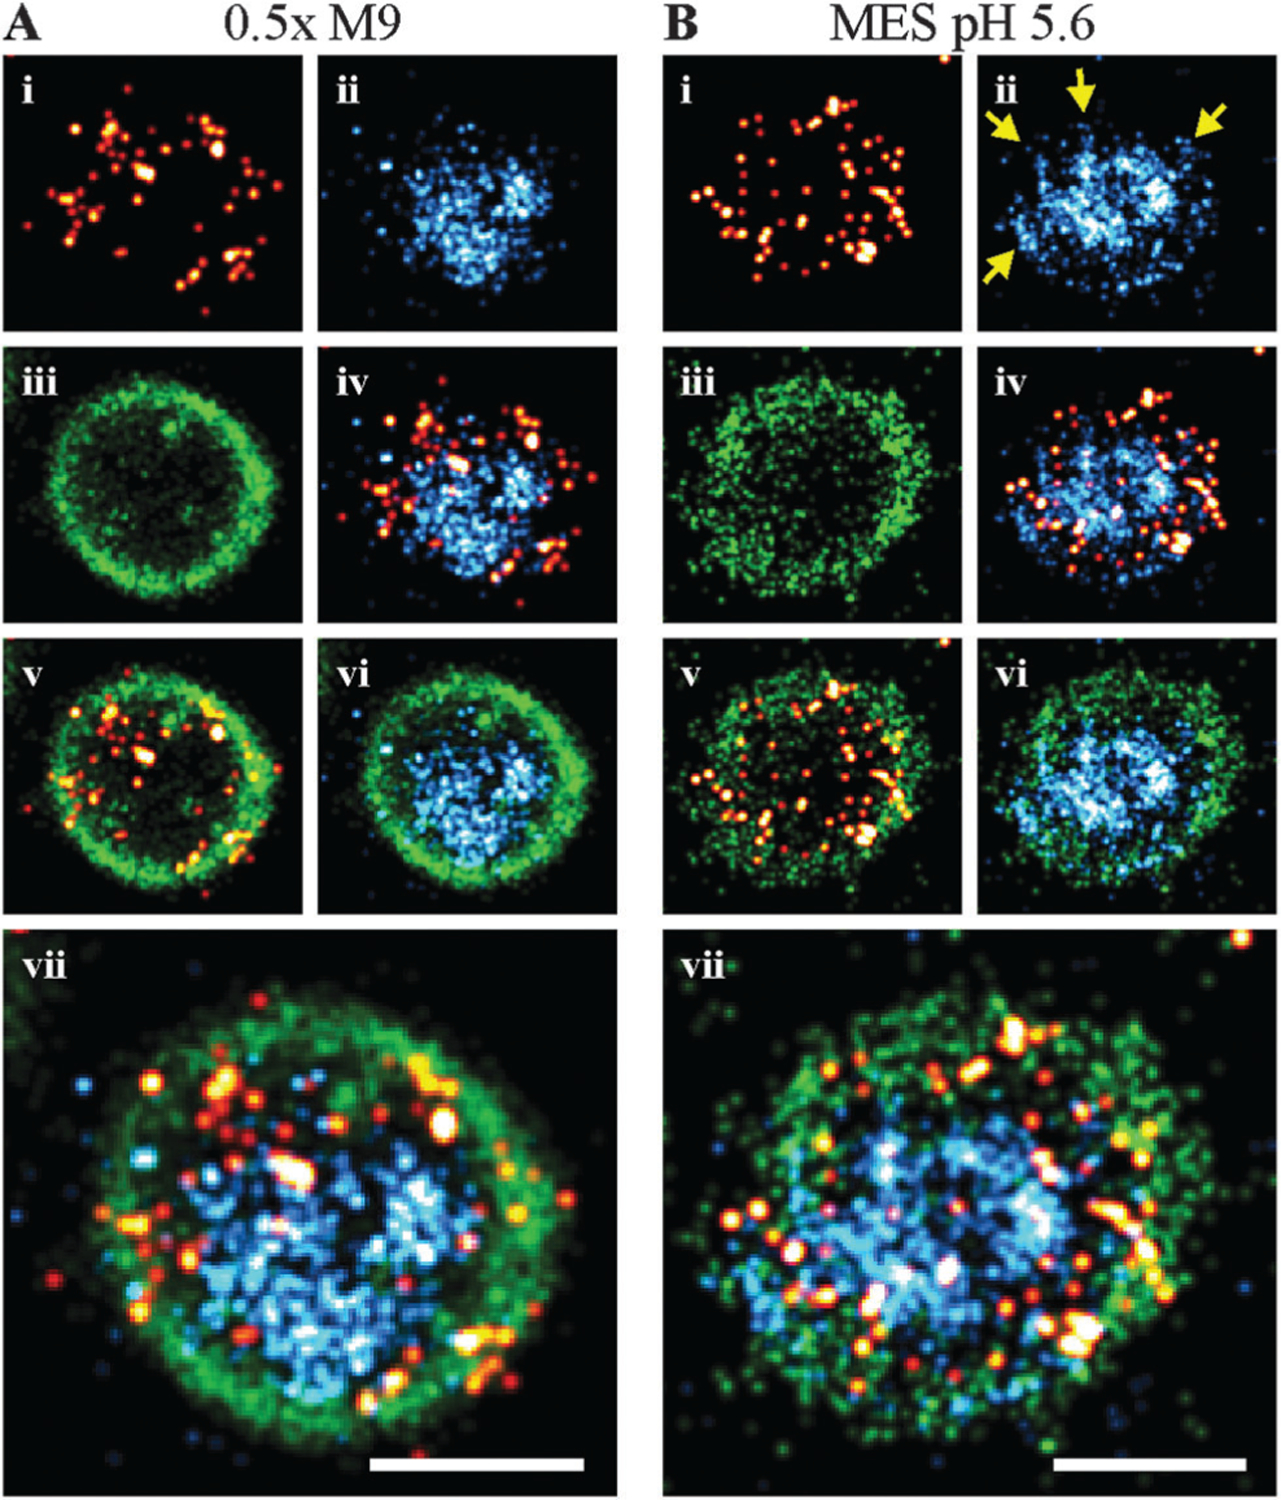
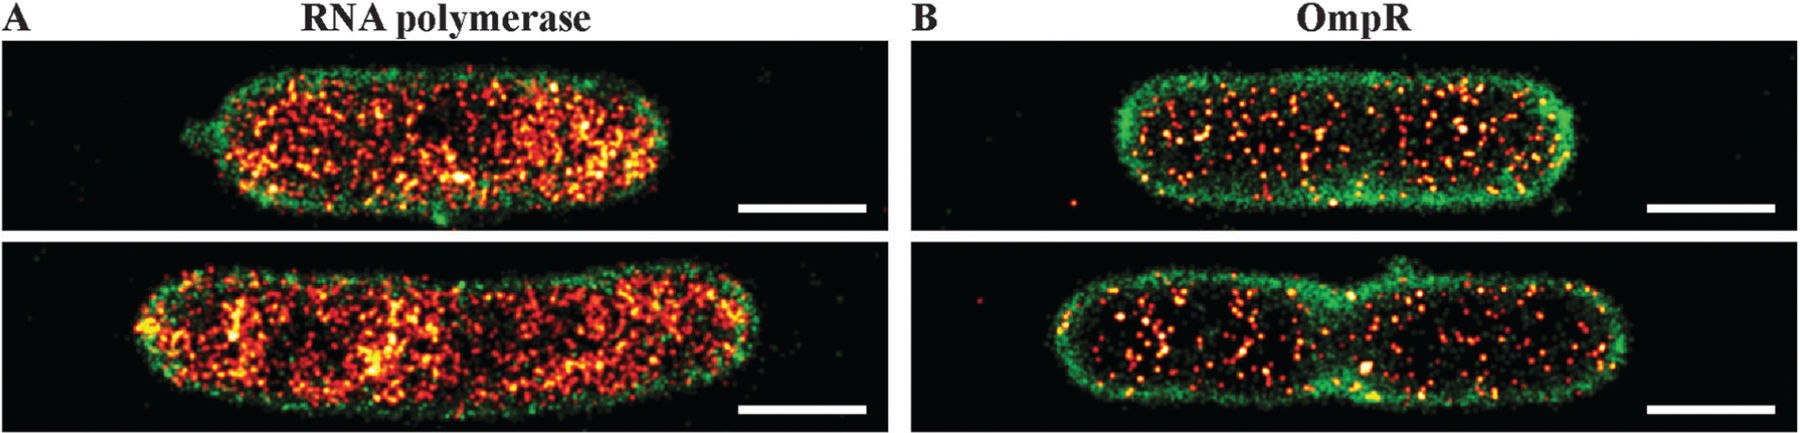
Two-component signaling systems are a major strategy employed by bacteria, and to some extent, yeast and plants, to respond to environmental stress. The EnvZ/OmpR system in E. coli responds to osmotic and acid stress and is responsible for regulating the protein composition of the outer membrane. EnvZ is a histidine kinase located in the inner membrane. Upon activation, it is autophosphorylated by ATP and subsequently, it activates OmpR. Phosphorylated OmpR binds with high affinity to the regulatory regions of the ompF and ompC porin genes to regulate their transcription. We set out to visualize these two-components in single bacterial cells during different environmental stress conditions and to examine the subsequent modifications to the bacterial nucleoid as a result. We created a chromosomally-encoded, active, fluorescent OmpR-PAmCherry fusion protein and compared its expression levels with RNA polymerase. Quantitative western blotting had indicated that these two proteins were expressed at similar levels. From our images, it is evident that OmpR is significantly less abundant compared to RNA polymerase. In cross-sectional axial images, we observed OmpR molecules closely juxtaposed near the inner membrane during acidic and hyposomotic growth. In acidic conditions, the chromosome was compacted. Surprisingly, under acidic conditions, we also observed evidence of a spatial correlation between the DNA and the inner membrane, suggesting a mechanical link through an active DNA-OmpR-EnvZ complex. This work represents the first direct visualization of a response regulator with respect to the bacterial chromosome.
Figures
Similar articles
-
Application of fluorescence resonance energy transfer to examine EnvZ/OmpR interactions.Methods Enzymol. 2007;422:352-60. doi: 10.1016/S0076-6879(06)22017-2. Methods Enzymol. 2007. PMID: 17628148
-
Cytoplasmic sensing by the inner membrane histidine kinase EnvZ.Prog Biophys Mol Biol. 2015 Sep;118(3):119-29. doi: 10.1016/j.pbiomolbio.2015.04.005. Epub 2015 May 1. Prog Biophys Mol Biol. 2015. PMID: 25937465 Free PMC article.
-
Formation of the stoichiometric complex of EnvZ, a histidine kinase, with its response regulator, OmpR.Mol Microbiol. 2002 Dec;46(5):1273-82. doi: 10.1046/j.1365-2958.2002.03239.x. Mol Microbiol. 2002. PMID: 12453214
-
EnvZ/OmpR Two-Component Signaling: An Archetype System That Can Function Noncanonically.EcoSal Plus. 2020 Jan;9(1):10.1128/ecosalplus.ESP-0001-2019. doi: 10.1128/ecosalplus.ESP-0001-2019. EcoSal Plus. 2020. PMID: 32003321 Free PMC article. Review.
-
Signal transduction and gene regulation through the phosphorylation of two regulatory components: the molecular basis for the osmotic regulation of the porin genes.Mol Microbiol. 1990 Jul;4(7):1077-82. doi: 10.1111/j.1365-2958.1990.tb00681.x. Mol Microbiol. 1990. PMID: 1700256 Review.
Cited by
-
Changes in the Vibrio harveyi Cell Envelope Subproteome During Permanence in Cold Seawater.Microb Ecol. 2016 Oct;72(3):549-58. doi: 10.1007/s00248-016-0802-0. Epub 2016 Jun 20. Microb Ecol. 2016. PMID: 27324654
-
Optimization of sample preparation and green color imaging using the mNeonGreen fluorescent protein in bacterial cells for photoactivated localization microscopy.Sci Rep. 2018 Jul 4;8(1):10137. doi: 10.1038/s41598-018-28472-0. Sci Rep. 2018. PMID: 29973667 Free PMC article.
-
Single cell, super-resolution imaging reveals an acid pH-dependent conformational switch in SsrB regulates SPI-2.Elife. 2019 Apr 29;8:e45311. doi: 10.7554/eLife.45311. Elife. 2019. PMID: 31033442 Free PMC article.
-
Bacterial Vivisection: How Fluorescence-Based Imaging Techniques Shed a Light on the Inner Workings of Bacteria.Microbiol Mol Biol Rev. 2020 Oct 28;84(4):e00008-20. doi: 10.1128/MMBR.00008-20. Print 2020 Nov 18. Microbiol Mol Biol Rev. 2020. PMID: 33115939 Free PMC article. Review.
-
Non-canonical activation of OmpR drives acid and osmotic stress responses in single bacterial cells.Nat Commun. 2017 Nov 14;8(1):1587. doi: 10.1038/s41467-017-02030-0. Nat Commun. 2017. PMID: 29138484 Free PMC article.
References
-
- Feng X, Oropeza R and Kenney LJ, Dual regulation by phospho-OmpR of ssrA/B gene expression in Salmonella pathogenicity island 2, Mol. Microbiol, 2003, 48, 1131–1143. - PubMed
MeSH terms
Substances
Grants and funding
LinkOut - more resources
Full Text Sources
Molecular Biology Databases
