. 2015 Sep 15;405(2):316-27.
doi: 10.1016/j.ydbio.2015.07.002. Epub 2015 Jul 5.

REST represses a subset of the pancreatic endocrine differentiation program

Affiliations

REST represses a subset of the pancreatic endocrine differentiation program

David Martin et al. Dev Biol. .

Abstract

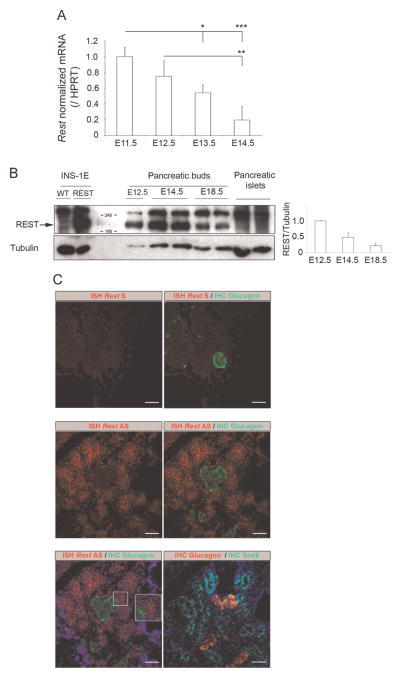
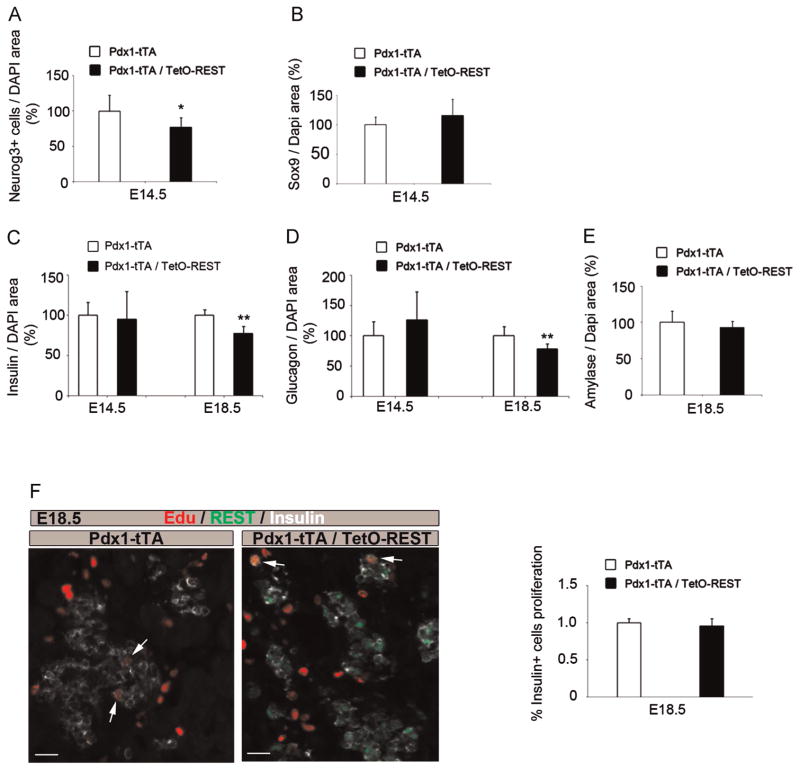
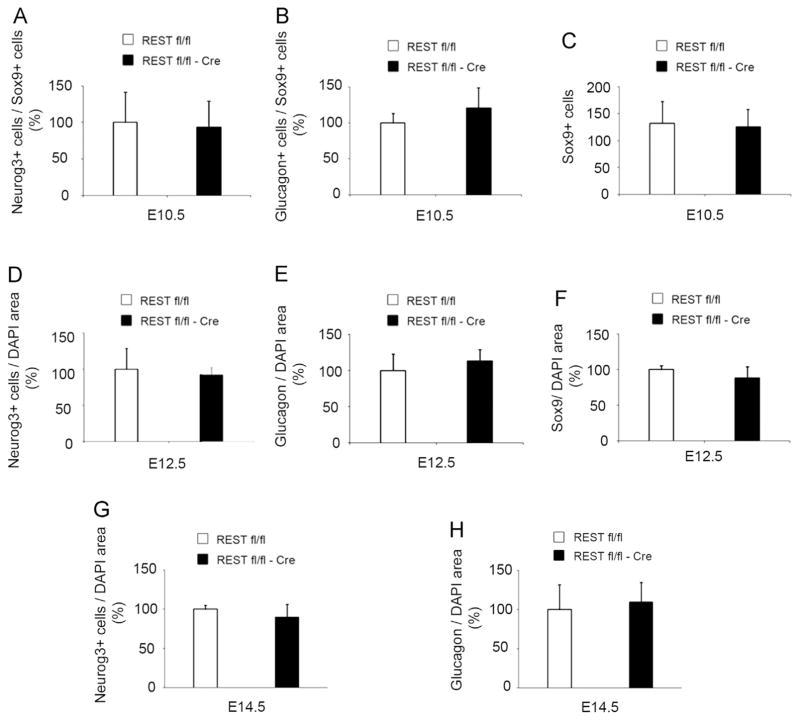
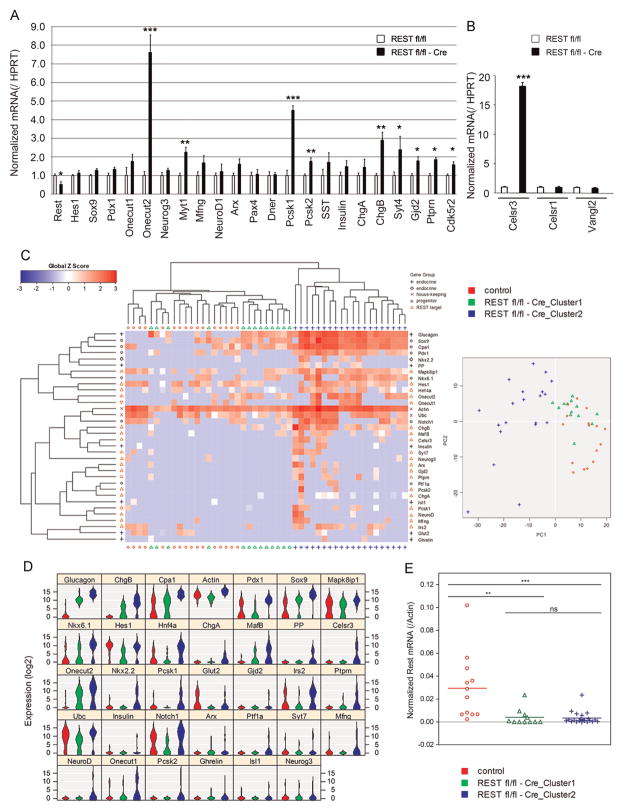
To contribute to devise successful beta-cell differentiation strategies for the cure of Type 1 diabetes we sought to uncover barriers that restrict endocrine fate acquisition by studying the role of the transcriptional repressor REST in the developing pancreas. Rest expression is prevented in neurons and in endocrine cells, which is necessary for their normal function. During development, REST represses a subset of genes in the neuronal differentiation program and Rest is down-regulated as neurons differentiate. Here, we investigate the role of REST in the differentiation of pancreatic endocrine cells, which are molecularly close to neurons. We show that Rest is widely expressed in pancreas progenitors and that it is down-regulated in differentiated endocrine cells. Sustained expression of REST in Pdx1(+) progenitors impairs the differentiation of endocrine-committed Neurog3(+) progenitors, decreases beta and alpha cell mass by E18.5, and triggers diabetes in adulthood. Conditional inactivation of Rest in Pdx1(+) progenitors is not sufficient to trigger endocrine differentiation but up-regulates a subset of differentiation genes. Our results show that the transcriptional repressor REST is active in pancreas progenitors where it gates the activation of part of the beta cell differentiation program.

Keywords: Beta cells; Diabetes; Islets; NRSF; Pancreas; Repressor.


Figures

Fig. 1
Fig. 1
Broad Rest expression in early pancreatic epithelium. (A) qPCR analysis shows declining levels of murine Rest transcripts in WT E11.5, 12.5, 13.5 and 14.5 pancreatic buds. Results are mean ± SD. Difference between groups were determined using non parametric one-way ANOVA test. *p < 0.05; **p < 0.01; ***p < 0.001. (B) Left: western blot experiment showing REST production in developing WT pancreas at E12.5, E14.5, and E18.5. Compared with total extracts from wild type INS-1E cells (WT) or INS-1E cells transduced with pcDNA encoding murine Rest (REST), REST antibody revealed a specific band around 200 kDa in total extracts from wild type E12.5, E14.5, and E18.5 pancreatic buds, while this band was absent in islets of Langerhans. Tubulin immunodetection was added as internal control. Right, the quantification of REST signal normalized to tubulin revealed that the levels of REST decreased during pancreas development. (C) Fluorescent in situ hybridization (ISH) for Rest transcript (red) was performed with sense (S) (upper panel) or antisense (AS) probe (middle and lower panels) on E14.5 WT pancreas. The inset shows cytoplasmic signal for Rest transcripts (lower panel). Co-immunostaining performed for Glucagon specifies a region devoid of Rest transcripts (green, upper and middle panel and lower panel, left picture) (red, lower panel, right picture) and staining for SOX9 delineates the domain of bipotent progenitors (green, lower panel, right picture). Blue staining is the DAPI labeling of nuclei. Scale bars, 50 μm.
Fig. 2
Fig. 2
Transgenic mice with conditional Rest transgene expression using a Tet-off system, driven by the endogenous Pdx1 promoter. (A) schematic organization of the construct used to generate the transgenic mice for tetracycline-controlled REST activation (TetO-REST mice). The XbaI fragment encompassing β-globin intron and human REST cDNA (Martin et al., 2008) was subcloned into XbaI sites of pUHD10-3. The XhoI/KasI fragment was used for oocytes injection. (B) qPCR analysis shows specific activation of human REST transgene in bigenic Pdx1-tTA/TetO-REST animals. Islets were isolated from adult Pdx1-tTA/TetO-REST (n = 3) from different lines of founders mice that have been treated with Doxycycline (Dox) in utero and during life. Islets were left in culture 24 h with (+) or without (−) Dox and tested for Dox-dependent transgene activation. The Tet-off system allows for REST transgene activation without Dox. The levels of transgene activation were compared to the levels achieved in RIP-REST transgenic mice. Results are mean ± SD. (C) Western blot analysis shows specific production of human REST in islets isolated from bigenic Pdx1-tTA/TetO-REST as compared to control TetO-REST animals. Islets were isolated from adult bigenic Pdx1-tTA/TetO-REST mice that have been treated with Dox in utero and during life. Islets were left 24 h in culture without Dox for REST transgene induction. Nuclear extracts from INS1-E or HeLa cells were used as negative and positive controls, respectively. (D) Immunolabelling for REST (green) and PDX1 (red) shows the pattern of expression of the human REST transgene in comparison with its driver, Pdx1. Staining were performed on E12.5 and E14.5 pancreas from bigenic Pdx1-tTA/TetO-REST mice grown without Dox. Insets show in higher magnification partial co-localization at both stage, demonstrating the mosaic expression of human REST, as compared with the driver, PDX1. Scale bars, 50 μm.
Fig. 3
Fig. 3
Quantification of endocrine progenitor and differentiated cell populations in bigenic Pdx1-tTA/TetO-REST. (A) NEUROG3+ cell number normalized to DAPI area was quantified in E14.5 pancreas from Pdx1-tTA control (n = 6) and bigenic Pdx1-tTA/TetO-REST (n = 8) mice grown without Dox. NEUROG3+ cell number is reduced in REST-overexpressing pancreas. *p < 0.05 versus values of control littermates. (B) SOX9+/DAPI area was quantified in E14.5 pancreas from Pdx1-tTA control (n = 6) and bigenic Pdx1-tTA/TetO-REST (n = 8) mice grown without Dox. (C) Insulin+/DAPI area was quantified in E14.5 and E18.5 pancreas from Pdx1-tTA control (n = 5) and bigenic Pdx1-tTA/TetO-REST (n = 5) mice grown without Dox. Insulin+ cell number is reduced in REST-overexpressing pancreas at E18.5. **p < 0.01 versus values of control littermates. (D) Glucagon+/DAPI area was quantified in E14.5 and E18.5 pancreas from Pdx1-tTA control (n = 5) and bigenic Pdx1-tTA/TetO-REST (n = 5) mice grown without Dox. Glucagon+ cell number is reduced in REST-overexpressing pancreas at E18.5. **p < 0.01 versus values of control littermates. (E) Amylase+/DAPI area was quantified in E18.5 pancreas from Pdx1-tTA control (n = 5) and bigenic Pdx1-tTA/TetO-REST (n = 5) mice grown without Dox. (F) Left, representative image of EdU (red), REST (green) and Insulin (white) staining in E18.5 pancreas from Pdx1-tTA control and bigenic Pdx1-tTA/TetO-REST. Arrows indicate proliferative Insulin+/EdU+ double positive cells. Scale bars, 25 μm. Right, quantification of the % of Insulin+/EdU+ in E18.5 pancreas from Pdx1-tTA control and bigenic Pdx1-tTA/TetO-REST.
Fig. 4
Fig. 4
Pdx1-tTA/TetO-REST adult mice are diabetic. (A) Representative immunostaining of pancreas from adult bigenic Pdx1-tTA/TetO-REST for PDX1 (red) and REST (green) (left panel) or Glucagon (red), REST (green) and insulin (white) (right panel). Left panel shows partial overlap of REST and PDX1 stainings, indicative of a mosaic expression of REST. Right panel shows Insulin+/REST+ double positive cells, while none of the glucagon+ cells are labeled for REST. Scale bars, 25 μm. (B) Blood glucose measurements in adult animals show hyperglycemia in bigenic Pdx1-tTA/TetO-REST (n = 6), as compared to Pdx1-tTA animals (n = 6). ***p < 0.001 versus values of control littermates.
Fig. 5
Fig. 5
Rest knock-out in multipotent progenitors does not alter pancreas differentiation. (A–H) Cell quantification in E10.5 (A–C), E12.5 (D–F) or E14.5 (G, H) pancreas from controls (REST Fl/Fl; n = 5) and Rest KO (REST Fl/Fl-Cre; n = 5). (A) NEUROG3+ cell number normalized to SOX9+ cell number. (B) Glucagon+ cell number normalized to SOX9+ cell number. (C) SOX9+ cell number. (D and G) NEUROG3+ cell number normalized to DAPI area. (E and H) Glucagon+ cell number normalized to DAPI area. (F) SOX9+ cell number normalized to DAPI area. There was no difference in cell populations at each stage.
Fig. 6
Fig. 6
Rest knock-out in multipotent progenitors relieves expression of key regulatory elements. (A) qPCR analysis on E12.5 pancreatic buds from controls (REST Fl/Fl; n = 5) and Rest KO (REST Fl/Fl-Cre; n = 5) embryos shows a decrease of 50% in the relative expression of Rest. We observed a relieved expression for several REST target genes, including Onecut2, Pcsk1, Myt1, Pcsk2, Chgb, Syt4, Gjd2, Ptprn, and Cdk5r2. Results are mean ± SD. *p < 0.05; **p < 0.01; ***p < 0.001. (B) qPCR analysis on E12.5 pancreatic buds from controls (n = 5) and Rest KO (n = 5) embryos shows a drastic increase in the levels of expression of Celsr3, but not of the other family member Celsr1 or Vangl2. Results are mean ± SD. ***p < 0.001. (C) Left, heatmap of unsupervised hierarchical clustering analysis of gene expression from single cells isolated from E12.5 pancreatic buds of control or Rest KO embryos. Each column represents a single cell from either genotype, for which qPCR analysis yielded clustering of different cell populations (control, REST Fl/Fl-Cre_Cluster 1 and 2), and rows represent clustering of the 34 genes analyzed, according to global Z score. REST Fl/Fl-Cre_Cluster 2 cells differ from control cells, as they express higher levels of endocrine and REST target genes. Right, PCA plot shows clustering of the REST Fl/Fl-Cre_Cluster 1 cells with control cells, while REST Fl/Fl-Cre_Cluster 2 cells differs from both control cells. (D) Violin plot of gene expression ranked according to the order of PCA gene score. REST Fl/Fl-Cre_Cluster 2 cells express higher levels of endocrine genes (including Glucagon, Nkx6.1, PP, and Nkx2.2), as well as REST target genes (including Chgb, Mapk8ip1, Hnf4a, Chga, Mafb, Celsr3, Onecut2, Pcsk1, Gjd2, Ptprn, Mfng, Neurod1, Onecut1 and Pcsk2). E. qPCR analysis of Rest mRNA from single cells used in panels C and D. While control cells express various levels of Rest, both REST Fl/Fl-Cre_Cluster 1 and 2 cells do not express Rest. Differences between groups were determined using non-parametric two-way Mann–Whitney test. **p < 0.01; ***p < 0.001; ns, not significant.

References

    1. Abrajano JJ, Qureshi IA, Gokhan S, Zheng D, Bergman A, Mehler MF. Differential deployment of REST and CoREST promotes glial subtype specification and oligodendrocyte lineage maturation. PloS One. 2009;4:e7665. - PMC - PubMed
    1. Andres ME, Burger C, Peral-Rubio MJ, Battaglioli E, Anderson ME, Grimes J, Dallman J, Ballas N, Mandel G. CoREST: a functional corepressor required for regulation of neural-specific gene expression. Proc Natl Acad Sci U S A. 1999;96:9873–9878. - PMC - PubMed
    1. Aoki H, Hara A, Era T, Kunisada T, Yamada Y. Genetic ablation of Rest leads to in vitro-specific derepression of neuronal genes during neurogenesis. Development. 2012;139:667–677. - PubMed
    1. Apelqvist A, Li H, Sommer L, Beatus P, Anderson DJ, Honjo T, Hrabe de Angelis M, Lendahl U, Edlund H. Notch signalling controls pancreatic cell differentiation. Nature. 1999;400:877–881. - PubMed
    1. Atouf F, Czernichow P, Scharfmann R. Expression of neuronal traits in pancreatic beta cells. Implication of neuron-restrictive silencing factor/re-pressor element silencing transcription factor, a neuron-restrictive silencer. J Biol Chem. 1997;272:1929–1934. - PubMed

Publication types

MeSH terms