. 2015 Jul 8;35(27):9848-71.
doi: 10.1523/JNEUROSCI.1575-14.2015.

The Anatomical and Functional Organization of the Human Visual Pulvinar

Affiliations

The Anatomical and Functional Organization of the Human Visual Pulvinar

Michael J Arcaro et al. J Neurosci. .

Abstract

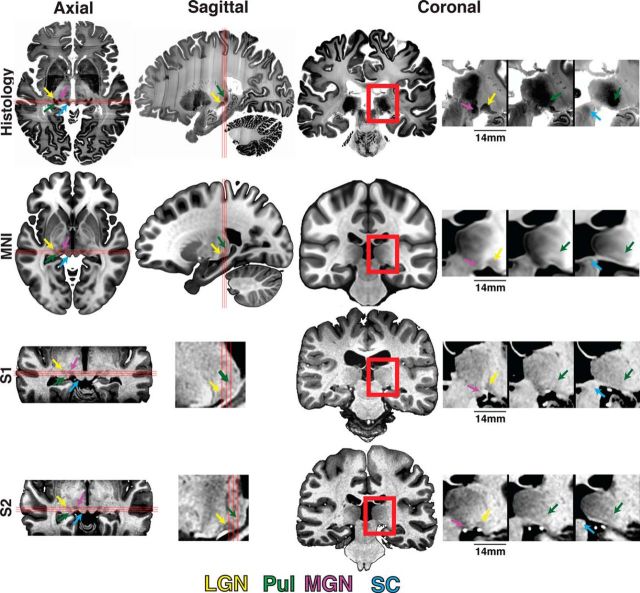
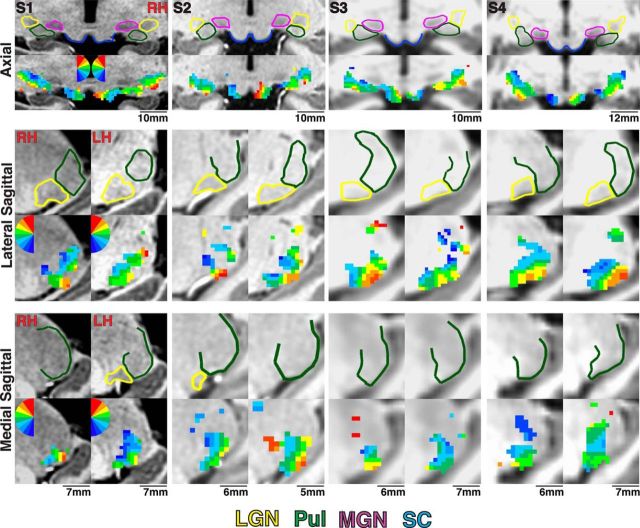
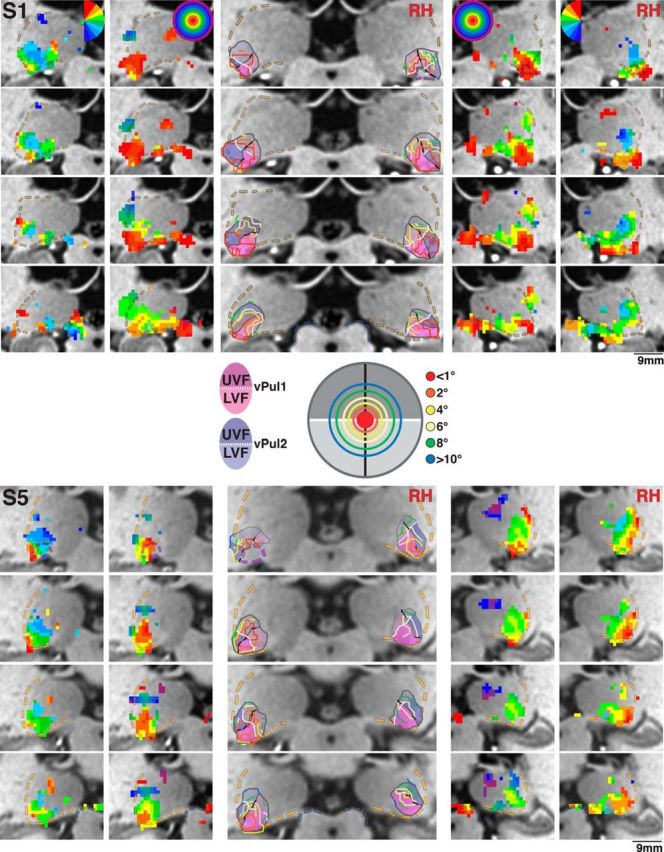
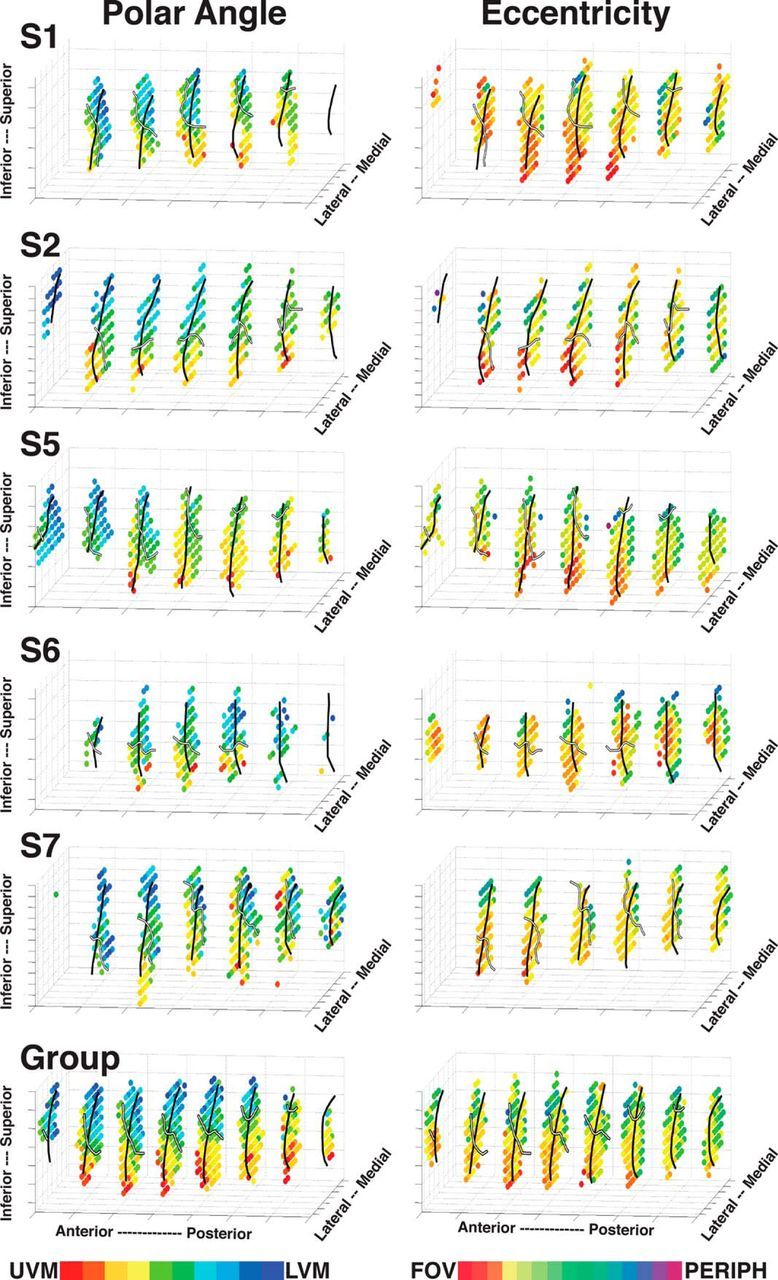
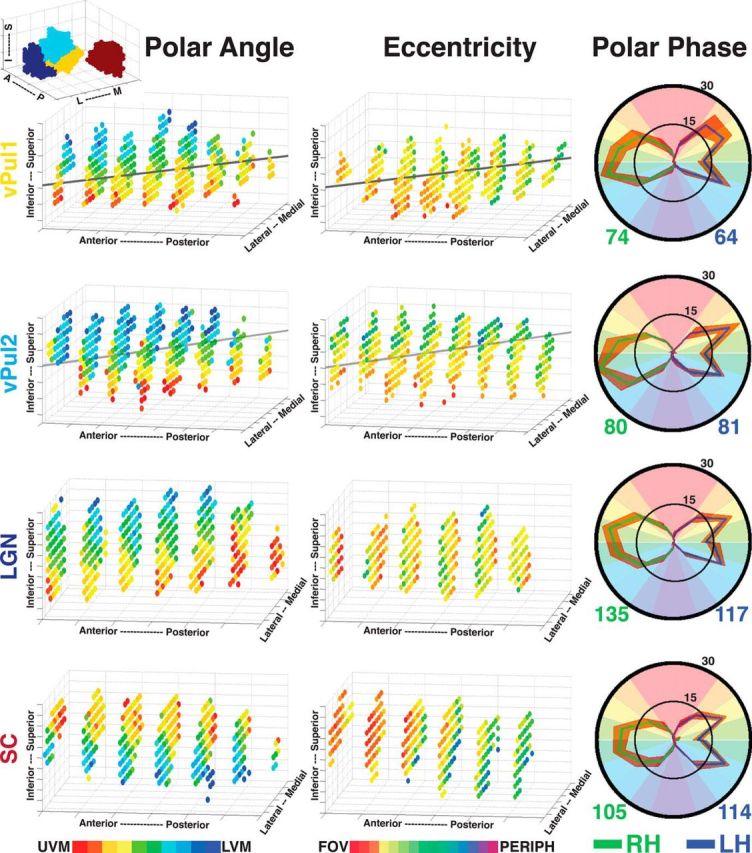
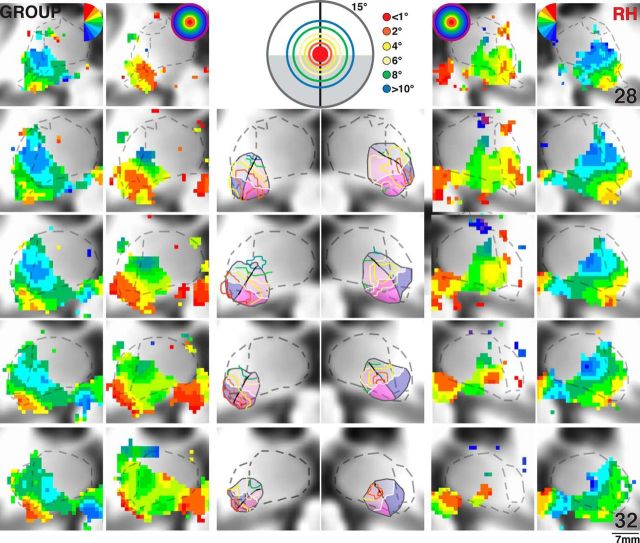
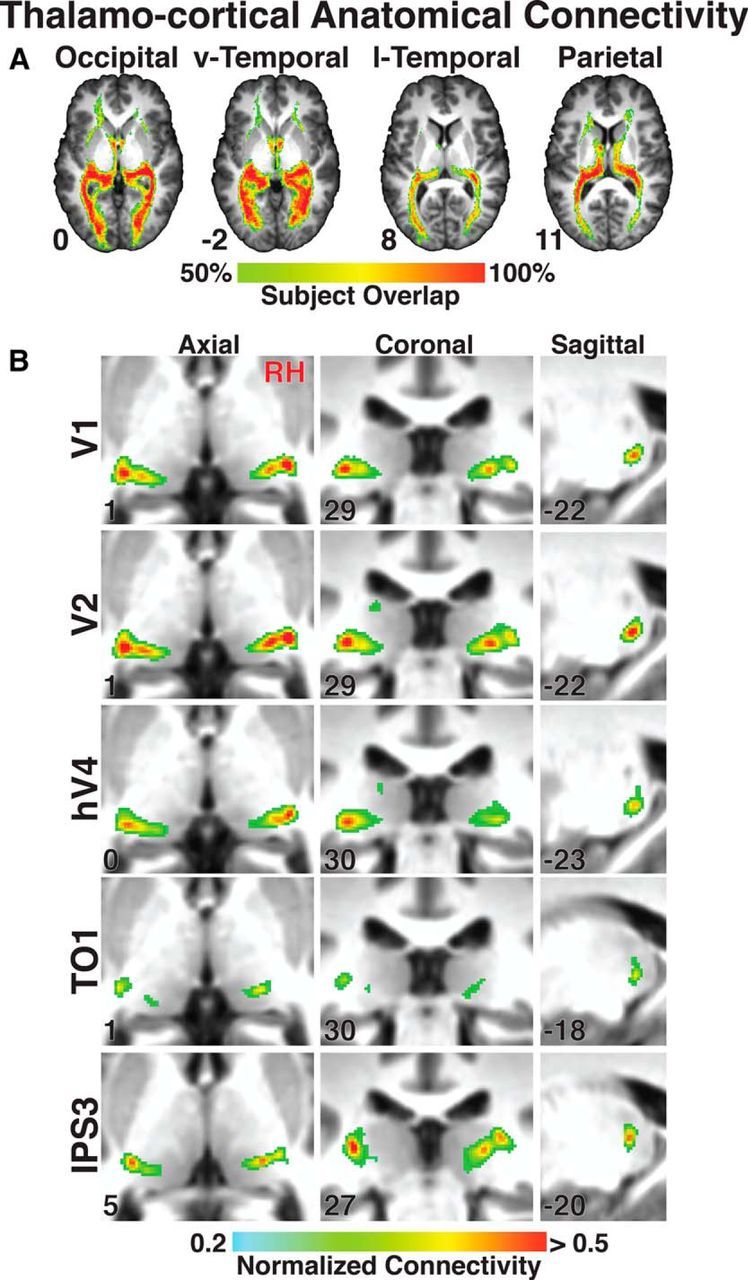
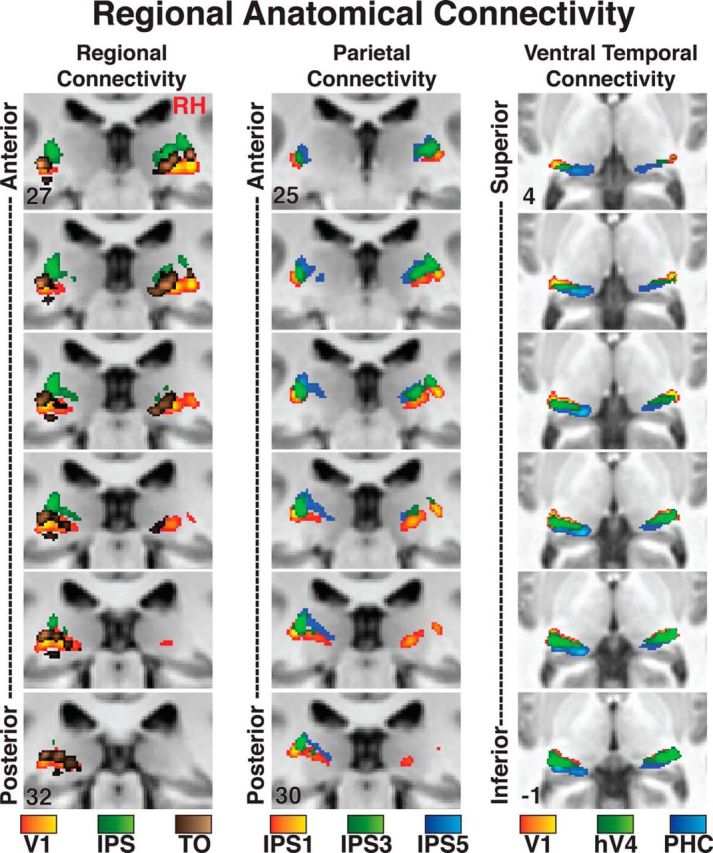
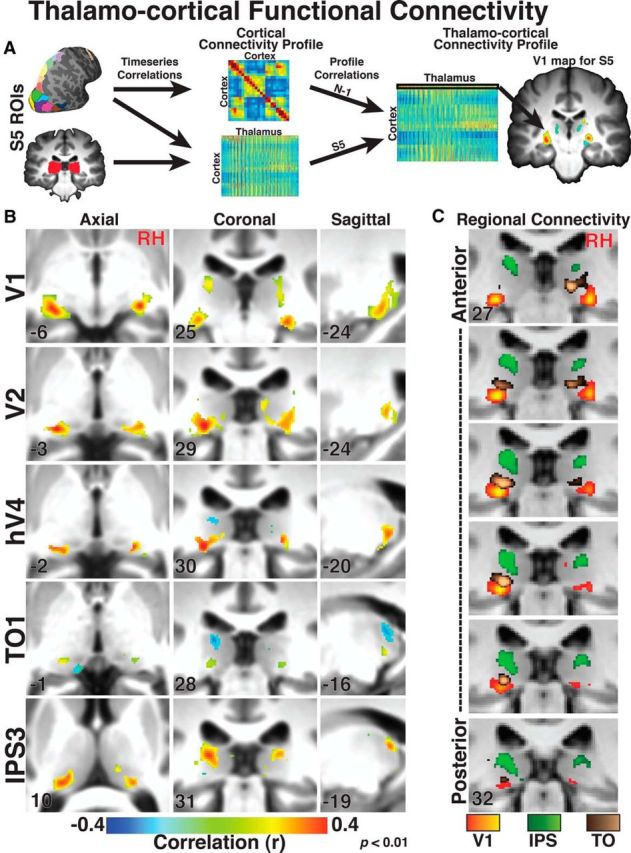
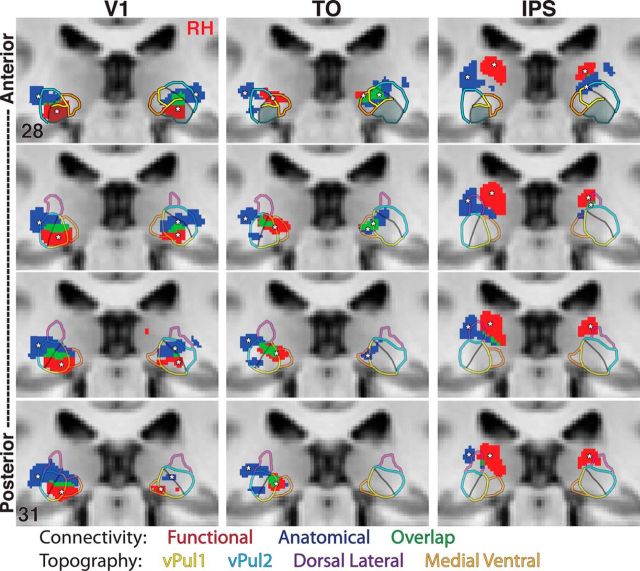
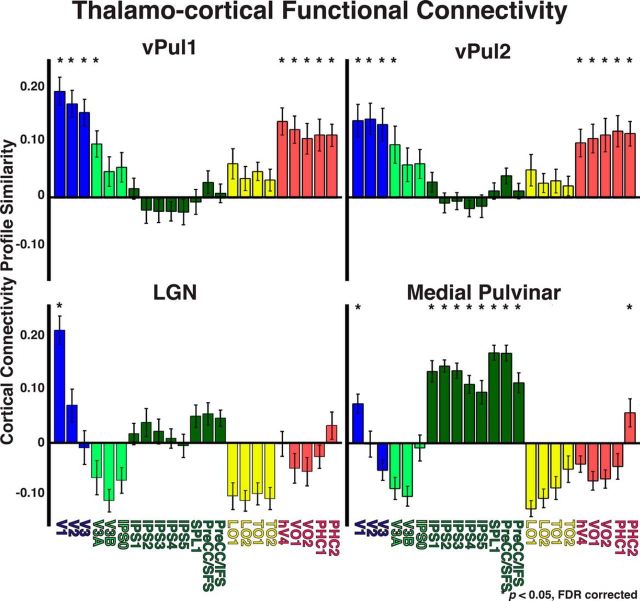
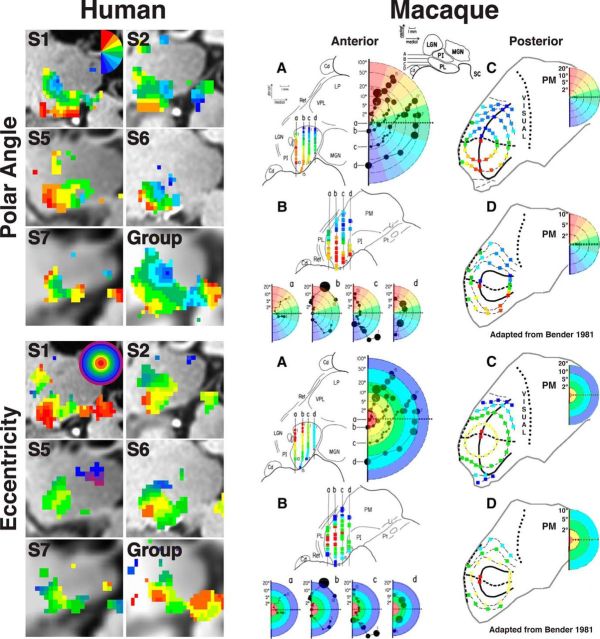
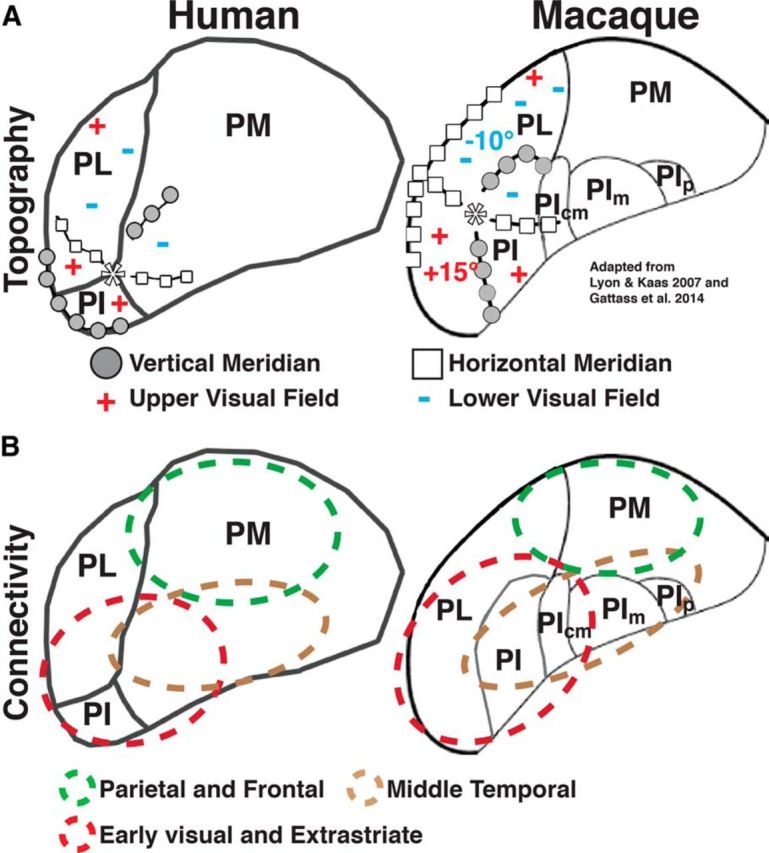
The pulvinar is the largest nucleus in the primate thalamus and contains extensive, reciprocal connections with visual cortex. Although the anatomical and functional organization of the pulvinar has been extensively studied in old and new world monkeys, little is known about the organization of the human pulvinar. Using high-resolution functional magnetic resonance imaging at 3 T, we identified two visual field maps within the ventral pulvinar, referred to as vPul1 and vPul2. Both maps contain an inversion of contralateral visual space with the upper visual field represented ventrally and the lower visual field represented dorsally. vPul1 and vPul2 border each other at the vertical meridian and share a representation of foveal space with iso-eccentricity lines extending across areal borders. Additional, coarse representations of contralateral visual space were identified within ventral medial and dorsal lateral portions of the pulvinar. Connectivity analyses on functional and diffusion imaging data revealed a strong distinction in thalamocortical connectivity between the dorsal and ventral pulvinar. The two maps in the ventral pulvinar were most strongly connected with early and extrastriate visual areas. Given the shared eccentricity representation and similarity in cortical connectivity, we propose that these two maps form a distinct visual field map cluster and perform related functions. The dorsal pulvinar was most strongly connected with parietal and frontal areas. The functional and anatomical organization observed within the human pulvinar was similar to the organization of the pulvinar in other primate species.

Significance statement: The anatomical organization and basic response properties of the visual pulvinar have been extensively studied in nonhuman primates. Yet, relatively little is known about the functional and anatomical organization of the human pulvinar. Using neuroimaging, we found multiple representations of visual space within the ventral human pulvinar and extensive topographically organized connectivity with visual cortex. This organization is similar to other nonhuman primates and provides additional support that the general organization of the pulvinar is consistent across the primate phylogenetic tree. These results suggest that the human pulvinar, like other primates, is well positioned to regulate corticocortical communication.

Keywords: DTI; connectivity; fMRI; pulvinar; retinotopy; visual.


Figures

Figure 1.
Figure 1.
Anatomical localization of human subcortical structures. The anatomical location of the (ventral) pulvinar, LGN, MGN, and SC is marked by green, yellow, magenta, and blue arrows, respectively, for histology (top), MNI space (second row), and Subjects S1 and S2 (bottom two rows) in axial, sagittal, and coronal views (left to right). Red box in the full coronal image represents the coverage of the three zoomed-in coronal views presented in consecutive 1 mm spaced (anterior-most is on the left). Three red lines in axial and sagittal views indicate the location of the three coronal views.
Figure 2.
Figure 2.
Visuotopic representations within the anatomical extent of subcortical structures. The anatomical extent of the pulvinar, LGN, MGN, and SC is outlined in green, yellow, magenta, and blue, respectively, for Subjects S1–S4 in axial and two sagittal orientations. Below the anatomical segmentations, polar angle maps are presented in corresponding slices. The color code represents the phase of the fMRI response and indicates the region of the contralateral visual field to which the voxel responds best. The color code is mirror symmetrical between hemispheres, and ipsilateral representations are not color coded.
Figure 3.
Figure 3.
Polar angle and eccentricity maps of the human pulvinar for Subjects S1 and S5. Series of coronal views of polar angle (outer columns) and eccentricity (intermediate columns) phase maps presented anterior (top) to posterior (bottom) in 1 mm spacing for right and left hemispheres. Transparent yellow and blue dashed lines indicate the lateral border of the pulvinar and the superior border of the SC, respectively. Transparent purple dashed lines in the anterior-most slice of S1 (right hemisphere) and S5 (left hemisphere) indicate the posterior anatomical extent of the LGN. Color code conventions are the same as Figure 2. Centrally presented images illustrate the color code of iso-eccentricity contours along 1°, 2°, 4°, 6°, 8°, and 10°. Transparent shading in centrally presented anatomical slices represents the extent of vPul1 (blue) and vPul2 (red) and their UVF (dark shading) and LVF (light shading) representations. White line indicates the HM.
Figure 4.
Figure 4.
Three-dimensional (3D) plots of visual field representations within the ventral pulvinar. Polar angle (left) and eccentricity (right) phase maps are plotted for Subjects S1, S2, and S5–S7 and a group average (data collapsed across hemispheres). The data are not in a standardized space, and the spatial coordinates are arbitrary. Color code conventions are the same as in Figures 2 and 3, with the exception that ipsilateral representations are color coded black. Black solid line drawn on the individual subject and group average plots indicates the border between vPul1 and vPul2. White solid line indicates the HM.
Figure 5.
Figure 5.
Visual field representations in areas vPul1, vPul2, LGN, and SC. Group average 3D polar angle (left) and eccentricity (middle) maps are plotted for vPul1, vPul2, LGN, and SC. Transparent gray line indicates the AIR for vPul1 and vPul2. Top left 3D plot illustrates the relative locations of the LGN (dark blue), vPul1 (yellow), vPul2 (light blue), and SC (red). Polar phase plots (right) illustrate the distribution of polar angle representations for each subcortical area (thresholded at p < 0.05, uncorrected). The percentage of polar angle coverage (see Materials and Methods) within each area was calculated for subjects individually and then averaged. Solid green and blue lines indicate group averages from right and left hemispheres, respectively. Orange outline indicates the SEM variance. Numbers below each polar plot reflect the average volume in mm3 for each hemisphere.
Figure 6.
Figure 6.
Group average polar angle and eccentricity maps in the human pulvinar. Series of coronal views of group average polar angle (N = 9) and eccentricity (N = 5) phase maps presented in MNI coordinates. Borders of anatomically defined lateral, inferior, and medial pulvinar subdivisions are denoted by transparent black dashed lines in each image and are highlighted in centrally presented anatomical images (Morel et al., 1997; Krauth et al., 2010). An average subject anatomical image is used as the underlay for the phase maps. Centrally presented images illustrate color coded iso-eccentricity contours (for details, see Fig. 3). All other conventions are the same as in Figures 2 and 3.
Figure 7.
Figure 7.
Thalamocortical anatomical connectivity of the human pulvinar. A, Subject overlap percentage maps of thalamocortical tracts between the pulvinar and occipital, ventral temporal, lateral temporal-occipital, and parietal cortex. Slices are presented in MNI space with corresponding axial slice coordinates. B, Group average (N = 14) peak anatomical connectivity of V1, V2, hV4, TO1, and IPS3 within the pulvinar in axial, coronal, and sagittal orientations. A standard MNI brain is used as the underlay, and coordinates are inset in each image.
Figure 8.
Figure 8.
Regional thalamocortical anatomical connectivity of the human pulvinar. Relation of peak connectivity for V1, IPS, and TO in the pulvinar (left column). Relation of peak connectivity for IPS1, IPS3, and IPS5 in the dorsal pulvinar (center). Relation of the peak connectivity for V1, hV4, and PHC in the ventral pulvinar (right column). Coronal images are presented at 1 mm spacing. A standard MNI brain is used as the underlay, and coordinates are inset in the top and bottom images.
Figure 9.
Figure 9.
Thalamocortical functional connectivity in the human pulvinar. A, Diagram of functional connectivity analysis pipeline for an individual subject (for more details, see Materials and Methods). B, Group average (N = 13) peak functional connectivity within the pulvinar for V1, V2, hV4, TO1, and IPS3. C, Relation of peak connectivity for V1, IPS, and TO in the pulvinar. A standard MNI brain is used as the underlay, and coordinates are inset individual images.
Figure 10.
Figure 10.
Relation of anatomical and functional connectivity within the human pulvinar. Anatomical (dark blue) and functional (red) connectivity and their overlap (green) are shown in a series of coronal views for V1, TO, and IPS. *Mark peaks in connectivity. Outlines of topographic regions vPul1 (yellow), vPul2 (light blue), ventral medial pulvinar (orange), and dorsal lateral pulvinar (purple) are overlaid. Solid black lines indicate the boundary between vPul1 and vPul2. A standard MNI brain is used as the underlay, and coordinates are inset in the top and bottom images.
Figure 11.
Figure 11.
Thalamocortical functional connectivity for vPul1, vPul2, LGN, and medial pulvinar. Functional connectivity between 23 cortical areas and vPul1, vPul2, and LGN as well as anatomically defined medial pulvinar. Cortical regions are color coded based on anatomical regions: occipital cortex (blue), dorsal extrastriate (light green), parietal and frontal cortices (dark green), lateral temporal-occipital cortices (yellow), and ventral temporal cortex (red). *p < 0.05 (FDR-corrected, one-sample t tests).
Figure 12.
Figure 12.
Comparison of the topographic organization within the ventral pulvinar between humans and macaques. Comparison of fMRI-defined polar angle (top half) and eccentricity (bottom half) representations within the human ventral pulvinar (left side) with electrophysiologically defined topographic organization of the macaque pulvinar (right side). Adapted from Bender (1981). The macaque coronal images show visual field coverage from electrode penetrations spanning anterior (A) to posterior (D) slices of the pulvinar. See axial slice inset for relative anterior/posterior positions of each coronal slice. Coronal images A and B illustrate the retinotopic organization of the inferior pulvinar and the anterior half of the lateral pulvinar. Coronal images C and D illustrate the retinotopic organization of the posterior half of the lateral pulvinar. Color code conventions are the same as Figure 2 and are matched between species.
Figure 13.
Figure 13.
Schematic of the topographic organization and cortical connectivity of the pulvinar between humans and macaque. A, Schematic of the visual field organization in the pulvinar in humans and macaques. Adapted from Kaas and Lyon (2007) and Gattass et al. (2014). Inferior, lateral, and medial subdivisions in the human pulvinar were adapted from Morel et al. (1997). Because of the significant underrepresentation of the vertical meridian in our fMRI data, portions of the border between vPUL1/2 were inferred at points closest to the vertical meridian that corresponded to reversals in phase progression along iso-eccentricity contours. *Mark foveal representations. Shaded circles represent the vertical meridian. White boxes represent the horizontal meridian. +, Upper visual field; −, lower visual field. B, Schematic of regional cortical connectivity patterns in the pulvinar in humans and macaques. Red dashed lines indicate early visual and extrastriate connectivity. Brown dashed lines indicate middle temporal (lateral occipital/temporal in humans) connectivity. Green dashed lines indicate parietal and frontal connectivity. The anterior to posterior gradient of anatomical connections from early visual to ventral temporal cortex is not illustrated in this figure.

References

    1. Adams MM, Hof PR, Gattass R, Webster MJ, Ungerleider LG. Visual cortical projections and chemoarchitecture of macaque monkey pulvinar. J Comp Neurol. 2000;419:377–393. doi: 10.1002/(SICI)1096-9861(20000410)419:3<377::AID-CNE9>3.0.CO%3B2-E. - DOI - PubMed
    1. Amano K, Wandell BA, Dumoulin SO. Visual field maps, population receptive field sizes, and visual field coverage in the human MT+ complex. J Neurophysiol. 2009;102:2704–2718. doi: 10.1152/jn.00102.2009. - DOI - PMC - PubMed
    1. Amunts K, Lepage C, Borgeat L, Mohlberg H, Dickscheid T, Rousseau MÉ, Bludau S, Bazin PL, Lewis LB, Oros-Peusquens AM, Shah NJ, Lippert T, Zilles K, Evans AC. BigBrain: an ultrahigh-resolution 3D human brain model. Science. 2013;340:1472–1475. doi: 10.1126/science.1235381. - DOI - PubMed
    1. Andrews TJ, Halpern SD, Purves D. Correlated size variations in human visual cortex, lateral geniculate nucleus, and optic tract. J Neurosci. 1997;17:2859–2868. - PMC - PubMed
    1. Arcaro MJ, McMains SA, Singer BD, Kastner S. Retinotopic organization of human ventral visual cortex. J Neurosci. 2009;29:10638–10652. doi: 10.1523/JNEUROSCI.2807-09.2009. - DOI - PMC - PubMed

Publication types

MeSH terms

LinkOut - more resources