Review
. 2015 Oct 15;24(R1):R111-9.
doi: 10.1093/hmg/ddv260. Epub 2015 Jul 8.

Strategies for fine-mapping complex traits

Affiliations
Review

Strategies for fine-mapping complex traits

Sarah L Spain et al. Hum Mol Genet. .

Abstract

Genome-wide association studies (GWAS) have identified thousands of robust and replicable genetic associations for complex disease. However, the identification of the causal variants that underlie these associations has been more difficult. This problem of fine-mapping association signals predates GWAS, but the last few years have seen a surge of studies aimed at pinpointing causal variants using both statistical evidence from large association data sets and functional annotations of genetic variants. Combining these two approaches can often determine not only the causal variant but also the target gene. Recent contributions include analyses of custom genotyping arrays, such as the Immunochip, statistical methods to identify credible sets of causal variants and the addition of functional genomic annotations for coding and non-coding variation to help prioritize variants and discern functional consequence and hence the biological basis of disease risk.


Figures

Figure 1.
Figure 1.
An overview of procedures for fine-mapping of GWAS loci.
Figure 2.
Figure 2.
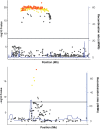
Illustration of conditional association analysis conditioning on the lead SNP, indicated by the orange circles (the SNP with the lowest P-value in the GWAS) using genotype level data for (A) one independent signal and (B) two independent signals. The top plots show the results of the association analysis and the bottom plots the result after conditioning on the lead SNP.
Figure 3.
Figure 3.
Fine-mapping from many variants in an associated region to a credible set of most likely causal variants. The plots illustrate the associated variants under two potential GWAS association peaks, with −log10 P-value plotted against the chromosome position. The grey lines indicate the position of genome-wide significance at 5 × 10⁻⁸, showing the number of variants that would be prioritized by P-value alone. The points plotted in yellow are the variants in high LD (r2) with the lead variant. The points coloured in orange are the variants included in the 95% credible set for the most likely causal variants.
Figure 4.
Figure 4.
Functional annotation schematic illustrating the annotation possibilities in the process of associated variant to target gene mapping. VEP, variant effect predictor; CADD, Combined Annotation-Dependent Depletion; TFBM, transcription factor binding motif.

References

    1. Visscher P.M., Brown M.A., McCarthy M.I., Yang J. (2012) Five years of GWAS discovery. Am. J. Hum. Genet., 90, 7–24. - PMC - PubMed
    1. Morris A.P. (2011) Transethnic meta-analysis of genomewide association studies. Genet. Epidemiol., 35, 809–822. - PMC - PubMed
    1. Howie B.N., Donnelly P., Marchini J. (2009) A flexible and accurate genotype imputation method for the next generation of genome-wide association studies. PLoS Genet., 5, e1000529. - PMC - PubMed
    1. Li Y., Willer C.J., Ding J., Scheet P., Abecasis G.R. (2010) MaCH: using sequence and genotype data to estimate haplotypes and unobserved genotypes. Genet. Epidemiol., 34, 816–834. - PMC - PubMed
    1. Browning S.R., Browning B.L. (2007) Rapid and accurate haplotype phasing and missing-data inference for whole-genome association studies by use of localized haplotype clustering. Am. J. Hum. Genet., 81, 1084–1097. - PMC - PubMed

Publication types