. 2015 Jul 8;7(295):295ra108.
doi: 10.1126/scitranslmed.aab1996.

Tmc gene therapy restores auditory function in deaf mice

Affiliations

Tmc gene therapy restores auditory function in deaf mice

Charles Askew et al. Sci Transl Med. .

Abstract

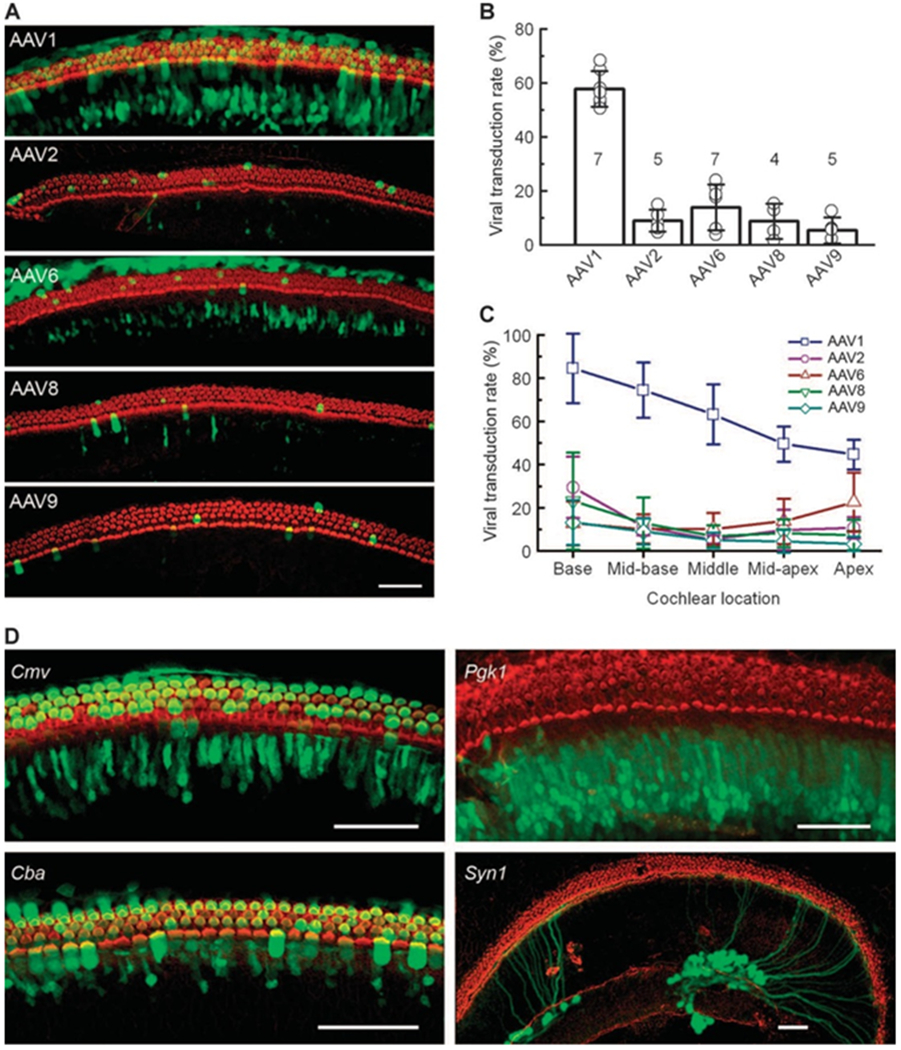
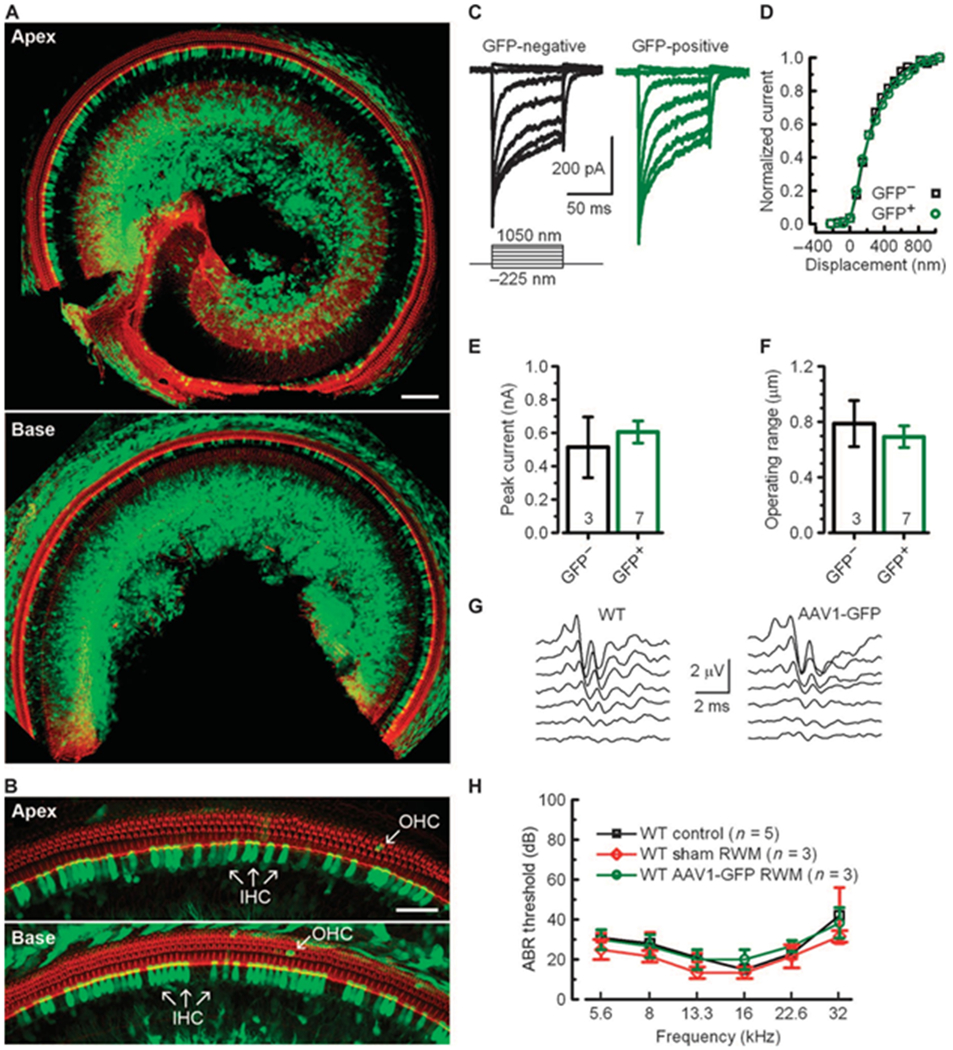
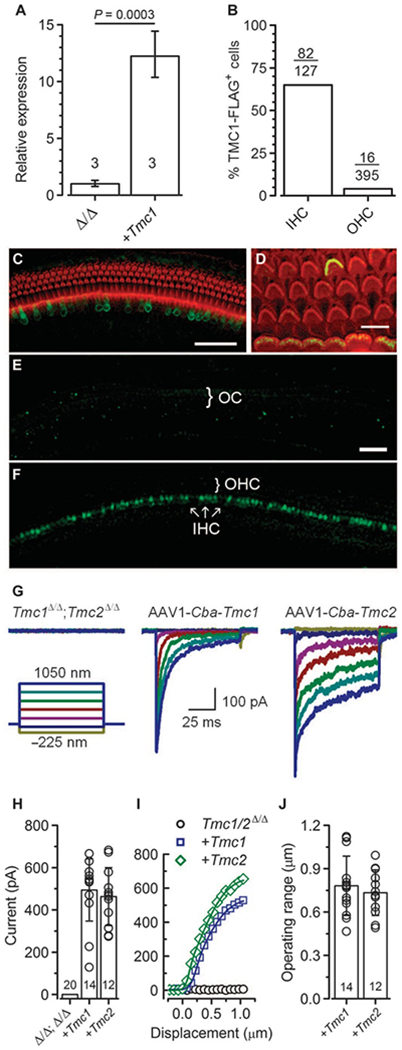
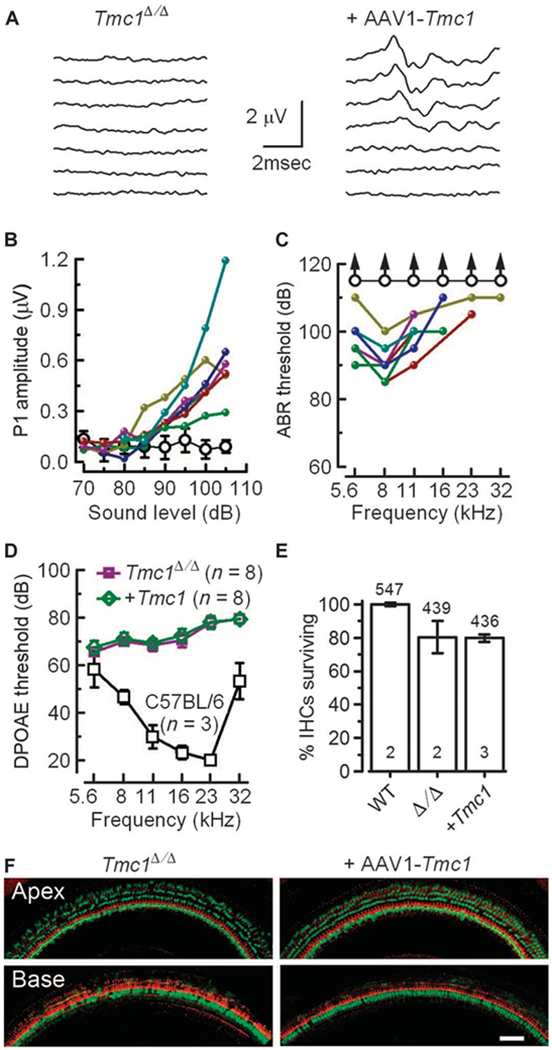
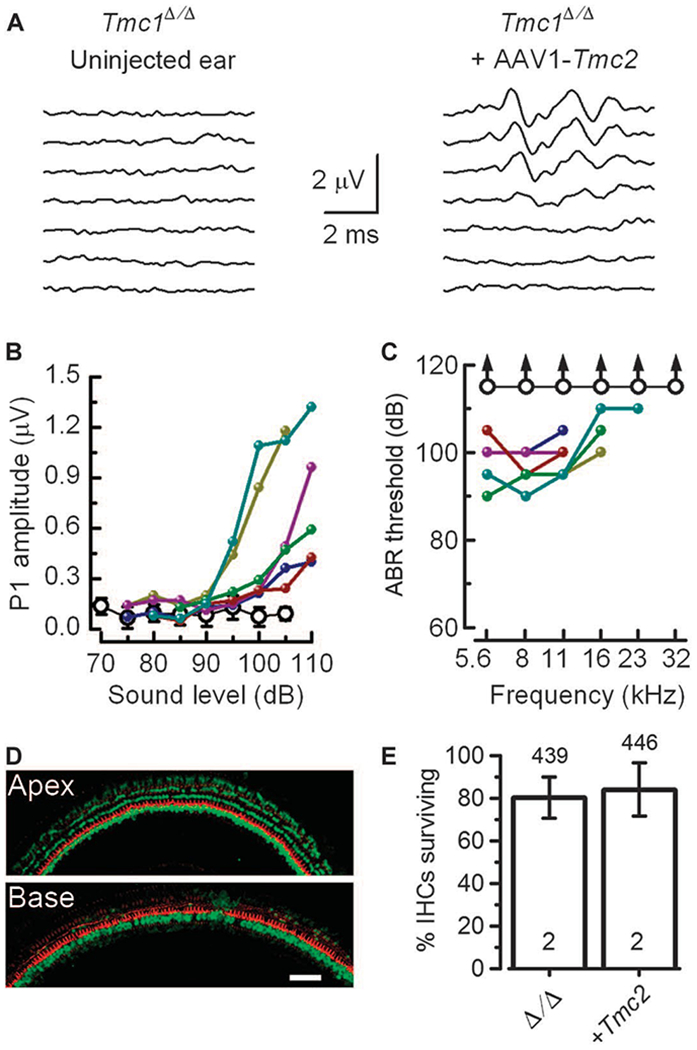
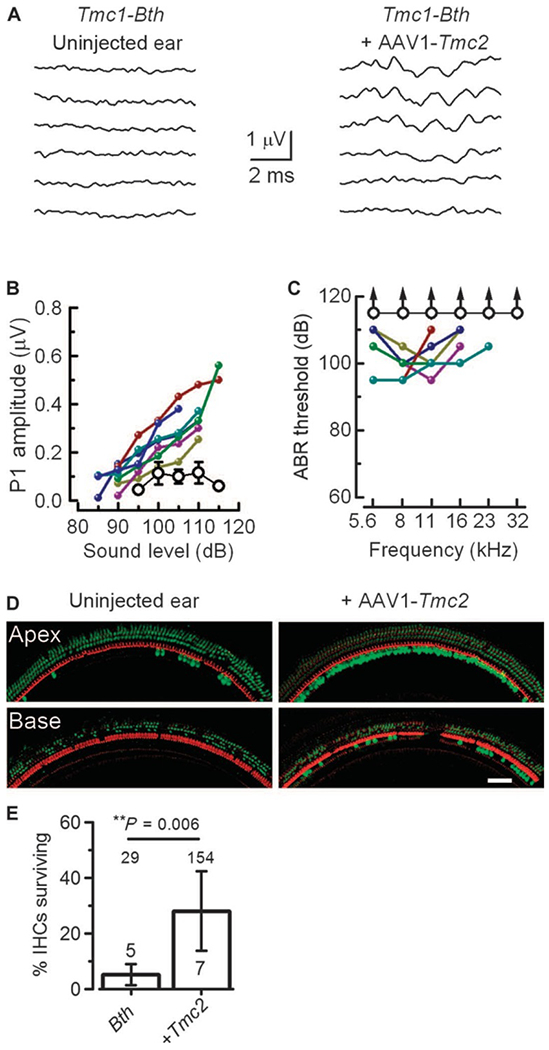
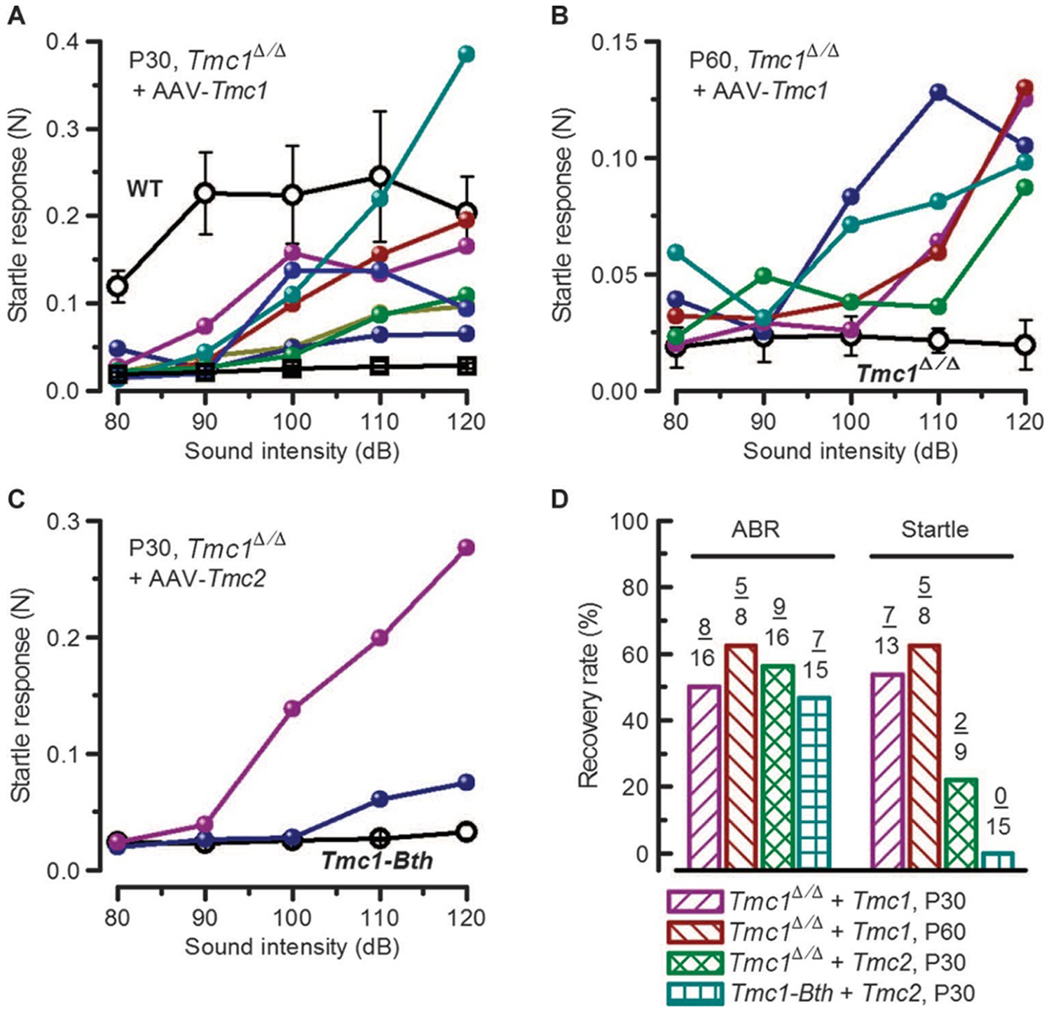
Genetic hearing loss accounts for up to 50% of prelingual deafness worldwide, yet there are no biologic treatments currently available. To investigate gene therapy as a potential biologic strategy for restoration of auditory function in patients with genetic hearing loss, we tested a gene augmentation approach in mouse models of genetic deafness. We focused on DFNB7/11 and DFNA36, which are autosomal recessive and dominant deafnesses, respectively, caused by mutations in transmembrane channel-like 1 (TMC1). Mice that carry targeted deletion of Tmc1 or a dominant Tmc1 point mutation, known as Beethoven, are good models for human DFNB7/11 and DFNA36. We screened several adeno-associated viral (AAV) serotypes and promoters and identified AAV2/1 and the chicken β-actin (Cba) promoter as an efficient combination for driving the expression of exogenous Tmc1 in inner hair cells in vivo. Exogenous Tmc1 or its closely related ortholog, Tmc2, were capable of restoring sensory transduction, auditory brainstem responses, and acoustic startle reflexes in otherwise deaf mice, suggesting that gene augmentation with Tmc1 or Tmc2 is well suited for further development as a strategy for restoration of auditory function in deaf patients who carry TMC1 mutations.


Conflict of interest statement

Competing interests: The authors declare that they have no competing interests.

Figures

Figure 1:
Figure 1:. Screen for AAV serotype and promoter in cochlear hair cells.
(A) Representative confocal images of the mid-base of cochlear cultures exposed to AAV-Cmv-eGFP with capsid serotypes indicated. Wild-type (WT) cochleas were dissected at P0 and exposed to viral concentrations of 3.3 × 10¹⁰ gc/ml (AAV2/1, AAV2/2, and AAV2/6) or 3.3 × 10¹¹ gc/ml (AAV2/8 and AAV2/9) for 24 hours. The tissue was cultured for 7 days, fixed, stained with Alexa 546–phalloidin (red) and imaged for GFP (green) on a Zeiss 700 confocal microscope. Projection images were generated from stacks of 20 to 40 optical sections collected at 1.2-mm intervals. Scale bar, 50 mm. (B) Viral transduction rates were determined from the number of eGFP-positive hair cells (green) in each cochlea divided by the total hair cells with Alexa 546-phalloidin-positive hair bundles. Data are means ± SD (n, number of cochleas). Symbols show transduction rates for each cochlea. (C) Viral transduction rates for all hair cells subdivided into five equal regions and plotted for the entire length of the tonotopic axis. Data are means ± SD [n as shown in (B)]. (D) Representative images of cochleas dissected from P0 WT mice, exposed to AAV2/1-eGFP vectors with promoters indicated (titers: 1 × 10¹¹ to 1 × 10¹² gc/ml). Scale bars, 50 mm.
Figure 2:
Figure 2:. In vivo injection of AAV2/1-Cba-eGFP through the RWM.
(A) Representative confocal images from the apex and base of a WT cochlea injected through the RWM with 1 ml of AAV2/1-Cba-eGFP (6 × 10¹² gc/ml) at P2, harvested at P9, and stained with Alexa 546–phalloidin (red) and imaged for GFP (green). Scale bar, 100 mm. (B) Apex and base from the same cochlea in (A) at higher magnification. Scale bar, 50 mm. (C) Families of sensory transduction currents evoked by mechanical displacement of IHC bundles from control (GFP-negative) cells and GFP-positive cells. Scale bars and displacement protocols are provided. (D) Stimulus-response curves for GFP-negative and GFP-positive cells revealed no difference in sensitivity. (E and F) Peak sensory transduction currents (E) and 10 to 90% operating range (F) from control and GFP-positive cells. Data are means ± SD (n, number of cells). (G) Families of ABR waveforms recorded at P25 from uninjected WT and AAV2/1-Cba-eGFP injected ears. The stimulus was an 8-kHz tone burst between 25 and 70 dB in 5-dB increments. (H) Auditory thresholds plotted as a function of stimulus frequency for uninjected WT mice, sham-injected WT mice, and AAV2/1-Cba-eGFP-injected mice. Data are means ± SD (n, number of mice).
Fig. 3.
Fig. 3.. Exogenous, AAV-delivered Tmc1/2 restores sensory transduction in Tmc-deficient hair cells in vivo.
P0 to P2 Tmc1D/D;Tmc2D/D mice were injected via the RWM with AAV2/1-Cba-Tmc1 (2.4 × 10¹³ gc/ml) or AAV2/1-Cba-Tmc2 (1.8 × 10¹³ gc/ml). Cochleas were harvested 6 to 7 days after injection. (A) Quantitative RT-PCR expression analysis of Tmc1 mRNA from total RNA harvested from two uninjected Tmc1D/D cochleas and two Tmc1D/D cochleas injected with AAV2/1-Cba-Tmc1 (n = 3 technical replicates). (B) Percent TMC1-FLAG-positive hair cells in AAV2/1-Cba-Tmc1-injected cochleas (n, number of FLAG-positive cells over total number of cells). (C) Confocal image of a cochlea injected with AAV2/1-Cba-Tmc1 and stained with Alexa 488 anti-FLAG antibody (green) and Alexa 546–phalloidin (red). Scale bar, 50 mm. (D) Projection from z-stack images of a WT cochlea injected with AAV6/1-Cba-Tmc2 showing FLAG staining at the tips of hair cell stereocilia. Scale bar, 5 mm. (E and F) FM1-43 uptake in Tmc1D/D;Tmc2D/D tissue not exposed to AAV2/1-Cba-Tmc vectors (control; E) or injected (F) with AAV2/1-Cba-Tmc1. OC, organ of Corti. Scale bar, 50 mm. (G) Representative families of sensory transduction currents recorded from IHCs of a Tmc1D/D;Tmc2D/D mouse injected with AAV2/1-Cba-Tmc1 that were FM1-43-negative (left) or FM1-43-positive (middle). FM1-43-positive IHC currents from a Tmc1D/D;Tmc2D/D mouse injected with AAV2/1-Cba-Tmc2 (right). (H) Peak sensory transduction current amplitudes from FM1-43-negative and FM1-43-positive IHCs of Tmc1D/D;Tmc2D/D mice injected with AAV2/1-Cba-Tmc1 or AAV2/1-Cba-Tmc2 as indicated. Bars are means ± SD. Circles are individual measurements (n, number of cells). (I) Stimulus-response curves from the currents shown in (G). (J) Ten to 90% operating range measured from stimulus-response curves in (I). Bars are means ± SD. Circles are individual measurements (n, number of cells).
Figure 4:
Figure 4:. Exogenous Tmc1 rescues auditory function in Tmc1D/D mice.
(A) Families of ABR waveforms recorded from an uninjected Tmc1D/D mouse and from a Tmc1D/D mouse injected with AAV2/1-Cba-Tmc1. ABRs were recorded at P25 to P30 using 8-kHz tone bursts at sound pressure levels between 75 and 105 dB in 5-dB increments. Scale bar applies to both families. (B) Peak 1 amplitudes measured from 8-kHz ABR waveforms, as shown in (A), for eight Tmc1D/D mice injected with AAV2/1-Cba-Tmc1 vectors. Open circles are mean responses (± SD) from uninjected Tmc1D/D mice (n = 8). (C) ABR thresholds plotted as a function of sound frequency for eight Tmc1D/D mice injected with AAV2/1-Cba-Tmc1 vectors. Open circles are means of uninjected Tmc1D/D mice at the highest sound intensity tested (arrows) (n = 8). (D) DPOAE thresholds as a function of stimulus frequency for WT, uninjected Tmc1D/D mice and Tmc1D/D mice injected with AAV2/1-Cba-Tmc1. Data are means ± SD (n, number of animals). (E) Percentage of surviving IHCs (relative to WT) in 5-mm mid-cochlea sections from Tmc1D/D mice and AAV2/1-Cba-Tmc1-injected mice (upper n, number of IHCs; lower n, number of cochlea). (F) Confocal images of cochlear whole mounts harvested at P30 from an uninjected Tmc1D/D mouse and a Tmc1D/D mouse injected with AAV2/1-Cba-Tmc1. The tissue was stained for MYO7A (green) and phalloidin (red). Scale bar, 50 mm. Figure S5 shows low-magnification images of the same cochleas.
Figure 5:
Figure 5:. Exogenous Tmc2 rescues auditory function in Tmc1D/D mice.
(A) Families of ABR waveforms recorded from a Tmc1D/D mouse injected with AAV2/1-Cba-Tmc2. ABRs were recorded at P25 to P30 using 8-kHz tone bursts at sound pressure levels between 75 and 105 dB in 5-dB increments. Scale bar applies to both families. (B) Peak 1 amplitudes measured from 8-kHz ABR waveforms, as shown in (A), for six Tmc1D/D mice injected with AAV2/ 1-Cba-Tmc2 vectors. Open circles are mean responses (±SD) from uninjected Tmc1D/D mice (n = 8). (C) ABR thresholds plotted as a function of sound frequency for six Tmc1D/D mice injected with AAV2/1-Cba-Tmc2 vectors. Open circles are means of uninjected Tmc1D/D mice at the highest sound intensity tested (arrows) (n = 8). (D) Confocal images of cochlear whole mounts harvested at P30 from a Tmc1D/D mouse injected with AAV2/1-Cba-Tmc2. The tissue was stained for MYO7A (green) and phalloidin (red). Scale bar, 50 mm. Figure S5 shows low-magnification images of the same cochleas. (E) Percentage of surviving IHCs in 5-mm mid-cochlea sections from Tmc1D/D mice and AAV2/1-Cba-Tmc2-injected mice (upper n, number of IHCs; lower n, number of cochleas).
Figure 6:
Figure 6:. Exogenous Tmc2 rescues au- ditory function in Tmc1-Bth mice.
(A) Families of ABR waveforms recorded from a Tmc1-Bth mouse and a Tmc1-Bth mouse injected with AAV2/1-Cba-Tmc2. ABRs were recorded at P25 to P30 using 8-kHz tone bursts at sound pressure levels between 80 and 110 dB in 5-dB increments. Scale bar applies to both families. (B) Peak 1 amplitudes measured from 8 kHz ABR waveforms, as shown in (A), for seven Tmc1-Bth mice injected with AAV2/1-Cba-Tmc2 vectors. Open circles are mean responses (±SD) from un- injected Tmc1-Bth mice (n = 5). (C) ABR thresholds plotted as a function of sound frequency for seven Tmc1-Bth mice injected with AAV2/1-Cba-Tmc2 vectors. Open circles are means of uninjected Tmc1-Bth mice at the highest sound intensity tested (arrows) (n = 5). (D) Confocal images of cochlear whole mounts harvested at P30 from an uninjected Tmc1-Bth mouse and a Tmc1- Bth mouse injected with AAV2/1-Cba-Tmc2. The tissue was stained for MYO7A (green) and phalloidin (red). Scale bar, 100 mm. Note the increased survival of IHCs in the apex and base of the AAV2/1-Cba-Tmc2 injected cochlea. Figure S6 shows low-magnification images of the same cochleas. (E) Percentage of surviving IHCs in Tmc1-Bth mice and AAV2/1-Cba-Tmc2– injected Bth mice (upper n, number of IHCs; lower n, number of cochleas).
Figure 7:
Figure 7:. Exogenous Tmc expression rescues acoustic startle responses in Tmc1 mutant mice.
(A) Startle response amplitudes measured at P30 and plotted as a function of sound intensity and as mean ± SD of four control C57BL/6 mice (open circles), seven individual Tmc1D/D mice injected with AAV2/1-Cba-Tmc1, and five AAV2/1-Cba-Tmc1–injected mice with no recovery (open squares). (B) Startle responses measured at P60 and plotted as mean ± SD of four Tmc1D/D mice (open circles) and five individual Tmc1D/D mice injected with AAV2/1-Cba-Tmc1. (C) Startle responses measured at P30, plotted for two individual Tmc1D/D mice injected with AAV2/1-Cba-Tmc2 and as mean ± SD of seven Tmc1-Bth mice (open circles) injected with AAV2/1-Cba-Tmc2. (D) Summary bar graph showing the percentage of Tmc1 mutant mice with recovery as assayed by ABRs and startle responses for mice injected with either AAV2/1-Cba-Tmc1 or AAV2/1-Cba-Tmc2. Numerator indicates n mice with recovery of function; denominator indicates n injected mice tested. Not all mice were tested with both assays.

Comment in

Similar articles

Cited by

References

    1. Géléoc GSG, Holt JR, Sound strategies for hearing restoration. Science 344, 1241062 (2014). - PMC - PubMed
    1. Kohrman DC, Raphael Y, Gene therapy for deafness. Gene Ther. 20, 1119–1123 (2013). - PMC - PubMed
    1. Kesser BW, Hashisaki GT, Fletcher K, Eppard H, Holt JR, An in vitro model system to study gene therapy in the human inner ear. Gene Ther. 14, 1121–1131 (2007). - PMC - PubMed
    1. Kesser BW, Hashisaki GT, Holt JR, Gene transfer in human vestibular epithelia and the prospects for inner ear gene therapy. Laryngoscope 118, 821–831 (2008). - PMC - PubMed
    1. Akil O, Seal RP, Burke K, Wang C, Alemi A, During M, Edwards RH, Lustig LR, Restoration of hearing in the VGLUT3 knockout mouse using virally mediated gene therapy. Neuron 75, 283–293 (2012). - PMC - PubMed

Publication types