

Sugar-induced cephalic-phase insulin release is mediated by a T1r2+T1r3-independent taste transduction pathway in mice
- PMID: 26157055
- PMCID: PMC4591378
- DOI: 10.1152/ajpregu.00056.2015
Sugar-induced cephalic-phase insulin release is mediated by a T1r2+T1r3-independent taste transduction pathway in mice
Abstract
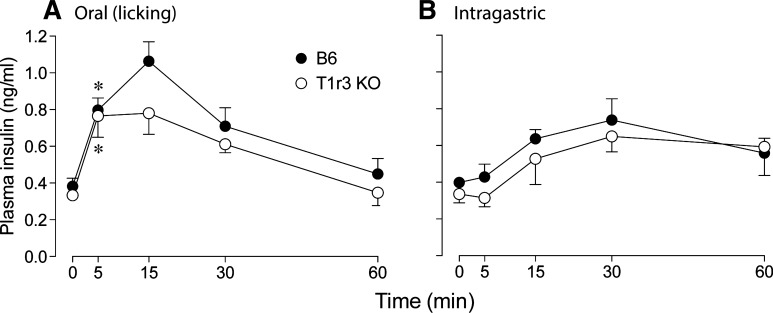
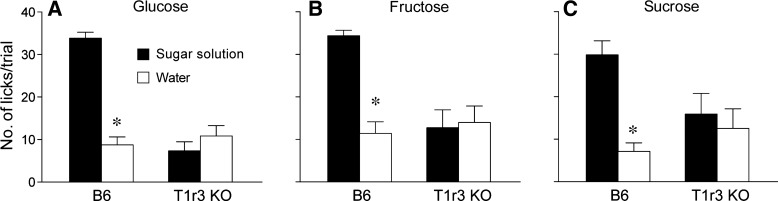
Sensory stimulation from foods elicits cephalic phase responses, which facilitate digestion and nutrient assimilation. One such response, cephalic-phase insulin release (CPIR), enhances glucose tolerance. Little is known about the chemosensory mechanisms that activate CPIR. We studied the contribution of the sweet taste receptor (T1r2+T1r3) to sugar-induced CPIR in C57BL/6 (B6) and T1r3 knockout (KO) mice. First, we measured insulin release and glucose tolerance following oral (i.e., normal ingestion) or intragastric (IG) administration of 2.8 M glucose. Both groups of mice exhibited a CPIR following oral but not IG administration, and this CPIR improved glucose tolerance. Second, we examined the specificity of CPIR. Both mouse groups exhibited a CPIR following oral administration of 1 M glucose and 1 M sucrose but not 1 M fructose or water alone. Third, we studied behavioral attraction to the same three sugar solutions in short-term acceptability tests. B6 mice licked more avidly for the sugar solutions than for water, whereas T1r3 KO mice licked no more for the sugar solutions than for water. Finally, we examined chorda tympani (CT) nerve responses to each of the sugars. Both mouse groups exhibited CT nerve responses to the sugars, although those of B6 mice were stronger. We propose that mice possess two taste transduction pathways for sugars. One mediates behavioral attraction to sugars and requires an intact T1r2+T1r3. The other mediates CPIR but does not require an intact T1r2+T1r3. If the latter taste transduction pathway exists in humans, it should provide opportunities for the development of new treatments for controlling blood sugar.
Keywords: T1r3; cephalic-phase insulin release; glucose tolerance; mice; sweet taste.
Copyright © 2015 the American Physiological Society.
Figures


Similar articles
-
Multiple sweet receptors and transduction pathways revealed in knockout mice by temperature dependence and gurmarin sensitivity.Am J Physiol Regul Integr Comp Physiol. 2009 Apr;296(4):R960-71. doi: 10.1152/ajpregu.91018.2008. Epub 2009 Feb 11. Am J Physiol Regul Integr Comp Physiol. 2009. PMID: 19211717 Free PMC article.
-
T1R3 taste receptor is critical for sucrose but not Polycose taste.Am J Physiol Regul Integr Comp Physiol. 2009 Apr;296(4):R866-76. doi: 10.1152/ajpregu.90870.2008. Epub 2008 Dec 17. Am J Physiol Regul Integr Comp Physiol. 2009. PMID: 19091911 Free PMC article.
-
Glucose elicits cephalic-phase insulin release in mice by activating KATP channels in taste cells.Am J Physiol Regul Integr Comp Physiol. 2017 Apr 1;312(4):R597-R610. doi: 10.1152/ajpregu.00433.2016. Epub 2017 Feb 1. Am J Physiol Regul Integr Comp Physiol. 2017. PMID: 28148491 Free PMC article.
-
An alternative pathway for sweet sensation: possible mechanisms and physiological relevance.Pflugers Arch. 2020 Dec;472(12):1667-1691. doi: 10.1007/s00424-020-02467-1. Epub 2020 Oct 8. Pflugers Arch. 2020. PMID: 33030576 Review.
-
Sweet taste receptor in the hypothalamus: a potential new player in glucose sensing in the hypothalamus.J Physiol Sci. 2017 Jul;67(4):459-465. doi: 10.1007/s12576-017-0535-y. Epub 2017 Apr 4. J Physiol Sci. 2017. PMID: 28378265 Free PMC article. Review.
Cited by
-
The Macronutrients, Appetite, and Energy Intake.Annu Rev Nutr. 2016 Jul 17;36:73-103. doi: 10.1146/annurev-nutr-121415-112624. Annu Rev Nutr. 2016. PMID: 27431364 Free PMC article. Review.
-
Neuroendocrine and Metabolic Effects of Low-Calorie and Non-Calorie Sweeteners.Front Endocrinol (Lausanne). 2020 Jul 16;11:444. doi: 10.3389/fendo.2020.00444. eCollection 2020. Front Endocrinol (Lausanne). 2020. PMID: 32765425 Free PMC article. Review.
-
Behavioral Evidence for More than One Taste Signaling Pathway for Sugars in Rats.J Neurosci. 2016 Jan 6;36(1):113-24. doi: 10.1523/JNEUROSCI.3356-15.2016. J Neurosci. 2016. PMID: 26740654 Free PMC article.
-
Selective increases in taste sensitivity to glucose as a function of hunger status.Appetite. 2025 Mar 1;207:107901. doi: 10.1016/j.appet.2025.107901. Epub 2025 Feb 9. Appetite. 2025. PMID: 39933656
-
Taste cell-expressed α-glucosidase enzymes contribute to gustatory responses to disaccharides.Proc Natl Acad Sci U S A. 2016 May 24;113(21):6035-40. doi: 10.1073/pnas.1520843113. Epub 2016 May 9. Proc Natl Acad Sci U S A. 2016. PMID: 27162343 Free PMC article.
References
-
- Abdallah L, Chabert M, Louis-Sylvestre J. Cephalic phase responses to sweet taste. Am J Clin Nutr 65: 737–743, 1997. - PubMed
-
- Andrikopoulos S, Blair AR, Deluca N, Fam BC, Proietto J. Evaluating the glucose tolerance test in mice. Am J Physiol Endocrinol Metab 295: E1323–E1332, 2008. - PubMed
-
- Berthoud HR, Bereiter DA, Trimble ER, Siegel EG, Jeanrenaud B. Cephalic phase, reflex insulin secretion: neuroanatomical and physiological characterization. Diabetologia 20: 393–401, 1981. - PubMed
Publication types
MeSH terms
Substances
Grants and funding
LinkOut - more resources
Full Text Sources
Other Literature Sources
Medical
Molecular Biology Databases
Research Materials