. 2015 Aug 15;195(4):1364-1367.
doi: 10.4049/jimmunol.1500904. Epub 2015 Jul 8.

Cutting Edge: Redox Signaling Hypersensitivity Distinguishes Human Germinal Center B Cells

Affiliations

Cutting Edge: Redox Signaling Hypersensitivity Distinguishes Human Germinal Center B Cells

Hannah G Polikowsky et al. J Immunol. .

Abstract

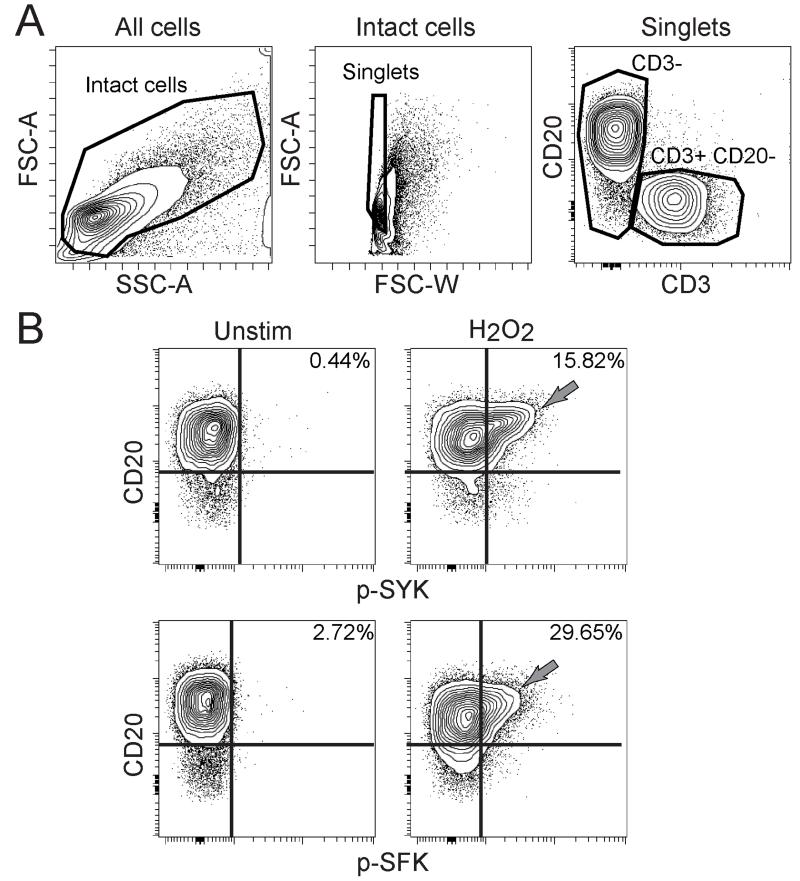
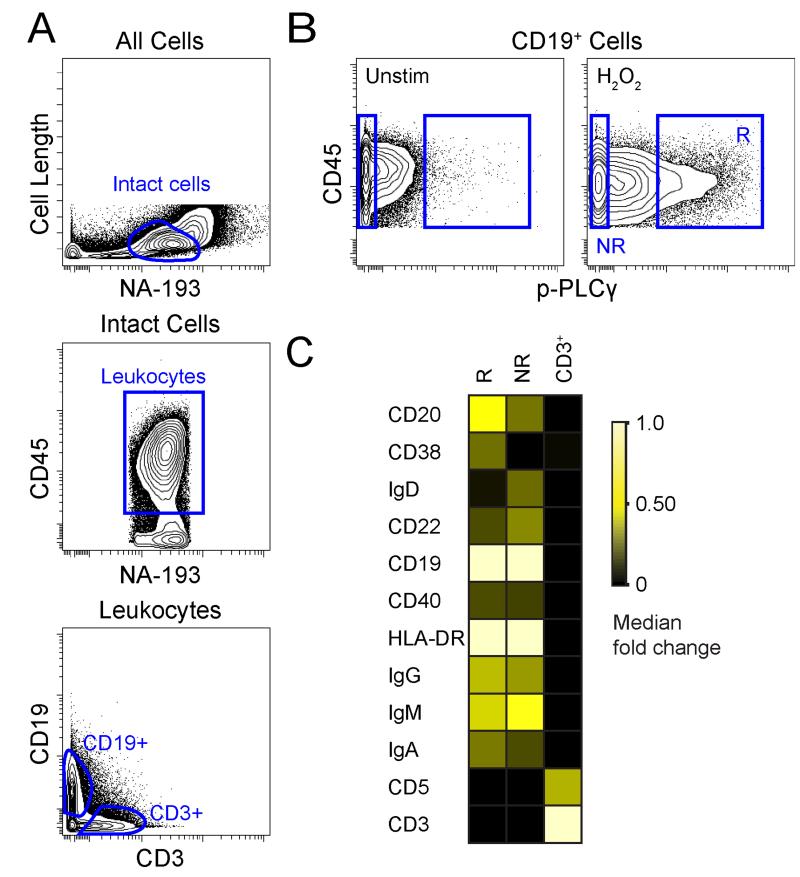
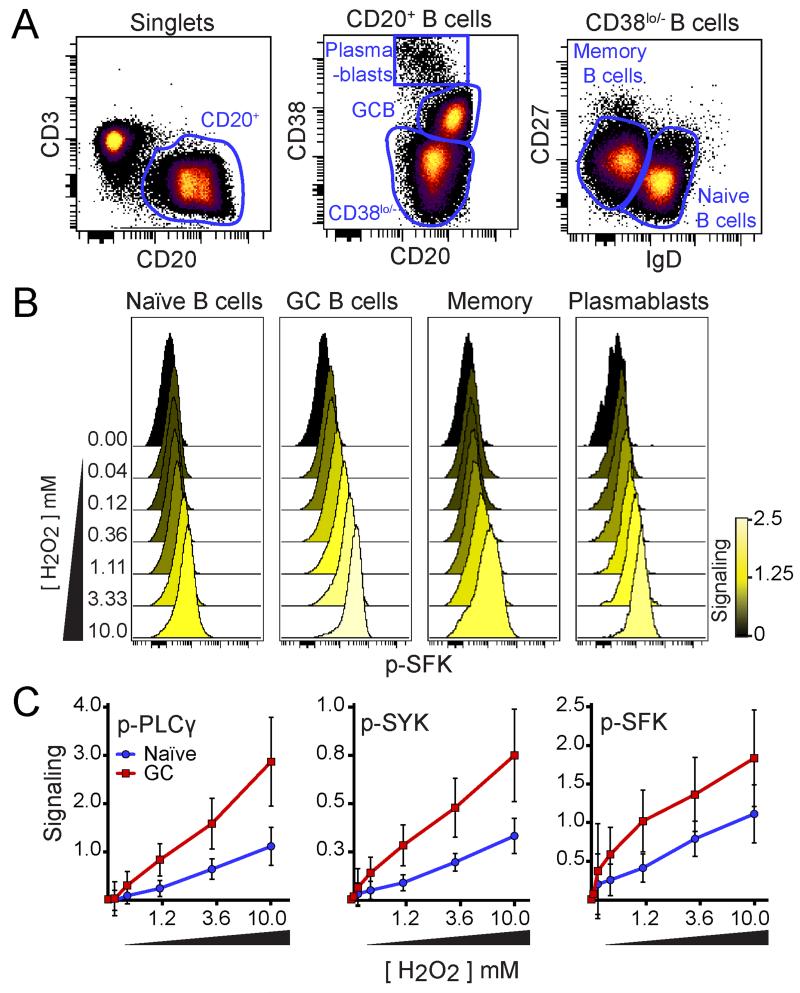
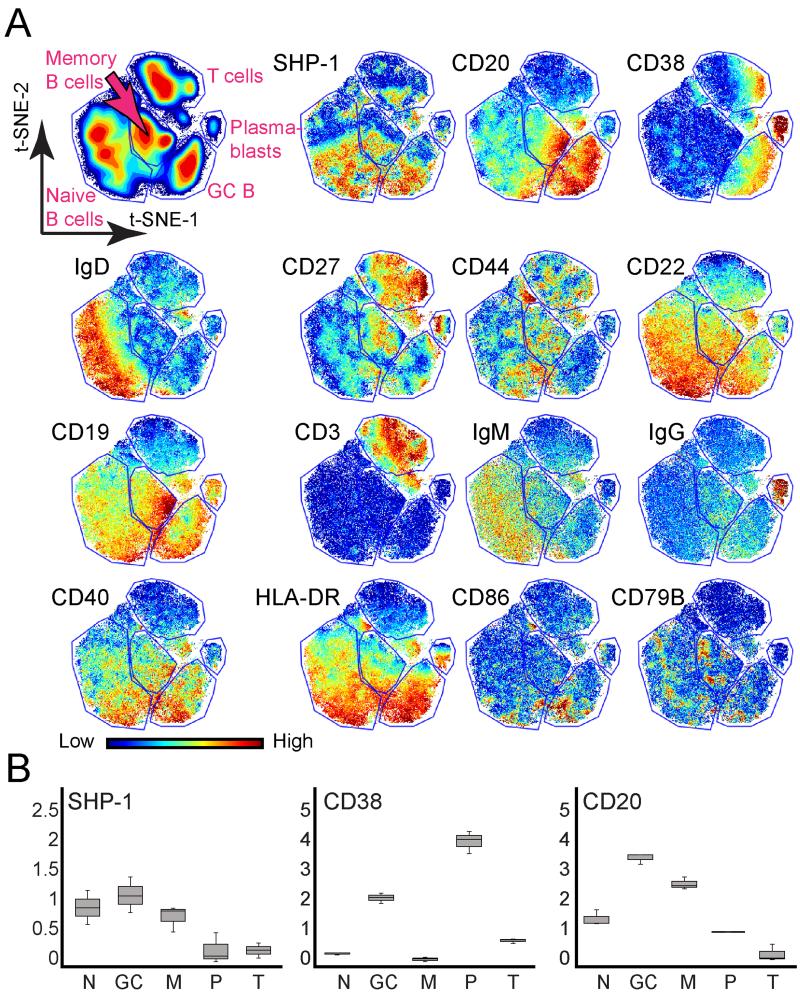
Differences in the quality of BCR signaling control key steps of B cell maturation and differentiation. Endogenously produced H2O2 is thought to fine tune the level of BCR signaling by reversibly inhibiting phosphatases. However, relatively little is known about how B cells at different stages sense and respond to such redox cues. In this study, we used phospho-specific flow cytometry and high-dimensional mass cytometry (CyTOF) to compare BCR signaling responses in mature human tonsillar B cells undergoing germinal center (GC) reactions. GC B cells, in contrast to mature naive B cells, memory B cells, and plasmablasts, were hypersensitive to a range of H2O2 concentrations and responded by phosphorylating SYK and other membrane-proximal BCR effectors in the absence of BCR engagement. These findings reveal that stage-specific redox responses distinguish human GC B cells.


Figures

Figure 1
Figure 1. CD20hi B cells in human tonsil were sensitive to H2O2
(A) Contour plots show gating for CD3 cells and CD3+ CD20 T cells in human tonsil. (B) Contour plots show phosphorylated SYK (p-SYK) and p-SFK in CD3 tonsillar B cells left unstimulated or stimulated by 3.3 mM H2O2 for 2 minutes. Sensitivity to H2O2 in a CD20hi B cell population is indicated (gray arrows). Plots are representative of three tonsils.
Figure 2
Figure 2. Mass Cytometry Revealed H2O2 ‘Responder’ Population as CD20hi, CD38+, and IgD
(A) Contour plots show gating for CD19+ B cells and CD3+ T cells in human tonsil. (B) Contour plots show p-PLCγ in CD19+ tonsil B cells left unstimulated or stimulated by 3.3 mM H2O2 for 4 minutes. Cells that were sensitive to H2O2 stimulation were labeled responder (R) cells and contrasted with non-responder cells (NR). (C) Heat map shows the median fold change CD20 and CD38 in CD3+ T cells, R, and NR subsets.
Figure 3
Figure 3. GC B cells were hypersensitive to H2O2
(A) Density dot plots show gating for identification of plasmablasts, GC B cells, memory B cells, and naïve B cells in human tonsils. (B) Histogram overlays show p-SFK in each B cell population (shown in A) following 2 minutes of 3.3 mM of H2O2 (n=3, representative data shown). Color denotes median fold change in p-SFK expression compared to unstimulated (0 mM of H2O2). (C) Plots illustrate the median fold change in p-PLCγ, p-SYK, and p-SRC in H2O2-stimulated conditions compared to the unstimulated condition (arcsinh scale). Each point represents the average of three individual tonsil specimens (n=3) stimulated for 2 minutes with the indicated concentration of H2O2, except for the 0.04 mM and 0.12 mM H2O2 stimulated conditions (where n=2). Red squares represent GC B cells and blue circles represent naïve B cells. Error bars denote the standard deviation for each point.
Figure 4
Figure 4. SHP-1 expression was heterogeneous within B cell populations
viSNE maps show CD45+ leukocytes arranged based on marker expression profiles (see gating in Fig. 2A). Color denotes protein expression, as indicated. (A) Gates were drawn around the main populations identified by viSNE, using protein expression to identify each population. CD19+ B cells were subdivided into naïve B cells (CD38CD27IgD+), GC B cells (CD20hiCD38+), memory B cells (CD38CD27+IgD), and plasmablasts (CD20CD38hi) and compared to CD3+ T cells. One representative tonsil of four analyzed is shown. (B) Box and Whisker plots illustrate expression of SHP-1, CD38, and CD20 proteins across three tonsil specimens for naïve B cells, GC=germinal center B cells, M=memory B cells, P=plasmablasts, and T= T cells. Median of each marker is indicated by a black line. Bars denote the minimum and maximum observed MFI of each marker.

References

    1. Reth M. Hydrogen Peroxide as a second messenger in lymphocyte activation. Nat Immunol. 2002:3. - PubMed
    1. Nathan C, Cunningham-Bussel A. Beyond oxidative stress: an immunologist’s guide to reactive oxygen species. Nature Reviews Immunology. 2013;13:349–361. - PMC - PubMed
    1. Maecker HT, McCoy JP, Nussenblatt R. Standardizing immunophenotyping for the Human Immunology Project. Nat Rev Immunol. 2012;12:191–200. - PMC - PubMed
    1. Victora GD, Schwickert TA, Fooksman DR, Kamphorst AO, Meyer-Hermann M, Dustin ML, Nussenzweig MC. Germinal center dynamics revealed by multiphoton microscopy with a photoactivatable fluorescent reporter. Cell. 2010;143:592–605. - PMC - PubMed
    1. Gitlin AD, Shulman Z, Nussenzweig MC. Clonal selection in the germinal centre by regulated proliferation and hypermutation. Nature. 2014;509:637–640. - PMC - PubMed

Publication types

MeSH terms

Substances