. 2015 Jul 8:4:719.
doi: 10.1038/bonekey.2015.88. eCollection 2015.

TGFβ-Mediated induction of SphK1 as a potential determinant in human MDA-MB-231 breast cancer cell bone metastasis

Affiliations

TGFβ-Mediated induction of SphK1 as a potential determinant in human MDA-MB-231 breast cancer cell bone metastasis

Keith R Stayrook et al. Bonekey Rep. .

Abstract

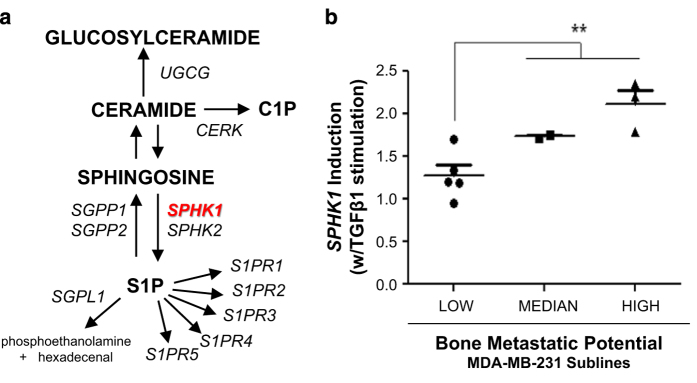
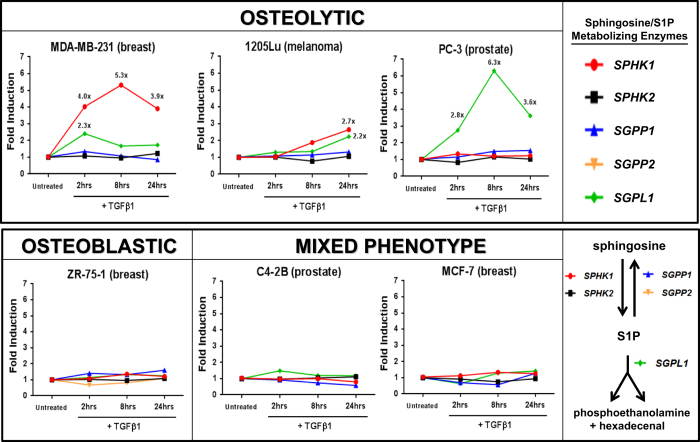
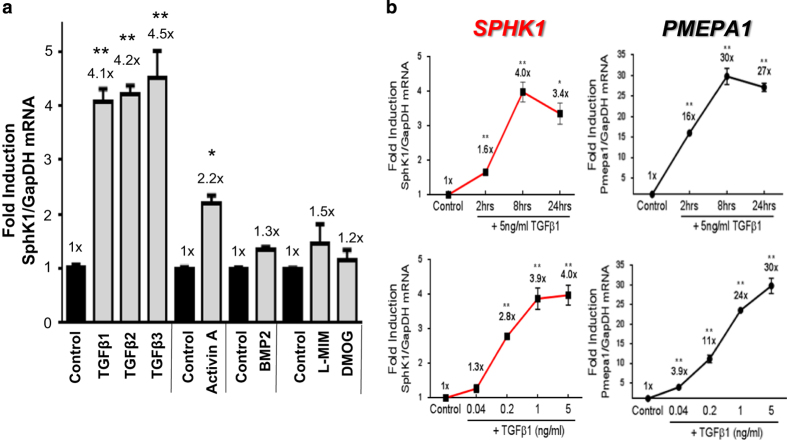
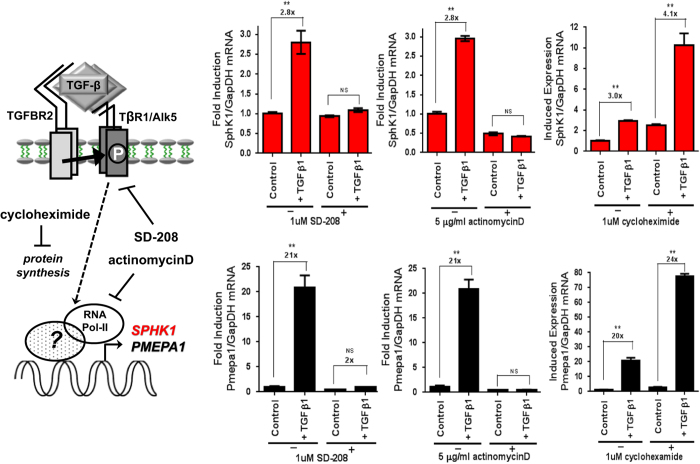
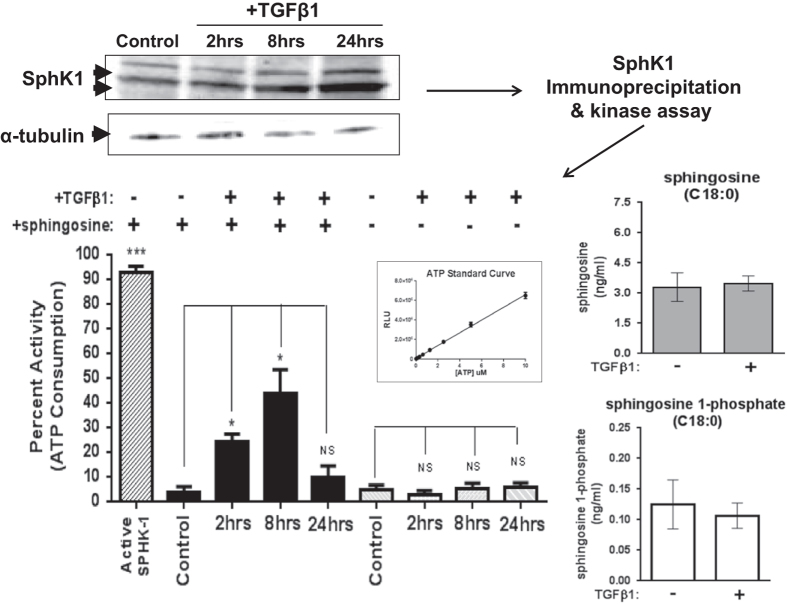
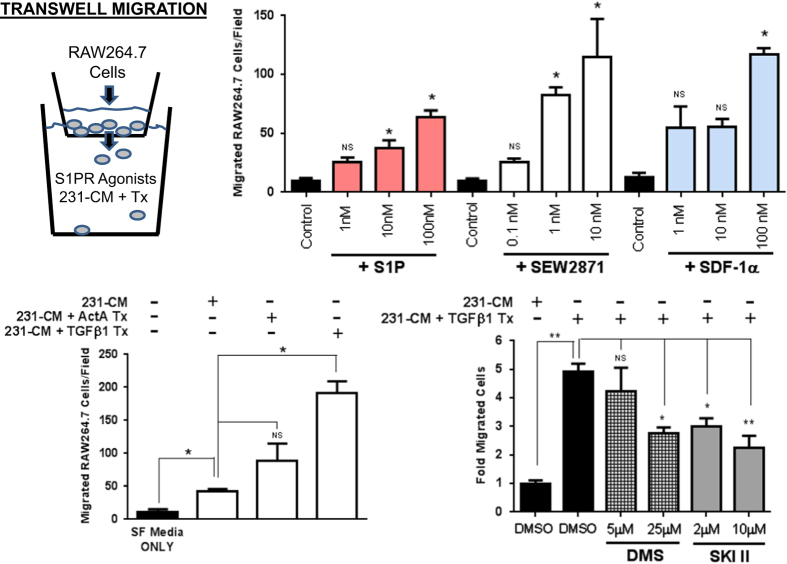
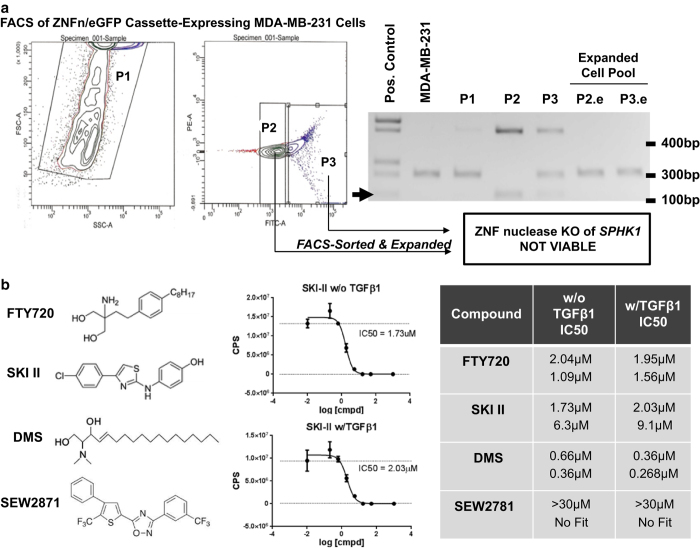
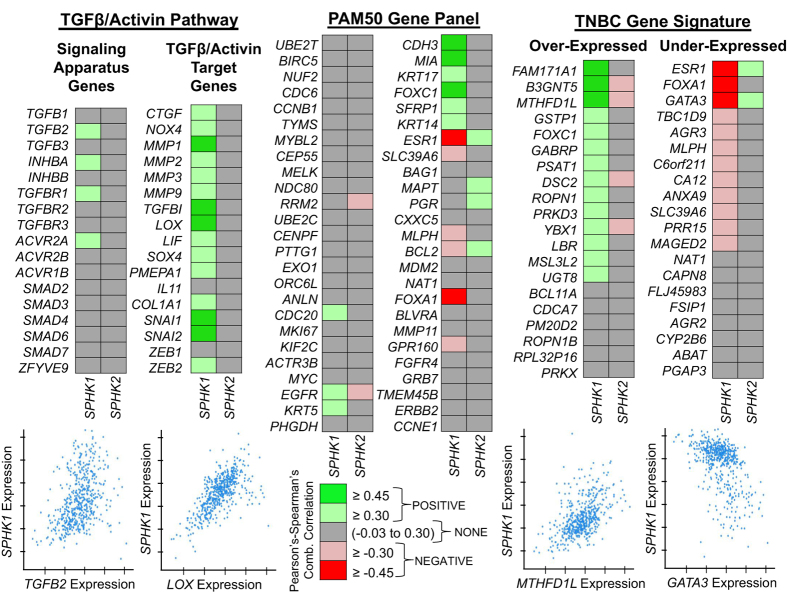
Mechanistic understanding of the preferential homing of circulating tumor cells to bone and their perturbation on bone metabolism within the tumor-bone microenvironment remains poorly understood. Alteration in both transforming growth factor β (TGFβ) signaling and sphingolipid metabolism results in the promotion of tumor growth and metastasis. Previous studies using MDA-MB-231 human breast cancer-derived cell lines of variable metastatic potential were queried for changes in sphingolipid metabolism genes to explore correlations between TGFβ dependence and bone metastatic behavior. Of these genes, only sphingosine kinase-1 (SPHK1) was identified to be significantly increased following TGFβ treatment. Induction of SPHK1 expression correlated to the degree of metastatic capacity in these MDA-MB-231-derived cell lines. We demonstrate that TGFβ mediates the regulation of SPHK1 gene expression, protein kinase activity and is critical to MDA-MB-231 cell viability. Furthermore, a bioinformatic analysis of human breast cancer gene expression supports SPHK1 as a hallmark TGFβ target gene that also bears the genetic fingerprint of the basal-like/triple-negative breast cancer molecular subtype. These data suggest a potential new signaling axis between TGFβ/SphK1 that may have a role in the development, prognosis or the clinical phenotype associated with tumor-bone metastasis.


Conflict of interest statement

TAG received commercial research grants from AstraZeneca and Exelexis and is a consultant/advisory board member of Novartis. KRS, JKM, DFE and HHB are employees of Eli Lilly and Company. The remaining authors declare no conflict of interest.

Figures

Figure 1
Figure 1
Query of sphingolipid metabolism and S1P signaling receptor genes from low, median and highly metastatic MDA-MB-231 sublines. Previously described microarray data obtained from various MDA-MB-231 sublines of varying metastatic capacity were queried for predictive value to the expression of genes involved in sphingolipid/S1P metabolism and signaling. Technical details of these studies have been described previously. (a) Displays a simplified schematic of sphingolipid/S1P metabolism and S1PR receptor genes (italicized) chosen for this retrospective analysis. TGFβ1-induced SPHK1 expression was identified and provided significant predictive value between low, median and high metastatic behavior of the various MDA-MB-231 (SCP-derived) sublines in mouse metastasis models (b). **P<0.01 (Student's t-test, low vs median/high).
Figure 2
Figure 2
qPCR screen for TGFβ1-mediated regulation of sphingosine/S1P metabolizing enzymes in human cancer cell lines. Human cancer cell lines grown in monolayer cultures were treated with 5 ng ml−1 hTGFβ1 for 2, 8 or 24 h followed by RNA isolation and Taqman-based qRT-PCR of SPHK1, sphingosine kinase-1; SPHK2, sphingosine kinase-2; SGPP1, sphingosine 1-phosphate phosphatase -1; SGPP2, sphingosine 1-phosphate phosphatase -2; and SGPL1, sphingosine 1-phosphate lyase. All mRNA values were normalized to GAPDH mRNA and plotted as fold induction versus the untreated control group (value=1). Only detectable/measurable mRNAs for each gene are displayed on their respective graphs.
Figure 3
Figure 3
Effects of various TGFβ isoforms/family members and kinetics of SPHK1 expression in MDA-MB-231 cells. MDA-MB-231 cells were treated with recombinant hTGFβ1 (5 ng ml−1), hTGFβ2 (5 ng ml−1), hTGFβ3 (5 ng ml−1), hActivin-A (50 ng ml−1) or hBMP-2 (50 ng ml−1) for 8 h followed by qRT-PCR analysis (a). Cells treated with hypoxia mimetics L-mimosine (L-MIM) and dimethyloxalyl glycine (DMOG) were harvested after 24 h (a). Both time and dose response kinetic experiments for SPHK1 and PMEPA1 were treated for approximately 8 h followed by qRT-PCR analysis (b). All data were normalized to GAPDH mRNA, analyzed using the Δ/Δ CT method and plotted as fold induction versus the untreated control group (value=1x). All data are plotted as mean fold-induction±s.e.m., n=3 per treatment group. *P<0.05 and **P<0.01 versus control group (one-way ANOVA, Bonferroni-corrected).
Figure 4
Figure 4
TβR1/Alk5 and RNA Polymerase II dependency for TGFβ1-mediated induction of SPHK1 expression. MDA-MB-231 cells were pre-treated for 30 min with either 10 μM SD-208 (TβR1/Alk5 inhibitor), 5 μg ml−1 actinomycin D (RNA Pol-II inhibitor) or 1 μM cycloheximide (protein synthesis inhibitor) followed by continued treatment with each agent in combination with 5 ng ml−1 TGFβ1 for 8 h. Cells were harvested, RNA was isolated and qRT-PCR analysis of SPHK1 and PMEPA1 expression was performed. All data were normalized to GAPDH mRNA, analyzed using the Δ/Δ CT method and plotted as fold induction versus their respective control groups (value=1x). All data are plotted as mean fold induction±s.e.m., n=3 per treatment group. *P<0.05 and **P<0.01 versus control group (one-way ANOVA, Bonferroni-corrected).
Figure 5
Figure 5
TGFβ1-mediated increase in SphK1 protein and kinase activity in MDA-MB-231 cells. MDA-MB-231 cells were treated for 2, 8 or 24 h with hTGFβ1 (5 ng ml−1). After TGFβ1 treatment, cells were lysed and protein separated via SDS-PAGE and western blotted for SphK1 and α-tubulin. For kinase assays, cell lysate was prepared and used for immunoprecipitation of SphK1 using a fixed combination of specific SphK1 (Abgent/ECM) antibodies. SphK1 kinase activity was assessed by the Sphingosine Kinase Activity Assay Kit (Echelon) in the absence or presence of the substrate sphingosine (600 μM). Sphk1 kinase activity was plotted as a bar graph function of ATP depletion using values interpolated from the ATP standard curve. All data are plotted as percent activity±s.e.m., n=3 per treatment group. *P<0.05 and **P<0.01 versus comparator group (one-way ANOVA, Tukey's HSD). Cellular sphingosine and S1P content were quantified via LC-MS/MS.
Figure 6
Figure 6
RAW264.7 monocyte cell transmigration enhancement by S1PR agonism and TGFβ1-treated MDA-MB-231 conditioned media. RAW264.7 cells were seeded into upper Transwell chambers where differing concentrations of S1P, SEW2871 or SDF-1α resided in lower chambers. Similarly, RAW264.7 cells were seeded into upper chambers where differing MDA-MB-231 conditioned media(s) from untreated or compound/TGF pre-treated studies resided in lower chambers. Numbers of migrating cells through the Transwell membranes were fixed, stained and counted for each independent chamber. Data are plotted as mean±s.e.m. for total number of cell migrated per membrane field, n=3 membranes for each treatment. *P<0.05 and **P<0.01 versus comparator group (one-way ANOVA, Tukey's HSD).
Figure 7
Figure 7
ZNF nuclease-mediated targeting of SPHK1 in MDA-MB-231 and cytotoxic sensitivity to SphK inhibitors. MDA-MB-231 cells were transiently-transfected with a custom SphK1 ZNF nuclease genomic targeting cassette along with CMV–eGFP expressing plasmid followed by FACS-mediated cell sorting of cell pools of varying fluorescence intensity (P1, P2 and P3) and subsequent culture-expanded pools (P2.e and P3.e). Genomic PCR was performed to assess genomic modification of the SPHK1 locus in various transfected and expanded MDA-MB-231 cell pools. Positive genomic alteration is noted by a black arrow corresponding to a PCR products band at ∼150–160 nt by gel electrophoresis (a). To assess MDA-MB-231 cell viability, cells were seeded and treated with varying concentrations of DMS, SKI II, FTY720 and SEW2781 for 7 days followed by cell viability determination by Cell Titer Glo analysis. Table IC50 calculations were based on the concentration response values analyzed by four-parameter non-linear regression curve fitting using GraphPad Prism (ver6.0) from two independent studies (b).
Figure 8
Figure 8
Evaluation of the SPHK1 gene expression signature in human breast cancer. Agilent microarray data compiled as part of The Cancer Genome Atlas (TCGA) Project were queried for correlative gene co-expression profiles to previously identified TGFβ/Activin signaling, PAM50 and triple-negative breast cancer (TBNC) gene panels and molecular signatures. Analysis was performed using the cBioPortal (http://cbioportal.org) gateway and repository for cancer genomics data—specifically utilizing the TCGA (Nature) invasive breast cancer patient data.

Similar articles

Cited by

References

    1. Sethi N, Kang Y. Unravelling the complexity of metastasis - molecular understanding and targeted therapies. Nat Rev Cancer 2011; 11: 735–748. - PMC - PubMed
    1. Buijs JT, Stayrook KR, Guise TA. The role of TGFβ in bone metastasis: novel therapeutic perspectives. BoneKey Rep 2012; 1: 96. - PMC - PubMed
    1. Buijs JT, Stayrook KR, Guise TA. TGFβ in the bone microenvironment: role in breast cancer metastasis. Cancer Microenviron 2011; 4: 261–281. - PMC - PubMed
    1. Futerman AH, Hannun YA. The complex life of simple sphingolipids. EMBO Rep 2004; 5: 777–782. - PMC - PubMed
    1. Kok JW, Sietsma H. Sphingolipid metabolism enzymes as targets for anticancer therapy. Curr Drug Targets 2004; 5: 375–382. - PubMed

LinkOut - more resources