

Cancer cell classification with coherent diffraction imaging using an extreme ultraviolet radiation source
- PMID: 26158049
- PMCID: PMC4478871
- DOI: 10.1117/1.JMI.1.3.031008
Cancer cell classification with coherent diffraction imaging using an extreme ultraviolet radiation source
Abstract
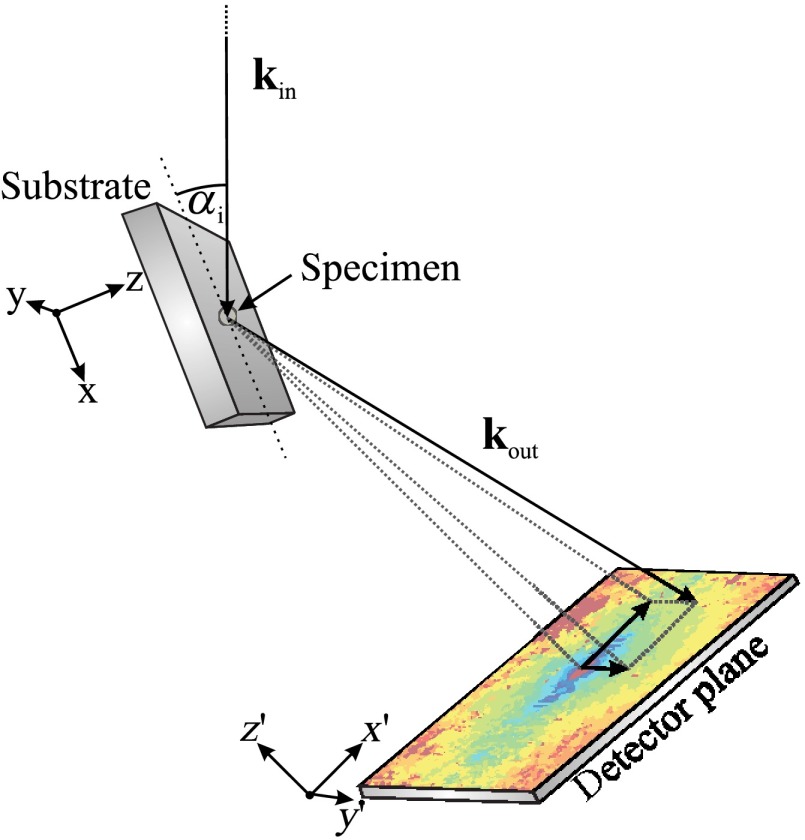
In cancer treatment, it is highly desirable to classify single cancer cells in real time. The standard method is polymerase chain reaction requiring a substantial amount of resources and time. Here, we present an innovative approach for rapidly classifying different cell types: we measure the diffraction pattern of a single cell illuminated with coherent extreme ultraviolet (XUV) laser-generated radiation. These patterns allow distinguishing different breast cancer cell types in a subsequent step. Moreover, the morphology of the object can be retrieved from the diffraction pattern with submicron resolution. In a proof-of-principle experiment, we prepared single MCF7 and SKBR3 breast cancer cells on gold-coated silica slides. The output of a laser-driven XUV light source is focused onto a single unstained and unlabeled cancer cell. With the resulting diffraction pattern, we could clearly identify the different cell types. With an improved setup, it will not only be feasible to classify circulating tumor cells with a high throughput, but also to identify smaller objects such as bacteria or even viruses.
Keywords: breast cancer; coherent diffraction imaging; high harmonic generation; high resolution imaging; rapid classification.
Figures


Similar articles
-
Real-time and sub-wavelength ultrafast coherent diffraction imaging in the extreme ultraviolet.Sci Rep. 2014 Dec 8;4:7356. doi: 10.1038/srep07356. Sci Rep. 2014. PMID: 25483626 Free PMC article.
-
Coherent diffractive imaging of single helium nanodroplets with a high harmonic generation source.Nat Commun. 2017 Sep 8;8(1):493. doi: 10.1038/s41467-017-00287-z. Nat Commun. 2017. PMID: 28887513 Free PMC article.
-
Opening a new route to multiport coherent XUV sources via intracavity high-order harmonic generation.Light Sci Appl. 2020 Sep 24;9:168. doi: 10.1038/s41377-020-00405-5. eCollection 2020. Light Sci Appl. 2020. PMID: 33042531 Free PMC article.
-
Methods and application of coherent X-ray diffraction imaging of noncrystalline particles.Biophys Rev. 2020 Apr;12(2):541-567. doi: 10.1007/s12551-020-00690-9. Epub 2020 Mar 16. Biophys Rev. 2020. PMID: 32180121 Free PMC article. Review.
-
The potential of future light sources to explore the structure and function of matter.IUCrJ. 2015 Feb 3;2(Pt 2):230-45. doi: 10.1107/S2052252514024269. eCollection 2015 Mar 1. IUCrJ. 2015. PMID: 25866660 Free PMC article. Review.
Cited by
-
EUV and Hard X-ray Hartmann Wavefront Sensing for Optical Metrology, Alignment and Phase Imaging.Sensors (Basel). 2021 Jan 28;21(3):874. doi: 10.3390/s21030874. Sensors (Basel). 2021. PMID: 33525501 Free PMC article.
-
Detecting Swelling States of Red Blood Cells by "Cell-Fluid Coupling Spectroscopy".Adv Sci (Weinh). 2016 Oct 13;4(2):1600238. doi: 10.1002/advs.201600238. eCollection 2017 Feb. Adv Sci (Weinh). 2016. PMID: 28251048 Free PMC article.
-
Transverse Coherence Limited Coherent Diffraction Imaging using a Molybdenum Soft X-ray Laser Pumped at Moderate Pump Energies.Sci Rep. 2017 Jul 13;7(1):5314. doi: 10.1038/s41598-017-05789-w. Sci Rep. 2017. PMID: 28706258 Free PMC article.
-
Real-time and sub-wavelength ultrafast coherent diffraction imaging in the extreme ultraviolet.Sci Rep. 2014 Dec 8;4:7356. doi: 10.1038/srep07356. Sci Rep. 2014. PMID: 25483626 Free PMC article.
-
Boron-Implanted Black Silicon Photodiode with Close-to-Ideal Responsivity from 200 to 1000 nm.ACS Photonics. 2023 May 22;10(6):1735-1741. doi: 10.1021/acsphotonics.2c01984. eCollection 2023 Jun 21. ACS Photonics. 2023. PMID: 37363632 Free PMC article.
References
-
- Miao J., et al. , “Extending the methodology of X-ray crystallography to allow imaging of micrometre-sized non-crystalline specimens,” Nature 400(6742), 342–344 (1999).NATUAS10.1038/22498 - DOI
-
- Chapman H. N., Nugent K. A., “Coherent lensless X-ray imaging,” Nat. Photonics 4(12), 833–839 (2010).10.1038/nphoton.2010.240 - DOI
LinkOut - more resources
Full Text Sources
Other Literature Sources
