

Structured learning algorithm for detection of nonobstructive and obstructive coronary plaque lesions from computed tomography angiography
- PMID: 26158081
- PMCID: PMC4478984
- DOI: 10.1117/1.JMI.2.1.014003
Structured learning algorithm for detection of nonobstructive and obstructive coronary plaque lesions from computed tomography angiography
Abstract
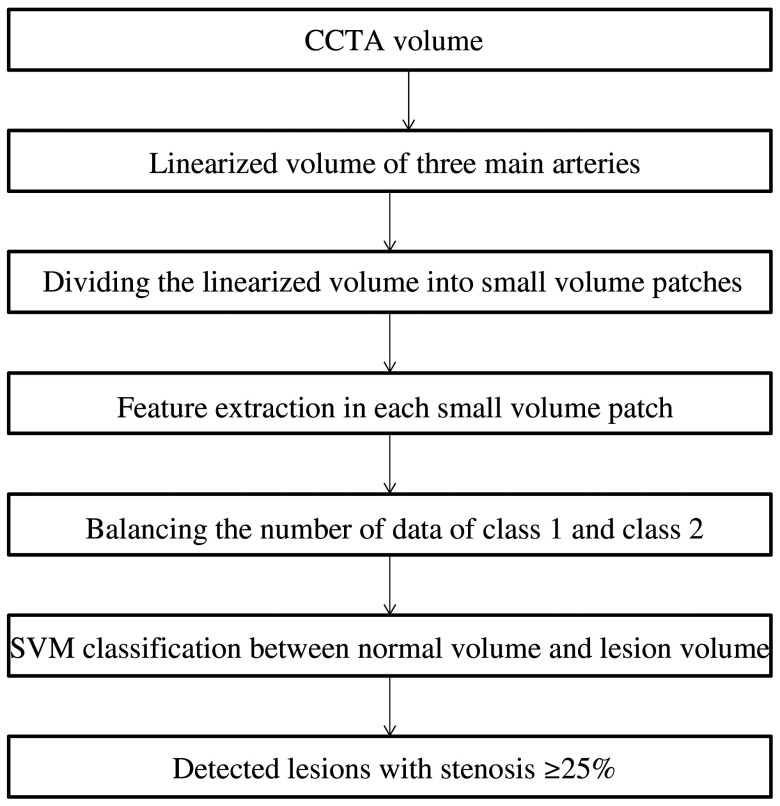
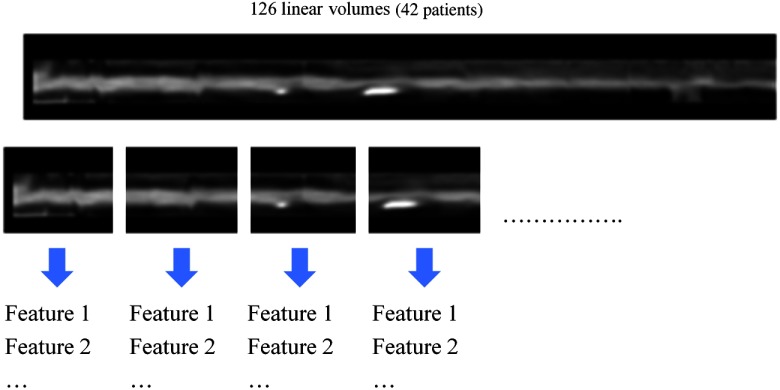
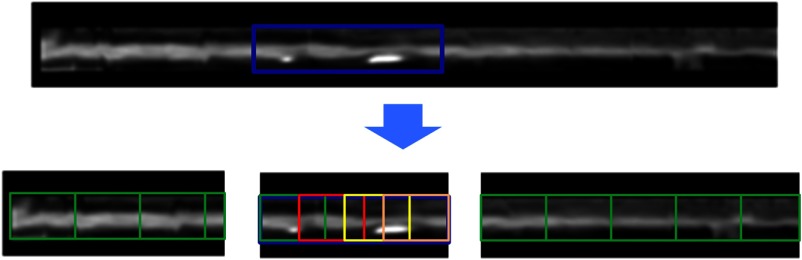
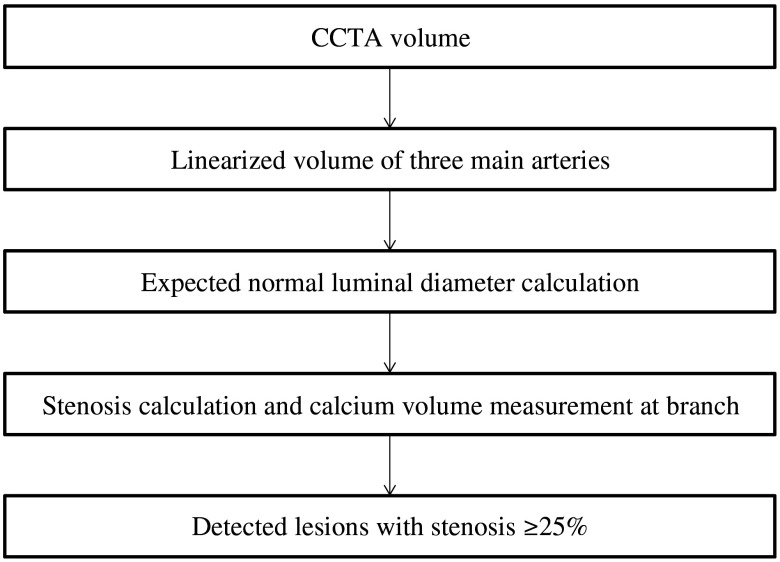
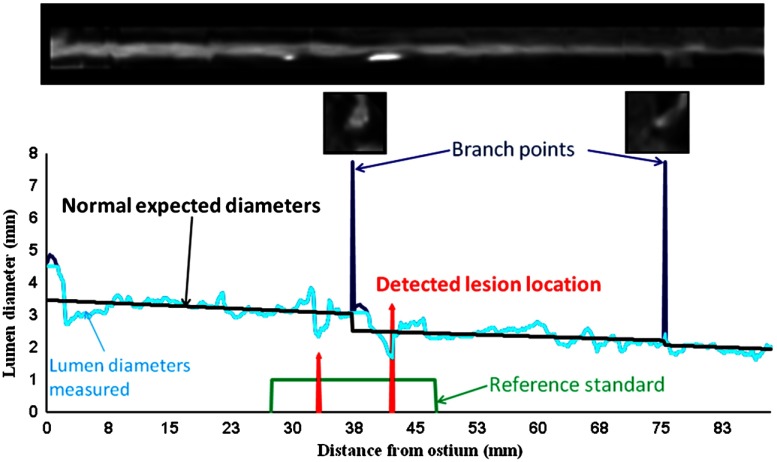
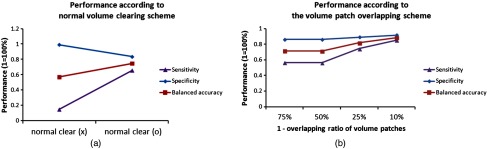
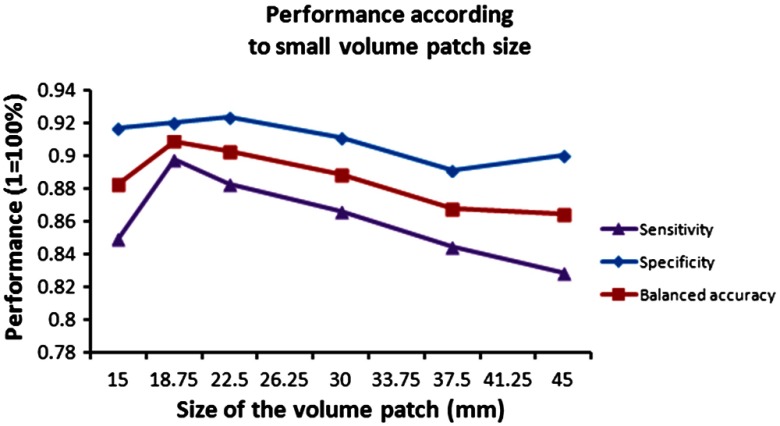
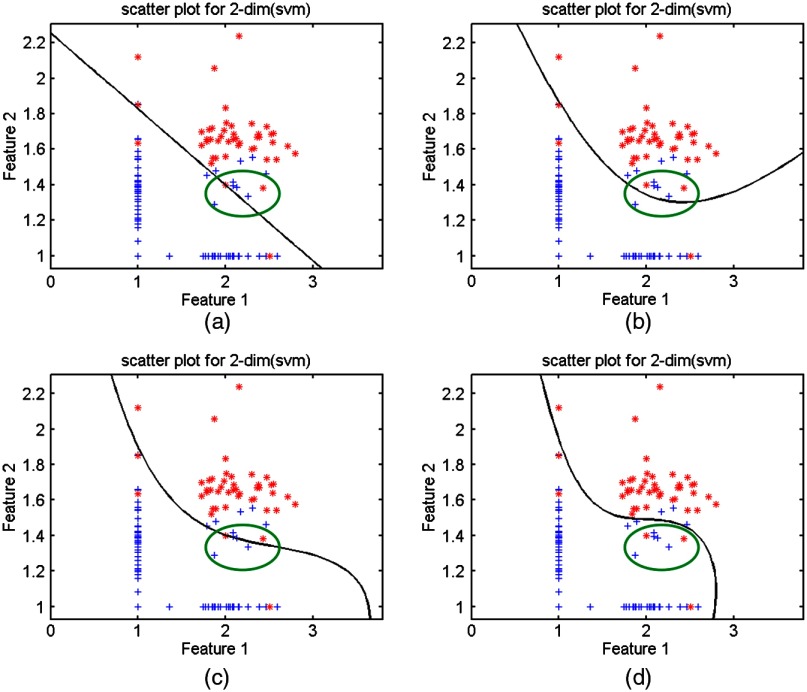
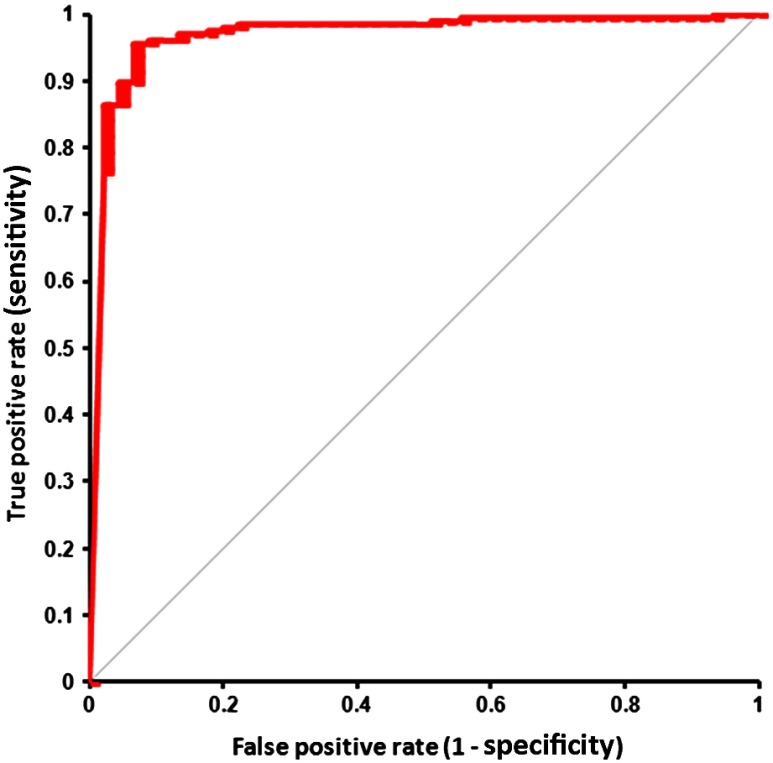
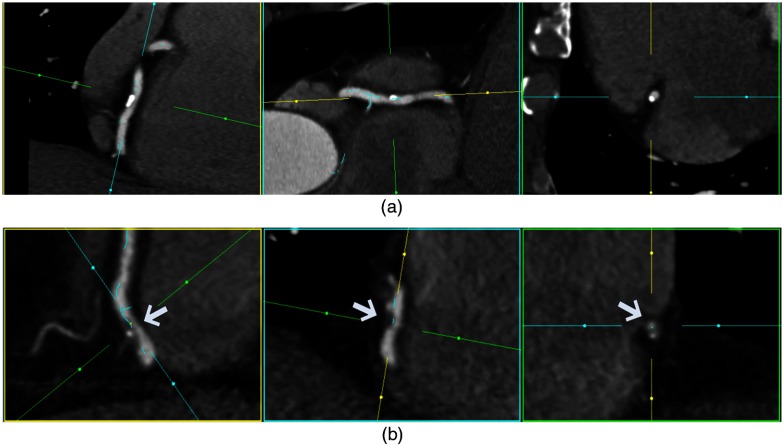
Visual identification of coronary arterial lesion from three-dimensional coronary computed tomography angiography (CTA) remains challenging. We aimed to develop a robust automated algorithm for computer detection of coronary artery lesions by machine learning techniques. A structured learning technique is proposed to detect all coronary arterial lesions with stenosis [Formula: see text]. Our algorithm consists of two stages: (1) two independent base decisions indicating the existence of lesions in each arterial segment and (b) the final decision made by combining the base decisions. One of the base decisions is the support vector machine (SVM) based learning algorithm, which divides each artery into small volume patches and integrates several quantitative geometric and shape features for arterial lesions in each small volume patch by SVM algorithm. The other base decision is the formula-based analytic method. The final decision in the first stage applies SVM-based decision fusion to combine the two base decisions in the second stage. The proposed algorithm was applied to 42 CTA patient datasets, acquired with dual-source CT, where 21 datasets had 45 lesions with stenosis [Formula: see text]. Visual identification of lesions with stenosis [Formula: see text] by three expert readers, using consensus reading, was considered as a reference standard. Our method performed with high sensitivity (93%), specificity (95%), and accuracy (94%), with receiver operator characteristic area under the curve of 0.94. The proposed algorithm shows promising results in the automated detection of obstructive and nonobstructive lesions from CTA.
Keywords: coronary arterial disease; coronary arterial lesion detection from coronary computed tomography angiography; coronary computed tomography angiography; image feature extraction; learning-based detection; machine learning; structured learning; support vector machines; support vector regression.
Figures
Similar articles
-
Automated knowledge-based detection of nonobstructive and obstructive arterial lesions from coronary CT angiography.Med Phys. 2013 Apr;40(4):041912. doi: 10.1118/1.4794480. Med Phys. 2013. PMID: 23556906
-
Improving CCTA-based lesions' hemodynamic significance assessment by accounting for partial volume modeling in automatic coronary lumen segmentation.Med Phys. 2017 Mar;44(3):1040-1049. doi: 10.1002/mp.12121. Med Phys. 2017. PMID: 28112409
-
Diagnostic Accuracy of a Machine-Learning Approach to Coronary Computed Tomographic Angiography-Based Fractional Flow Reserve: Result From the MACHINE Consortium.Circ Cardiovasc Imaging. 2018 Jun;11(6):e007217. doi: 10.1161/CIRCIMAGING.117.007217. Circ Cardiovasc Imaging. 2018. PMID: 29914866
-
Diagnostic Performance of Hybrid Cardiac Imaging Methods for Assessment of Obstructive Coronary Artery Disease Compared With Stand-Alone Coronary Computed Tomography Angiography: A Meta-Analysis.JACC Cardiovasc Imaging. 2018 Apr;11(4):589-599. doi: 10.1016/j.jcmg.2017.05.020. Epub 2017 Aug 16. JACC Cardiovasc Imaging. 2018. PMID: 28823745 Free PMC article.
-
Coronary CT angiography versus intravascular ultrasound for estimation of coronary stenosis and atherosclerotic plaque burden: a meta-analysis.J Cardiovasc Comput Tomogr. 2013 Jul-Aug;7(4):256-66. doi: 10.1016/j.jcct.2013.08.006. Epub 2013 Aug 23. J Cardiovasc Comput Tomogr. 2013. PMID: 24148779 Review.
Cited by
-
Advances in Artificial Intelligence-Assisted Coronary Computed Tomographic Angiography for Atherosclerotic Plaque Characterization.Rev Cardiovasc Med. 2024 Jan 15;25(1):27. doi: 10.31083/j.rcm2501027. eCollection 2024 Jan. Rev Cardiovasc Med. 2024. PMID: 39077649 Free PMC article. Review.
-
Latest Developments in Adapting Deep Learning for Assessing TAVR Procedures and Outcomes.J Clin Med. 2023 Jul 19;12(14):4774. doi: 10.3390/jcm12144774. J Clin Med. 2023. PMID: 37510889 Free PMC article. Review.
-
Understanding the predictive value and methods of risk assessment based on coronary computed tomographic angiography in populations with coronary artery disease: a review.Precis Clin Med. 2021 Jul 26;4(3):192-203. doi: 10.1093/pcmedi/pbab018. eCollection 2021 Sep. Precis Clin Med. 2021. PMID: 35693218 Free PMC article. Review.
-
Automated Classification of Atherosclerotic Radiomics Features in Coronary Computed Tomography Angiography (CCTA).Diagnostics (Basel). 2022 Jul 8;12(7):1660. doi: 10.3390/diagnostics12071660. Diagnostics (Basel). 2022. PMID: 35885564 Free PMC article.
-
The Role of Artificial Intelligence in Coronary Artery Disease and Atrial Fibrillation.Balkan Med J. 2023 May 8;40(3):151-152. doi: 10.4274/balkanmedj.galenos.2023.06042023. Epub 2023 Apr 7. Balkan Med J. 2023. PMID: 37025078 Free PMC article. No abstract available.
References
-
- Budoff M. J., et al. , “Diagnostic performance of 64-multidetector row coronary computed tomographic angiography for evaluation of coronary artery stenosis in individuals without known coronary artery disease: results from the prospective multicenter ACCURACY (Assessment by Coronary Computed Tomographic Angiography of Individuals Undergoing Invasive Coronary Angiography) trial,” J. Am. Coll. Cardiol. 52(21), 1724–1732 (2008).JACCDI10.1016/j.jacc.2008.07.031 - DOI - PubMed
-
- Hausleiter J., et al. , “Non-invasive coronary computed tomographic angiography for patients with suspected coronary artery disease: the Coronary Angiography by Computed Tomography with the Use of a Submillimeter resolution (CACTUS) trial,” Eur. Heart J. 28(24), 3034–3041 (2007).EHJODF10.1093/eurheartj/ehm150 - DOI - PubMed
LinkOut - more resources
Full Text Sources
Other Literature Sources
