

Automated brain computed tomographic densitometry of early ischemic changes in acute stroke
- PMID: 26158082
- PMCID: PMC4478844
- DOI: 10.1117/1.JMI.2.1.014004
Automated brain computed tomographic densitometry of early ischemic changes in acute stroke
Abstract
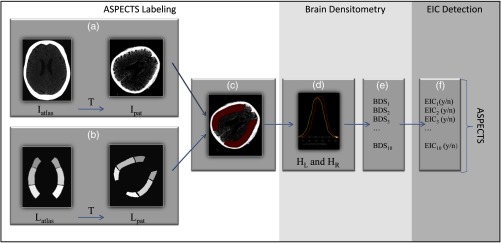
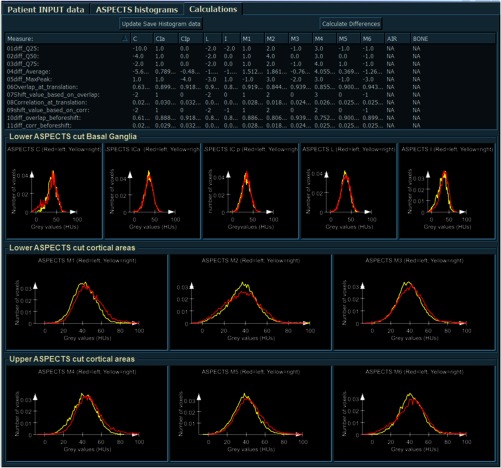
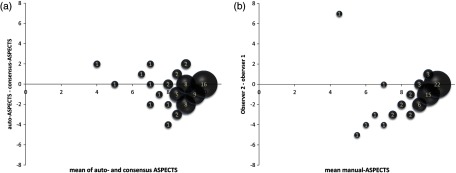
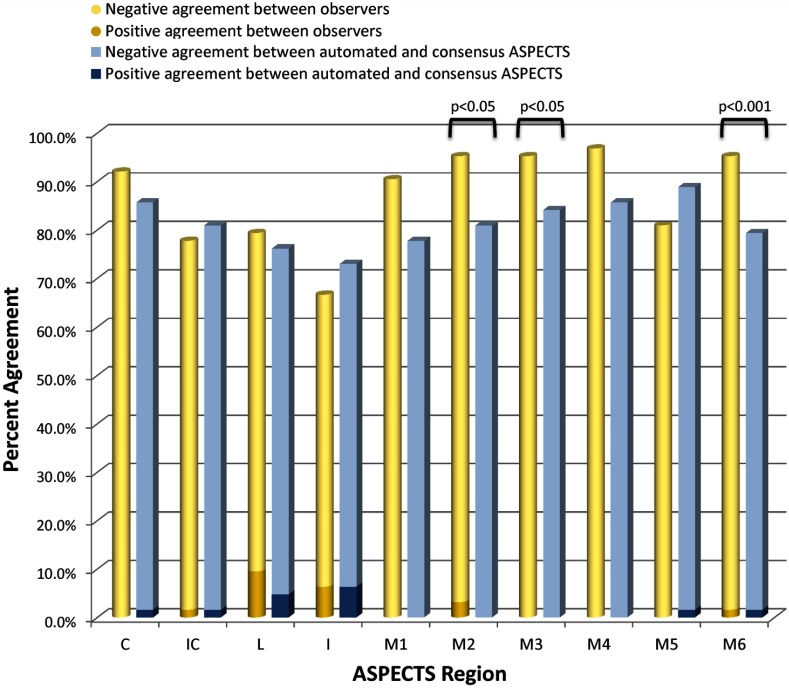
The Alberta Stroke Program Early CT score (ASPECTS) scoring method is frequently used for quantifying early ischemic changes (EICs) in patients with acute ischemic stroke in clinical studies. Varying interobserver agreement has been reported, however, with limited agreement. Therefore, our goal was to develop and evaluate an automated brain densitometric method. It divides CT scans of the brain into ASPECTS regions using atlas-based segmentation. EICs are quantified by comparing the brain density between contralateral sides. This method was optimized and validated using CT data from 10 and 63 patients, respectively. The automated method was validated against manual ASPECTS, stroke severity at baseline and clinical outcome after 7 to 10 days (NIH Stroke Scale, NIHSS) and 3 months (modified Rankin Scale). Manual and automated ASPECTS showed similar and statistically significant correlations with baseline NIHSS ([Formula: see text] and [Formula: see text], respectively) and with follow-up mRS ([Formula: see text] and [Formula: see text]), except for the follow-up NIHSS. Agreement between automated and consensus ASPECTS reading was similar to the interobserver agreement of manual ASPECTS (differences [Formula: see text] point in 73% of cases). The automated ASPECTS method could, therefore, be used as a supplementary tool to assist manual scoring.
Keywords: ASPECTS scoring; computed tomography; densitometry; image processing; stroke.
Figures
Similar articles
-
An automated ASPECTS method with atlas-based segmentation.Comput Methods Programs Biomed. 2021 Oct;210:106376. doi: 10.1016/j.cmpb.2021.106376. Epub 2021 Aug 31. Comput Methods Programs Biomed. 2021. PMID: 34500140
-
Validation of an automated ASPECTS method on non-contrast computed tomography scans of acute ischemic stroke patients.Int J Stroke. 2020 Jul;15(5):528-534. doi: 10.1177/1747493019895702. Epub 2019 Dec 18. Int J Stroke. 2020. PMID: 31852412
-
Alberta Stroke Program Early CT Score Versus Computed Tomographic Perfusion to Predict Functional Outcome After Successful Reperfusion in Acute Ischemic Stroke.Stroke. 2018 Oct;49(10):2361-2367. doi: 10.1161/STROKEAHA.118.021961. Stroke. 2018. PMID: 30355098 Free PMC article.
-
Automated versus manual imaging assessment of early ischemic changes in acute stroke: comparison of two software packages and expert consensus.Eur Radiol. 2019 Nov;29(11):6285-6292. doi: 10.1007/s00330-019-06252-2. Epub 2019 May 10. Eur Radiol. 2019. PMID: 31076862
-
ASPECTS CT in Acute Ischemia: Review of Current Data.Top Magn Reson Imaging. 2017 Jun;26(3):103-112. doi: 10.1097/RMR.0000000000000122. Top Magn Reson Imaging. 2017. PMID: 28277460 Review.
Cited by
-
Automated ASPECT rating: comparison between the Frontier ASPECT Score software and the Brainomix software.Neuroradiology. 2018 Dec;60(12):1267-1272. doi: 10.1007/s00234-018-2098-x. Epub 2018 Sep 15. Neuroradiology. 2018. PMID: 30219935
-
Validation of two automated ASPECTS software on non-contrast computed tomography scans of patients with acute ischemic stroke.Front Neurol. 2023 Apr 6;14:1170955. doi: 10.3389/fneur.2023.1170955. eCollection 2023. Front Neurol. 2023. PMID: 37090971 Free PMC article.
-
Target-based deep learning network surveillance of non-contrast computed tomography for small infarct core of acute ischemic stroke.Front Neurol. 2024 Sep 19;15:1477811. doi: 10.3389/fneur.2024.1477811. eCollection 2024. Front Neurol. 2024. PMID: 39364421 Free PMC article.
-
Cerebral ischemia detection using deep learning techniques.Health Inf Sci Syst. 2025 May 20;13(1):36. doi: 10.1007/s13755-025-00352-8. eCollection 2025 Dec. Health Inf Sci Syst. 2025. PMID: 40400660 Free PMC article.
-
In-Silico Trials for Treatment of Acute Ischemic Stroke.Front Neurol. 2020 Sep 16;11:558125. doi: 10.3389/fneur.2020.558125. eCollection 2020. Front Neurol. 2020. PMID: 33041995 Free PMC article.
References
LinkOut - more resources
Full Text Sources
Other Literature Sources
