

Variability and accuracy of different software packages for dynamic susceptibility contrast magnetic resonance imaging for distinguishing glioblastoma progression from pseudoprogression
- PMID: 26158114
- PMCID: PMC4478857
- DOI: 10.1117/1.JMI.2.2.026001
Variability and accuracy of different software packages for dynamic susceptibility contrast magnetic resonance imaging for distinguishing glioblastoma progression from pseudoprogression
Abstract
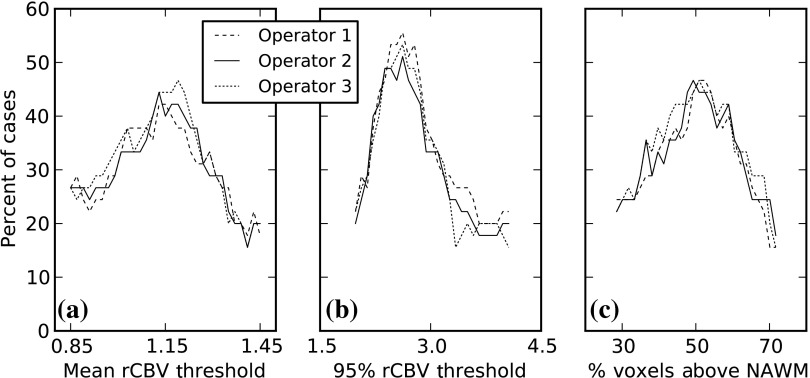
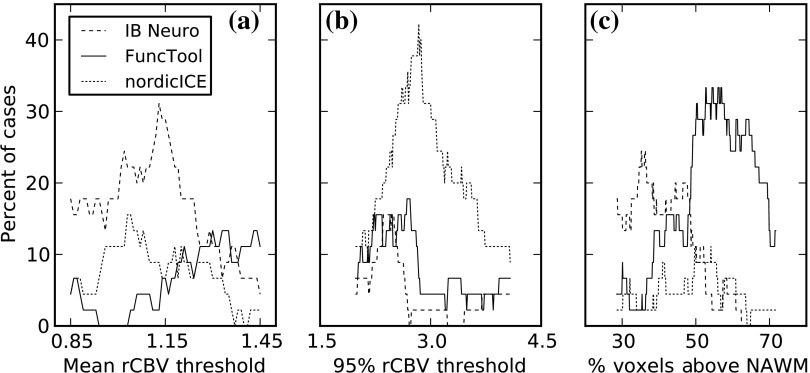
Determining whether glioblastoma multiforme (GBM) is progressing despite treatment is challenging due to the pseudoprogression phenomenon seen on conventional MRIs, but relative cerebral blood volume (CBV) has been shown to be helpful. As CBV's calculation from perfusion-weighted images is not standardized, we investigated whether there were differences between three FDA-cleared software packages in their CBV output values and subsequent performance regarding predicting survival/progression. Forty-five postradiation therapy GBM cases were retrospectively identified as having indeterminate MRI findings of progression versus pseudoprogression. The dynamic susceptibility contrast MR images were processed with different software and three different relative CBV metrics based on the abnormally enhancing regions were computed. The intersoftware intraclass correlation coefficients were 0.8 and below, depending on the metric used. No statistically significant difference in progression determination performance was found between the software packages, but performance was better for the cohort imaged at 3.0 T versus those imaged at 1.5 T for many relative CBV metric and classification criteria combinations. The results revealed clinically significant variation in relative CBV measures based on the software used, but minimal interoperator variation. We recommend against using specific relative CBV measurement thresholds for GBM progression determination unless the same software or processing algorithm is used.
Keywords: cerebral blood volume; dynamic-susceptibility contrast; glioblastoma; magnetic resonance imaging; perfusion.
Figures
Similar articles
-
Impact of Software Modeling on the Accuracy of Perfusion MRI in Glioma.AJNR Am J Neuroradiol. 2015 Dec;36(12):2242-9. doi: 10.3174/ajnr.A4451. Epub 2015 Sep 10. AJNR Am J Neuroradiol. 2015. PMID: 26359151 Free PMC article.
-
Comparison of clinically available dynamic susceptibility contrast post processing software to differentiate progression from pseudoprogression in post-treatment high grade glioma.Eur J Radiol. 2023 Oct;167:111076. doi: 10.1016/j.ejrad.2023.111076. Epub 2023 Sep 1. Eur J Radiol. 2023. PMID: 37666072
-
Incorporating diffusion- and perfusion-weighted MRI into a radiomics model improves diagnostic performance for pseudoprogression in glioblastoma patients.Neuro Oncol. 2019 Feb 19;21(3):404-414. doi: 10.1093/neuonc/noy133. Neuro Oncol. 2019. PMID: 30107606 Free PMC article.
-
Differences in dynamic susceptibility contrast MR perfusion maps generated by different methods implemented in commercial software.J Comput Assist Tomogr. 2014 Sep-Oct;38(5):647-54. doi: 10.1097/RCT.0000000000000115. J Comput Assist Tomogr. 2014. PMID: 24879459
-
Dynamic Susceptibility Contrast MR Imaging in Glioma: Review of Current Clinical Practice.Magn Reson Imaging Clin N Am. 2016 Nov;24(4):649-670. doi: 10.1016/j.mric.2016.06.005. Epub 2016 Sep 14. Magn Reson Imaging Clin N Am. 2016. PMID: 27742108 Review.
Cited by
-
Comparison of normalized cerebral blood flow between different post-processing methods of dynamic susceptibility contrast perfusion-weighted imaging and arterial spin labeling in gliomas with different grading.Quant Imaging Med Surg. 2024 Dec 5;14(12):8720-8733. doi: 10.21037/qims-24-1076. Epub 2024 Nov 29. Quant Imaging Med Surg. 2024. PMID: 39698595 Free PMC article.
-
Machine learning assisted DSC-MRI radiomics as a tool for glioma classification by grade and mutation status.BMC Med Inform Decis Mak. 2020 Jul 6;20(1):149. doi: 10.1186/s12911-020-01163-5. BMC Med Inform Decis Mak. 2020. PMID: 32631306 Free PMC article.
-
Evaluating Multisite rCBV Consistency from DSC-MRI Imaging Protocols and Postprocessing Software Across the NCI Quantitative Imaging Network Sites Using a Digital Reference Object (DRO).Tomography. 2019 Mar;5(1):110-117. doi: 10.18383/j.tom.2018.00041. Tomography. 2019. PMID: 30854448 Free PMC article.
-
Dynamic Susceptibility Contrast-MRI Quantification Software Tool: Development and Evaluation.Tomography. 2016 Dec;2(4):448-456. doi: 10.18383/j.tom.2016.00172. Tomography. 2016. PMID: 28066810 Free PMC article.
-
Reproducibility of dynamic contrast-enhanced MRI and dynamic susceptibility contrast MRI in the study of brain gliomas: a comparison of data obtained using different commercial software.Radiol Med. 2017 Apr;122(4):294-302. doi: 10.1007/s11547-016-0720-8. Epub 2017 Jan 9. Radiol Med. 2017. PMID: 28070841
References
-
- Stupp R., et al. , “Effects of radiotherapy with concomitant and adjuvant temozolomide versus radiotherapy alone on survival in glioblastoma in a randomised phase III study: 5-year analysis of the EORTC-NCIC trial,” Lancet Oncol. 10(5), 459–466 (2009).LOANBN10.1016/S1470-2045(09)70025-7 - DOI - PubMed
Grants and funding
LinkOut - more resources
Full Text Sources
Research Materials
