. 2015 Jul 9:6:7676.
doi: 10.1038/ncomms8676.

CEP63 deficiency promotes p53-dependent microcephaly and reveals a role for the centrosome in meiotic recombination

Affiliations

CEP63 deficiency promotes p53-dependent microcephaly and reveals a role for the centrosome in meiotic recombination

Marko Marjanović et al. Nat Commun. .

Abstract

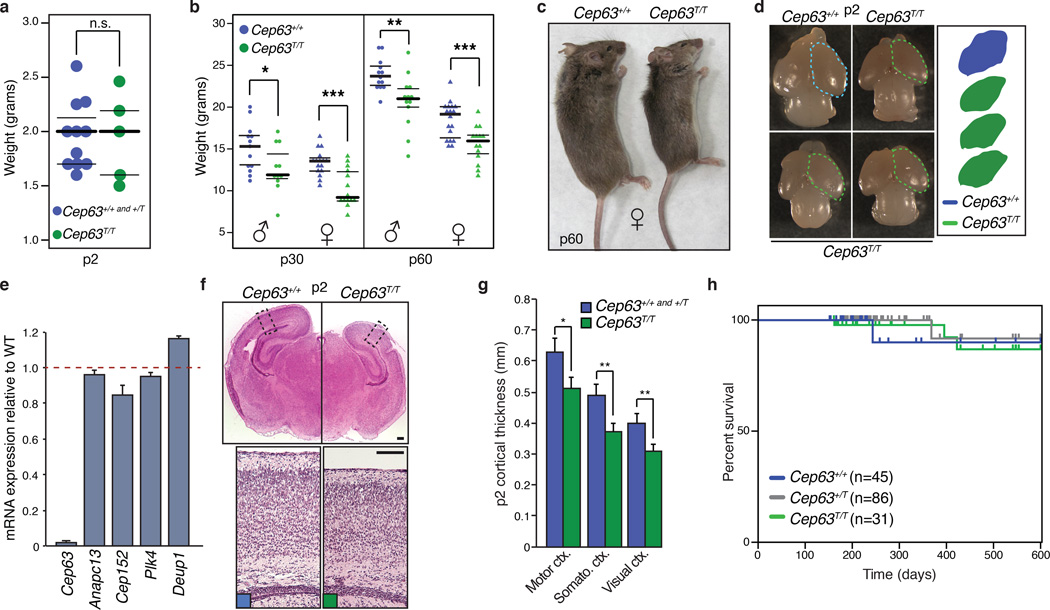
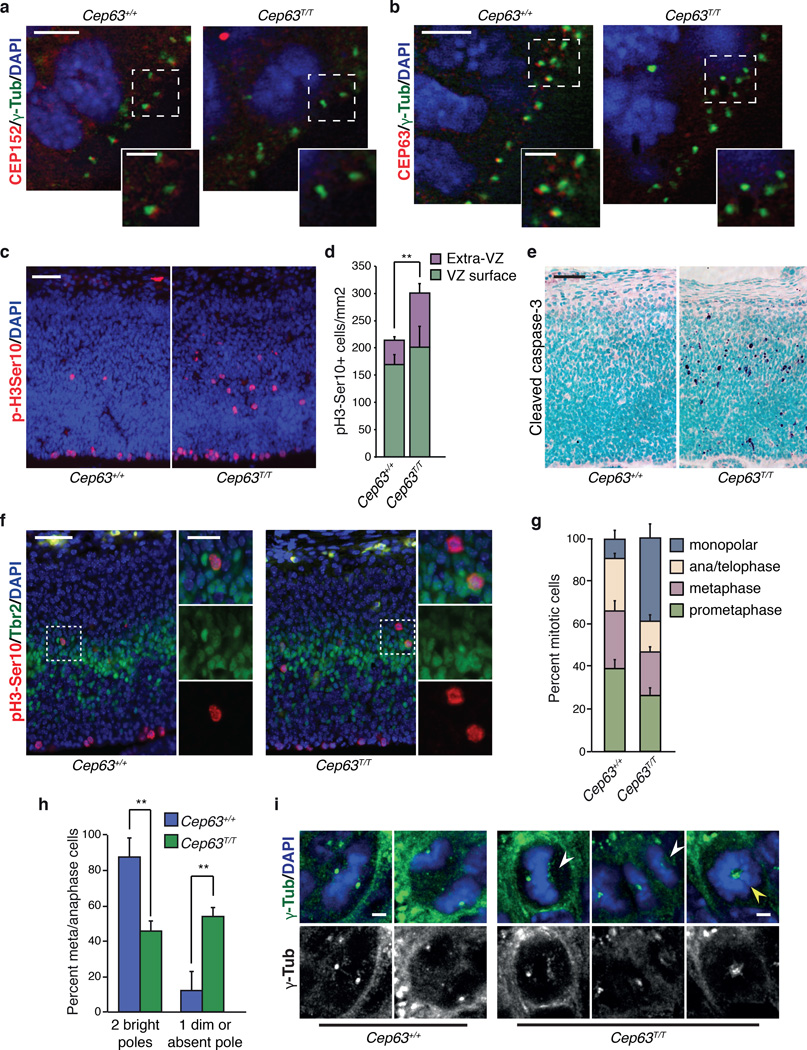
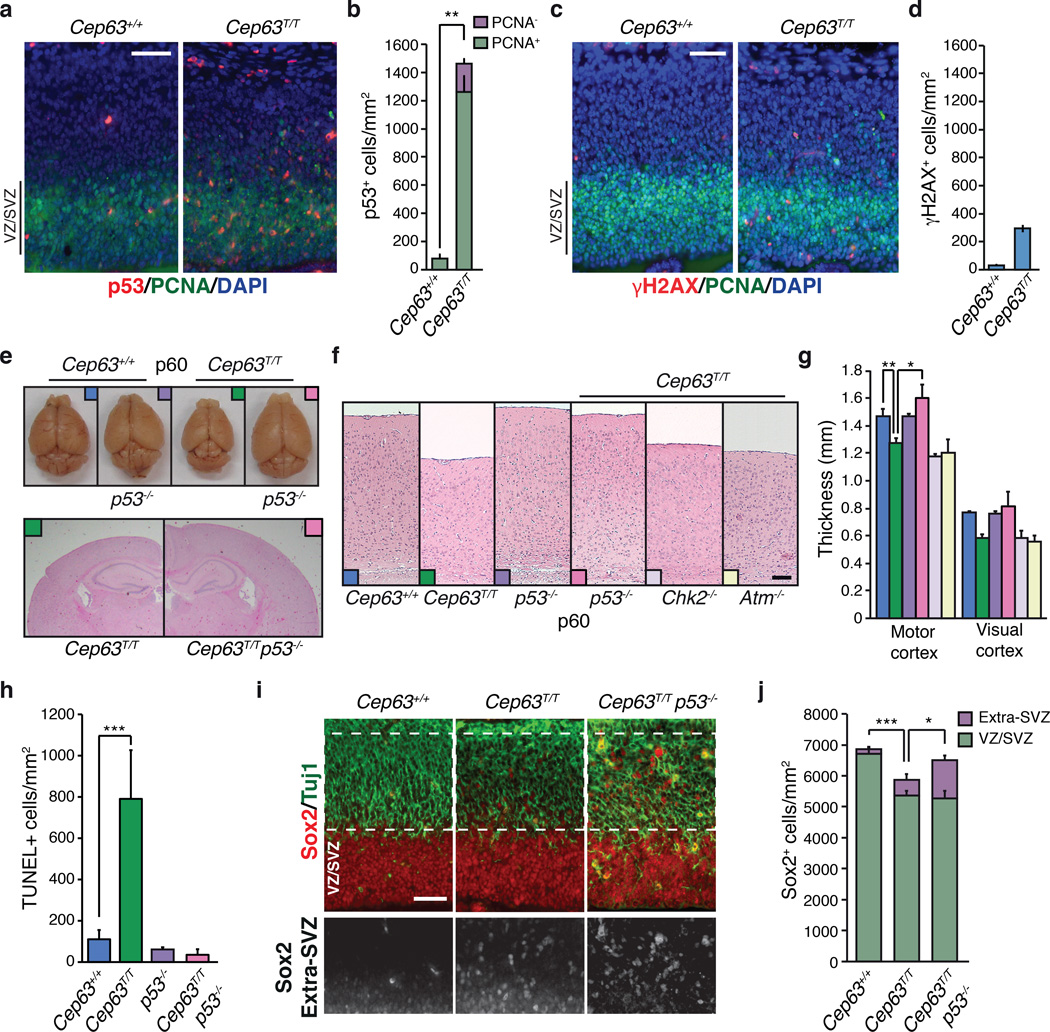
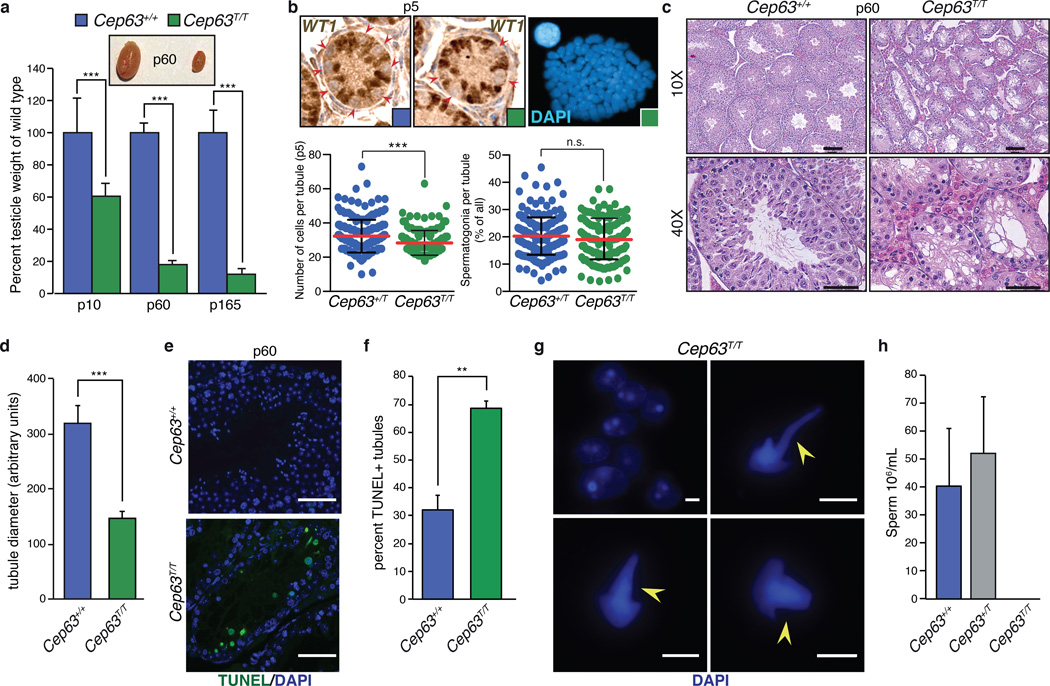
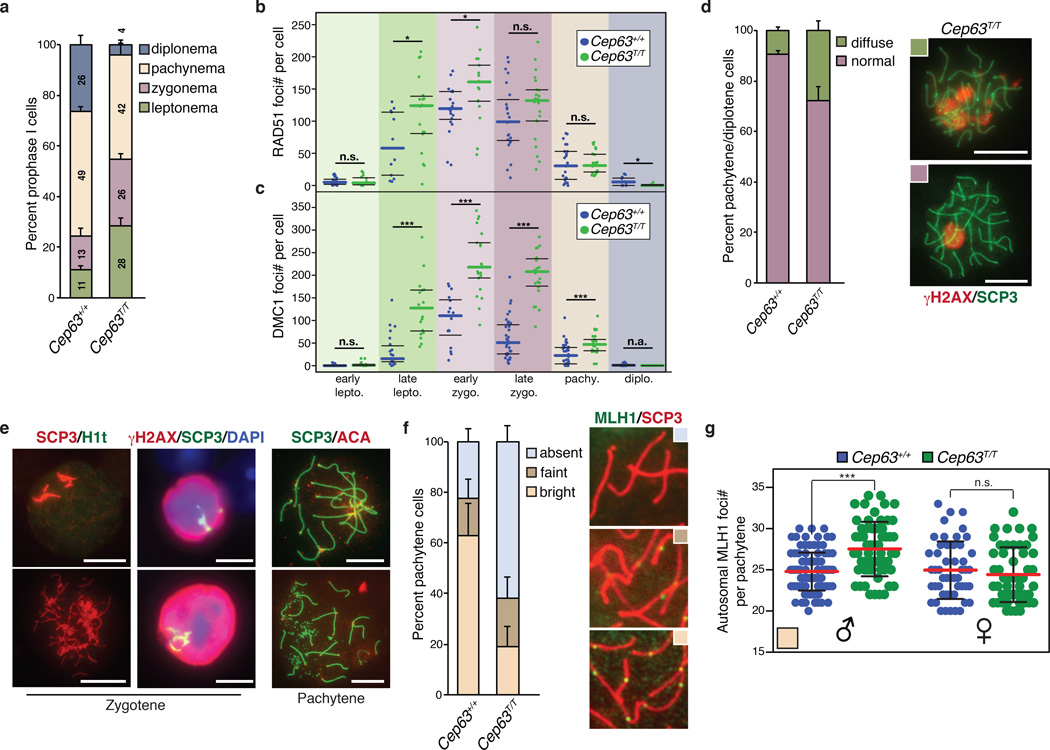
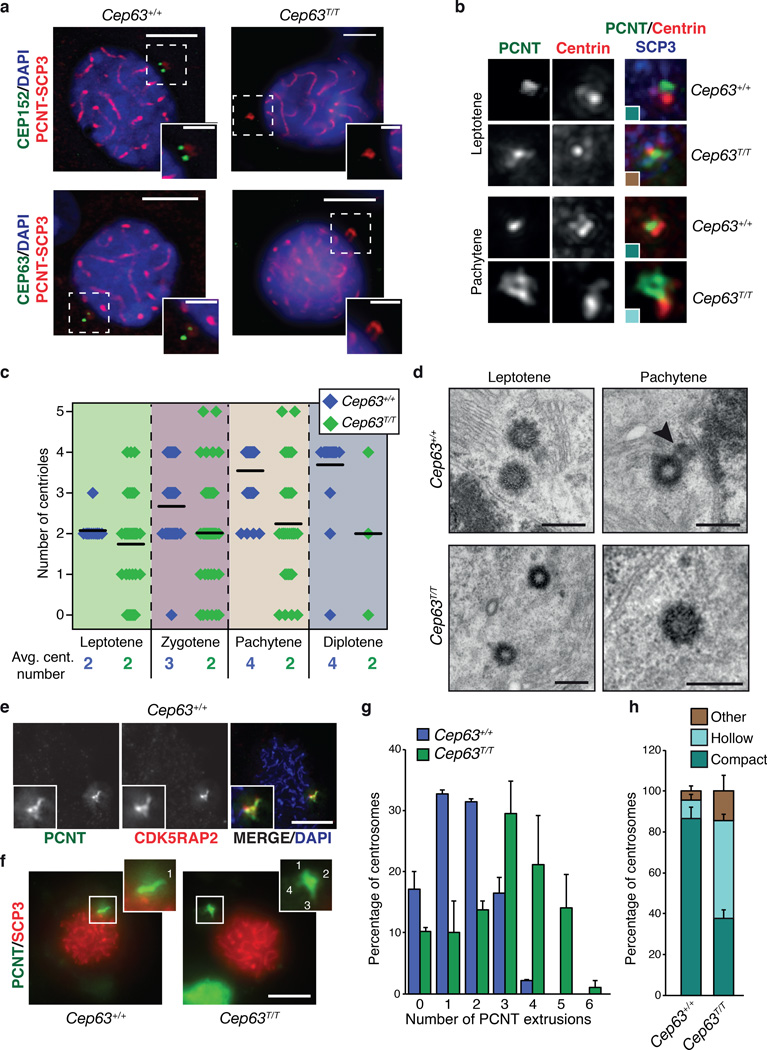
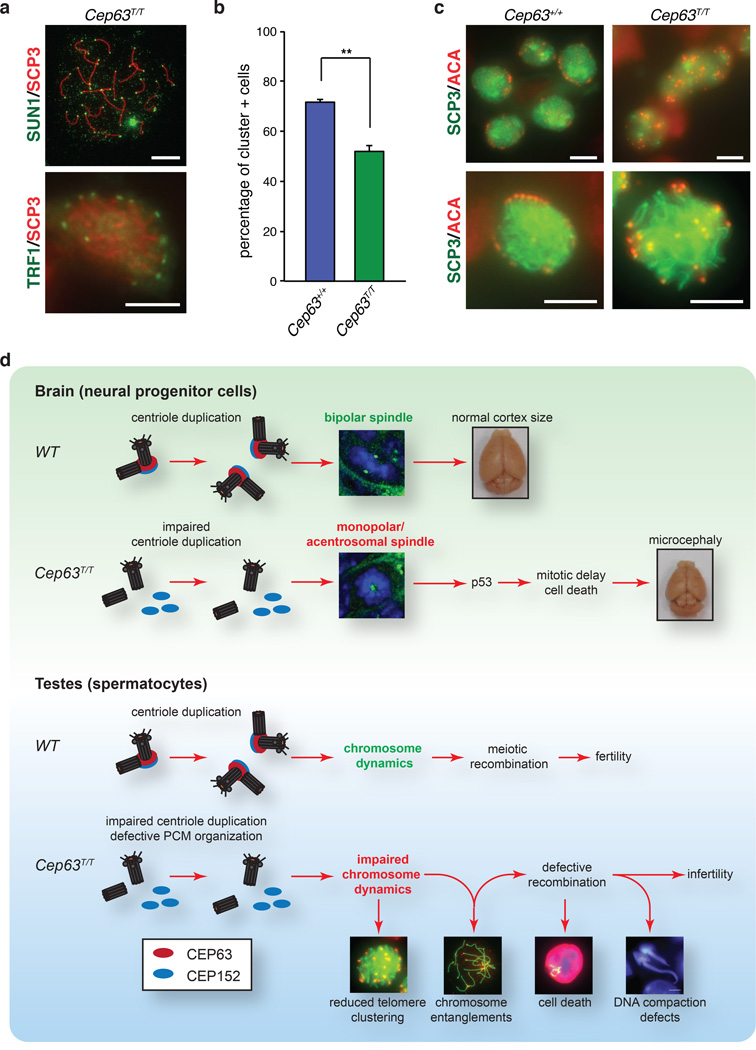
CEP63 is a centrosomal protein that facilitates centriole duplication and is regulated by the DNA damage response. Mutations in CEP63 cause Seckel syndrome, a human disease characterized by microcephaly and dwarfism. Here we demonstrate that Cep63-deficient mice recapitulate Seckel syndrome pathology. The attrition of neural progenitor cells involves p53-dependent cell death, and brain size is rescued by the deletion of p53. Cell death is not the result of an aberrant DNA damage response but is triggered by centrosome-based mitotic errors. In addition, Cep63 loss severely impairs meiotic recombination, leading to profound male infertility. Cep63-deficient spermatocytes display numerical and structural centrosome aberrations, chromosome entanglements and defective telomere clustering, suggesting that a reduction in centrosome-mediated chromosome movements underlies recombination failure. Our results provide novel insight into the molecular pathology of microcephaly and establish a role for the centrosome in meiotic recombination.


Figures

Figure 1
Figure 1. Cep63 deficiency leads to growth defects and microcephaly
(a) Weights of newborn mice (p2) of the indicated genotype (Cep63+/+, +/T n = 11, Cep63T/T n = 5 pups). (b) Weight of p30 and p60 mice of the indicated sex and genotype (n = 13, 11, 16, 14, 13, 13, 18, 14 animals, respectively). (c) Examples of female littermate Cep63+/+and Cep63T/Tmice at p60. (d) Examples of p2 dissected brains of the indicated genotype with the relative cerebral cortex area compared. (e) Quantitative real-time PCR of the indicated genes using cDNA prepared from the cortex of p2 animals. Levels of mRNA expression relative to WT littermates is graphed using B2M and ACTB as a reference. (n=3 animals per genotype). (f) H&E stained coronal sections of Cep63+/+and Cep63T/T cortices from p2 animals with approximate area of higher magnification indicated (top panels). Higher magnification panels of the motor cortex stained with H&E (bottom panels, scale bar = 0.2 mm). (g) Quantification of p2 cortical thickness from the indicated genotypes and area (2 hemispheres per brain section were averaged, n = 3 animals is graphed). (h) Kaplan-Meier curve of mouse survival. No significant differences (Log-rank test) were observed over 600 days. The number of animals per genotype is indicated. In panels 1a and 1b, the median (thick line) with the 1st and 3rd quartiles of the boxplot (thin lines) are indicated. In 1e and 1g graphics with error bars represent the average plus standard deviation. Asterisks denote statistical significance (n.s.= not significant, * = p-value <0.05, ** = p-value < 0.01, *** = p-value < 0.001) determined by the unpaired two-way Student’s T-test (1a, 1g) or the unpaired two-way Wilcoxon rank sum test (1b).
Figure 2
Figure 2. Impaired CEP152 localization and mitotic defects in Cep63 deficient brains
(a) CEP152 is detectable at centrosomes, marked by γ-tubulin, in the cortex of WT (left panel) but not Cep63T/T (right panel) E14.5 embryos (scale bars represent 5 µm (left) and 2 µm (right)). (b) CEP63 is detectable at centrosomes, marked by γ-tubulin, in the cortex of WT (left panel) but not Cep63T/T E14.5 embryos (right panel). (scale bars represent 5 µm (left) and 2µm (right)). (c) Increased number and defective localization of mitotic cells (positive for p-H3Ser10) in the E14.5 cortex of Cep63T/T embryos (right panel) compared to WT (left panel). (scale bar = 50 µm). (d) Quantification of VZ surface and extra-VZ p-H3Ser10 positive mitoses in the indicated genotype (n = 5 and 3 animals per genotype, respectively). (e) Increased cleaved caspase-3 staining indicates increased cell death in the cortex of Cep63T/T embryos at E14.5 (right panel) compared to WT (left panel). (scale bar = 50 µm). (f) Some misplaced mitotic cells in the Cep63T/T cortex are intermediate progenitors (IPs) identified by positivity for Tbr2 (scale bars represent 50 µm (left) and 20 µm (right)). (g) Scoring of mitotic configurations in the E14.5 VZ. Categories and genotypes are indicated (n = 3 animals per genotype used, 102 Cep63+/+ and 150 Cep63T/T cells scored). (h) Scoring of γ-tubulin foci in metaphase and anaphase cells in VZ of E14.5 brain cortex. Mitotic cells were identified by staining sections with DAPI (DNA) and γ-tubulin (centrosome) and scored by morphology and γ-tubulin spot numbers (n = 3 animals per genotype used, 64 Cep63+/+ and 62 Cep63T/T cells scored). (i) Example images of acentrosomal (white arrowheads) and monopolar (yellow arrowhead) mitoses in Cep63T/T embryos (scale bar = 2 µm). All graphics with error bars are presented as the average plus standard deviation. Asterisks denote statistical significance (n.s.= not significant, * = p-value <0.05, ** = p-value < 0.01, *** = p-value < 0.001) determined by the unpaired two-way Student’s T-test (2d and 2h).
Figure 3
Figure 3. p53-dependent attrition of neural progenitors in Cep63 deficient embryos
(a) Strong induction of p53 in the cortex of Cep63T/T embryos compared to WTat E14.5 (scale bar = 50 µm). (b) Scoring of p53-positive cells in a (n = 2 animals per genotype). (c) Slightly increased levels of γH2AX can be visualized in the E14.5 cortex of Cep63T/T embryos compared to WT (scale bar = 50 µm). (d) Quantification of γH2AX-positive cells in c (n = 1 animal per genotype). (e) Dissected p60 brains (upper panel) and representative coronal sections from Cep63T/Tand Cep63T/Tp53−/−mice (lower panel). (f) Representative examples illustrating relative p60 motor cortex thickness in mice of the indicated genotype (scale bar = 0.2 mm). (g) Measurement of cortex thickness from sections of the motor or visual cortex with colors corresponding to genotypes in panel f (n = 3, 3, 2, 3, 2, 2 animals used per genotype, respectively). (h) Quantification of TUNEL staining (n = 6, 10, 4, 4 sections per animal were scored, sections from 2, 3, 1, 1 animals per genotype were used, respectively). (i) Misplacement of neural/stem cell progenitors (Sox2 positive) in Cep63T/T and Cep63T/Tp53−/−animals (scale bar = 50 µm). (j) Rescue of misplaced progenitors in Cep63T/Tp53−/−animals compared to Cep63T/T (n = 5, 3 and 3 animals per genotype, respectively). All graphics with error bars are presented as the average plus standard deviation. Asterisks denote statistical significance (n.s.= not significant, * = p-value <0.05, ** = p-value < 0.01, *** = p-value < 0.001) determined by the unpaired two-way Student’s T-test (3b, 3g, 3h and 3j).
Figure 4
Figure 4. Infertility and severe defects in testes development in Cep63T/T mice
(a) Comparison of testicle weight to WT littermates at p10, p60 and p165. Examples of dissected p60 testes are shown (n = 4, 3, 8, 8, 2 and 4 animals, respectively). (b) Testes sections from p5 animals were stained with antibody against WT1 (upper panels) and WT1 negative cells (spermatagonia, red arrows) were scored and plotted (lower panels). Reduced cell numbers in p5 tubules (bottom left panel) but proportionally similar numbers of spermatagonia (bottom right panel) were observed (results are combined from 4 Cep63+/T and 3 Cep63T/T animals. For Cep63+/T n = 201 and Cep63T/T n = 143 tubules scored). Individual values are shown in a scatterplot with the average (red line) and standard deviation (black lines) indicated. Tetraploidy was observed in some spermatagonia from Cep63T/T animals (upper right panel). (c) H&E staining of testes sections from p60 mice showing relative size and condition of tubules (scale bar = 100 µm in 10X panels and 50 µm in 40X panels). (d) Quantification of tubule size in the indicated genotypes (2 animals per genotype, n = 6 tubules per genotype measured). (e) Examples of TUNEL staining (scale bar = 50 µm). (f) Quantification of TUNEL positive tubules (n = 3 animals per genotype used, 279 Cep63+/+ and 266 Cep63T/T tubules scored). (g) Examples of aberrant spermatids from Cep63T/Ttestes squashes. DAPI stained tails are indicated with yellow arrows (scale bar = 5 µm). (h) Sperm counts from mice of the indicated genotypes (n = 4, 2 and 4 animals per genotype, respectively). All graphs with error bars are presented as the average plus standard deviation. Asterisks denote statistical significance (n.s.= not significant, * = p-value <0.05, ** = p-value < 0.01, *** = p-value < 0.001) determined by the unpaired two-way Student’s T-test (4a, 4d, 4f) or the unpaired two-way Wilcoxon rank sum test (4b).
Figure 5
Figure 5. Impaired meiotic progression in Cep63T/T mice
(a) Quantification of prophase I stages in meiotic cells of the indicated genotype based on co-staining of SCP1 and SCP3 (n = 3 animals per genotype used, 289 Cep63+/+ and 301 Cep63T/T cells scored). Quantification of RAD51 (b) and DMC1 (c) foci in the indicated stages of prophase I (assessed by SCP3 staining) from the indicated genotypes (Cep63+/+ n = 112 and 157, Cep63T/T n = 122 and 108 cells scored, respectively). (d) Quantification of γH2AX staining patterns in pachytene and diplotene cells (n = 3 animals per genotype used, 124 Cep63+/+ and 97 Cep63T/T cells scored), example spermatocyte spreads shown (scale bar = 10 µm). (e) Examples of aberrant SC structures observed in zygotene and pachytene spermatocytes from Cep63T/T spreads (scale bar = 10 µm). (f) Quantification of crossover formation using MLH1 staining. Reduced numbers of Cep63T/T pachytene cells have visible MLH1 foci (n = 3 animals per genotype used, 84 and 59 cells scored respectively). Examples of categories scored are shown right panels. (g) Scoring of MLH1 foci in pachytene cells with visible MLH1 foci. In the low percentage of Cep63T/T males that have visible foci, there is a significant increase in foci number (n=101 and 135 cells scored). MLH1 foci in females is comparable regardless of genotype (Cep63+/+ or +/− n = 2(M)/2(F) and Cep63T/T n = 3(M)/2(F) animals). Individual values are shown in a scatterplot with the average (red line) and standard deviation (black lines) indicated. All graphs with error bars are presented as the average plus standard deviation. Asterisks denote statistical significance (n.s.= not significant, * = p-value <0.05, ** = p-value < 0.01, *** = p-value < 0.001) determined by the unpaired two-way Wilcoxon rank sum test (4g).
Figure 6
Figure 6. Centriole duplication failure during meiotic prophase I in Cep63T/T mice
(a) CEP152 and CEP63 are detectable at centrosomes, marked by PCNT, in the SCP3 staged prophase I cells of WT (left panels) but not Cep63T/T (right panels) (scale bars represent 5 µm (left) and 2 µm (right)). (b) Example images of centriole configurations detected by immunofluorescence microscopy in spermatocytes at the indicated stage and of the indicated genotype. The colors of the insets correspond to the colors used for the graph in panel h. (c) Quantification of centriole numbers in prophase I spermatocytes at the indicated stage and of the indicated genotype. Example images are shown in panel b and in Supplementary Fig. 5. Average centriole number per stage is indicated (black line) and the value rounded to a whole number shown numerically below (3 animals per genotype used, Cep63+/+ n = 121, Cep63T/T n = 130 cells scored). (d) TEM analysis of centriole configurations in WT and Cep63T/T spermatocytes at the indicated stages. The arrowhead points to a daughter centriole growing from the wall of the mother (scale bar = 400 nm). (e) Co-distribution of the two PCM markers PCNT and CDK5RAP2 in squashes of WT spermatocytes. SCP3 staining was used for staging. (f) Examples of PCM extrusion patterns detected by PCNT staining in WT and Cep63T/T spermatocyte squashes. SCP3 staining was used for staging. The insets show magnifications of the PCM region, with extrusions labeled by numbers (scale bar = 5 µm). (g) Quantification of centrosome extrusions (PCNT staining) in spermatocytes of the indicated genotypes (n = 2 animals per genotype used, 92 Cep63+/+ and 87 Cep63T/T cells scored). (h) Quantification of PCM distribution (PCNT staining) patterns in spermatocytes from WT and Cep63T/Tmice (n = 3 animals per genotype used, 121 Cep63+/+ and 130 Cep63T/T cells scored). Additional PCM marker analysis is included in Supplementary Fig. 6. All graphs with error bars are presented as the average plus standard deviation.
Figure 7
Figure 7. Reduced telomere clustering in Cep63T/T mice
(a) Telomeric attachment in spermatocytes visualized by staining with SUN1 (top picture – pachytene spread, scale bar = 10 µm) or TRF1 (lower picture – equatorial plane from pachytene squash, scale bar = 5 µm). (b) Quantification of cells with clustered telomeres, indicative of bouquet formation, in p10 spermatocytes of the indicated genotype (Cep63+/+ n = 4 and Cep63T/T n = 5 animals per genotype used, 274 and 407 cells scored, respectively). Graph with error bars shows the average plus standard deviation. Asterisks denote statistical significance (n.s.= not significant, * = p-value <0.05, ** = p-value < 0.01, *** = p-value < 0.001) determined by an unpaired two-way Student’s T-test. (c) Representative squash images from cells of the indicated genotype staining with ACA (centromere/telomere) and SCP3 (SC), scale bar = 5 µm. (d) Model of CEP63 function in normal brain and testes development. See text for description.

References

    1. Qvist P, et al. CtIP Mutations Cause Seckel and Jawad Syndromes. PLoS Genet. 2011;7:e1002310. - PMC - PubMed
    1. Griffith E, et al. Mutations in pericentrin cause Seckel syndrome with defective ATR-dependent DNA damage signaling. Nat Genet. 2008;40:232–236. - PMC - PubMed
    1. O’Driscoll M, Ruiz-Perez VL, Woods CG, Jeggo PA, Goodship JA. A splicing mutation affecting expression of ataxia-telangiectasia and Rad3-related protein (ATR) results in Seckel syndrome. Nat Genet. 2003;33:497–501. - PubMed
    1. Thornton GK, Woods CG. Primary microcephaly: do all roads lead to Rome? Trends Genet. 2009;25:501–510. - PMC - PubMed
    1. Sir JH, et al. A primary microcephaly protein complex forms a ring around parental centrioles. Nat Genet. 2011;43:1147–1153. - PMC - PubMed

Publication types

Supplementary concepts